Reversal Candlestick Patterns: A Trader's Practical Guide
On this page
Why Candle Shapes Alone Won’t Save Your Trades
A hammer appears on the chart.
The trader clicks buy.
Ninety minutes later the stop is gone and the “reversal” turns out to have been a pause inside a downtrend that never ended.
This happens thousands of times a day, and the cause is almost always the same: the shape got recognised, the context got ignored.
A candle with a long lower wick tells you sellers pushed price down and buyers pushed it back.
That’s it.
Whether that matters depends entirely on where it happened.
Reversal candlestick patterns signal a temporary shift in order flow at a specific price, not a guaranteed change in trend. They are evidence, not verdicts.
Treating them as verdicts is how accounts get drained slowly and then quickly.
What follows is a working process rather than a picture book. You’ll get objective qualification rules for each pattern, a precise definition of confirmation (the word most educational content leaves deliberately vague), and a risk framework that ties stop placement to the pattern’s own invalidation point.
A morning star on a stock chart with a volume spike is a different animal from the same shape on spot forex, where centralised volume doesn’t exist.
Crypto adds 24/7 trading with weekend liquidity holes.
Indices and commodities sit somewhere in between, with session-driven behaviour that changes what a wick actually means.
What Reversal Patterns Actually Mean
Japanese candlesticks were developed by rice traders in the 18th century to track sentiment, not price alone. That origin still explains their value.
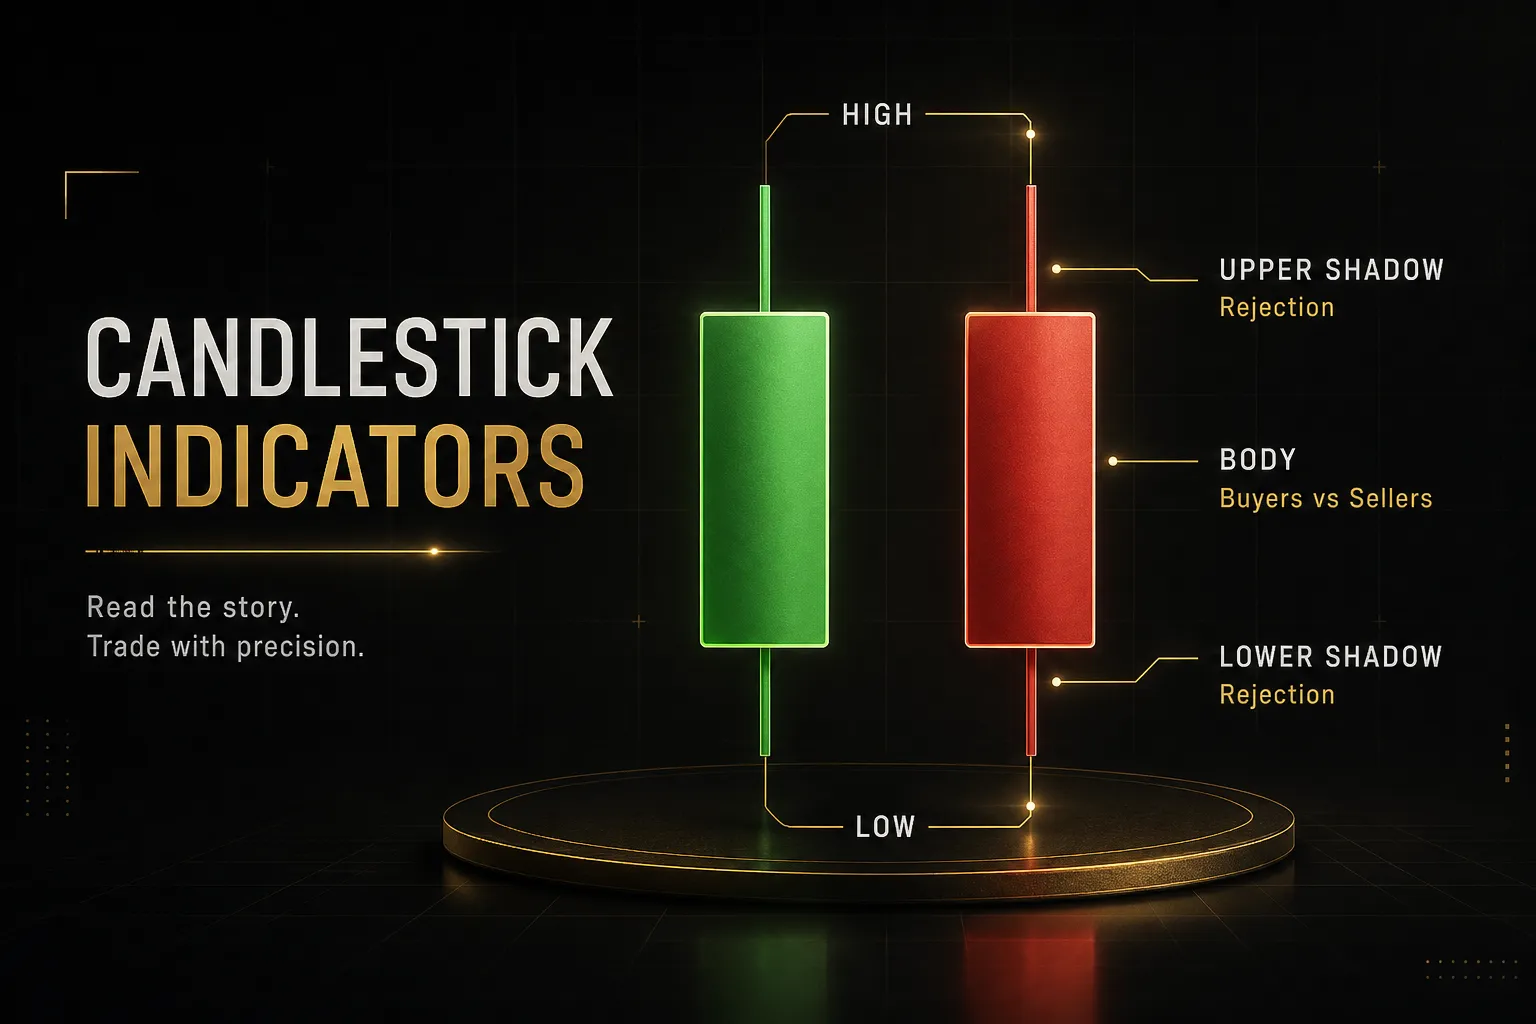
A candle body shows where the fight ended; the wicks show where it was fought.
A reversal candlestick pattern is visual evidence that buying and selling pressure shifted at a specific price level over a specific period.
Nothing more.
The bullish or bearish label attached to it is an interpretation layered on top of that raw information.
Consider candlestick anatomy in practical terms.
A long lower wick with a small body near the top means price traded much lower during the period and was bought back before the close.
Sellers had control and lost it.
That’s a real, observable fact about order flow.
But the same shape carries three entirely different meanings depending on location.
After a sustained downtrend, it suggests trend exhaustion, sellers running out of fuel at a level where buyers are willing to defend.
After an uptrend, the identical candle warns that buyers had to work hard to hold ground, a possible bearish reversal in the making.
Inside a sideways range, it means almost nothing.
Price bounced off the range low.
That’s what ranges do.
Order Flow, Not a Guarantee
Think of a reversal candle as a witness statement, not a court ruling.
It tells you what happened during one period.
It does not tell you what happens next.
Studies of candlestick performance across equity markets have consistently found hit rates clustering in the 45% to 60% range depending on the market, timeframe, and confirmation rule applied.
That’s an edge in some configurations and noise in others.
It is never certainty.
The pattern is the question. Confirmation and context are the answer.
This framing changes behaviour.
If you view a hammer as a prediction, you enter immediately and hold through adverse movement because you “know” the reversal is coming.
If you view it as evidence of a possible market structure shift, you wait for a second data point and you accept invalidation quickly.
The Prior-Trend Requirement
Here is the rule most traders skip: a reversal pattern requires something to reverse.
Without a measurable preceding trend, the shape is just a candle.
Set an objective threshold rather than eyeballing it.
A common working definition: at least five to ten consecutive candles in the same direction, or a move of at least 1.5 times the current average true range, or price trading below a declining 20-period moving average before a bullish reversal candle.
Pick one and apply it consistently.
Why does this matter so much? Because pattern-shaped candles appear constantly.
On a five-minute EURUSD chart you will find dozens of hammer-shaped candles per session.
Perhaps two of them sit at the end of a real directional move near a level that matters.
Calling every visually similar candle a reversal signal is the single most common error in price action analysis. It inflates the number of setups you see by a factor of ten and destroys trade expectancy, because the extra signals have no informational content at all.
Bullish and Bearish Signals Compared
Two candles can be pixel-for-pixel identical and mean opposite things.
That sounds like a flaw in the system.
It isn’t.
It’s the whole point: location supplies the meaning, the shape supplies the evidence.
The table below gives objective qualification rules.
Use them as filters, not suggestions.
A pattern that fails the wick-to-body ratio or the prior-trend test simply isn’t the pattern, no matter what it resembles.
| Pattern | Structure Requirements | Prior Trend Required | Implied Signal | Typical Invalidation |
|---|---|---|---|---|
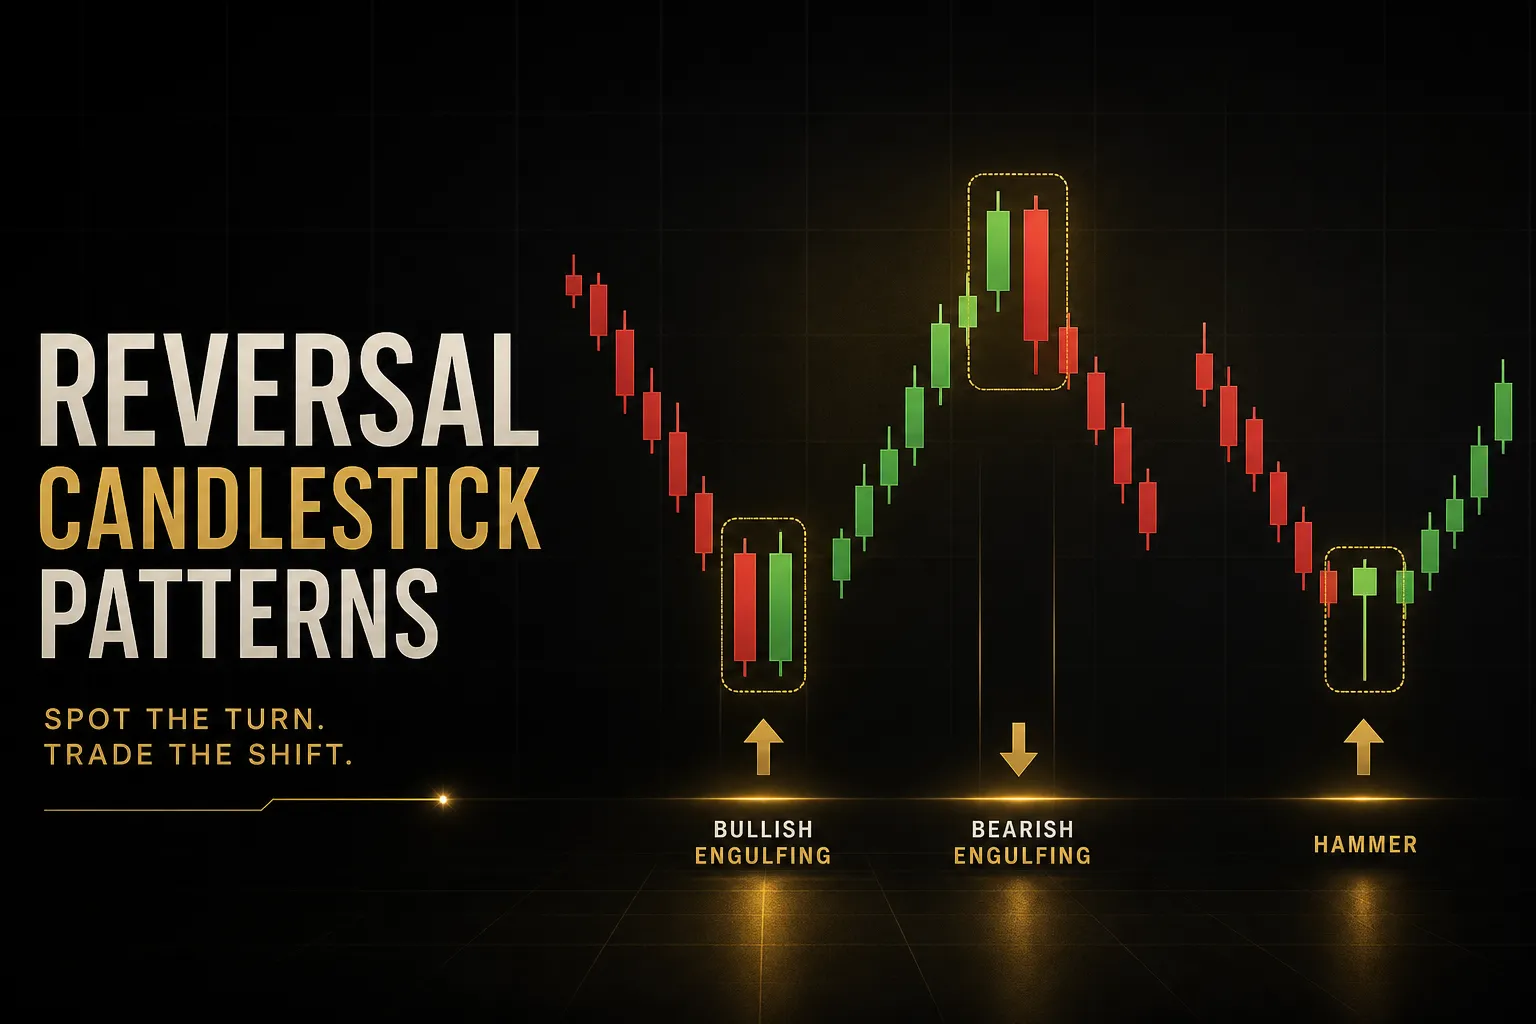
| Hammer | Lower wick at least 2x body; little or no upper wick; close in upper third of range | Downtrend | Bullish reversal | Close below the hammer low |
| Hanging Man | Identical to hammer: lower wick 2x body, close in upper third | Uptrend | Bearish reversal | Close above the candle high |
| Inverted Hammer | Upper wick at least 2x body; minimal lower wick; close in lower third | Downtrend | Bullish reversal (weaker; needs follow-through) | Close below the candle low |
| Shooting Star | Identical to inverted hammer: upper wick 2x body, close in lower third | Uptrend | Bearish reversal | Close above the candle high |
| Bullish Engulfing | Second candle body fully engulfs prior bearish body; closes above prior open | Downtrend (min. 5 candles) | Bullish reversal | Close below engulfing candle low |
| Bearish Engulfing | Second candle body fully engulfs prior bullish body; closes below prior open | Uptrend (min. 5 candles) | Bearish reversal | Close above engulfing candle high |
| Morning Star | Long bearish candle, small-bodied candle (gap or overlap low), long bullish candle closing above midpoint of candle one | Downtrend | Bullish reversal | Close below the star’s low |
| Evening Star | Long bullish candle, small-bodied candle, long bearish candle closing below midpoint of candle one | Uptrend | Bearish reversal | Close above the star’s high |
| Piercing Line | Bearish candle, then bullish candle opening below prior low and closing above prior midpoint (not above prior open) | Downtrend | Bullish reversal | Close below the two-candle low |
| Dark Cloud Cover | Bullish candle, then bearish candle opening above prior high and closing below prior midpoint | Uptrend | Bearish reversal | Close above the two-candle high |
Hammer vs Hanging Man
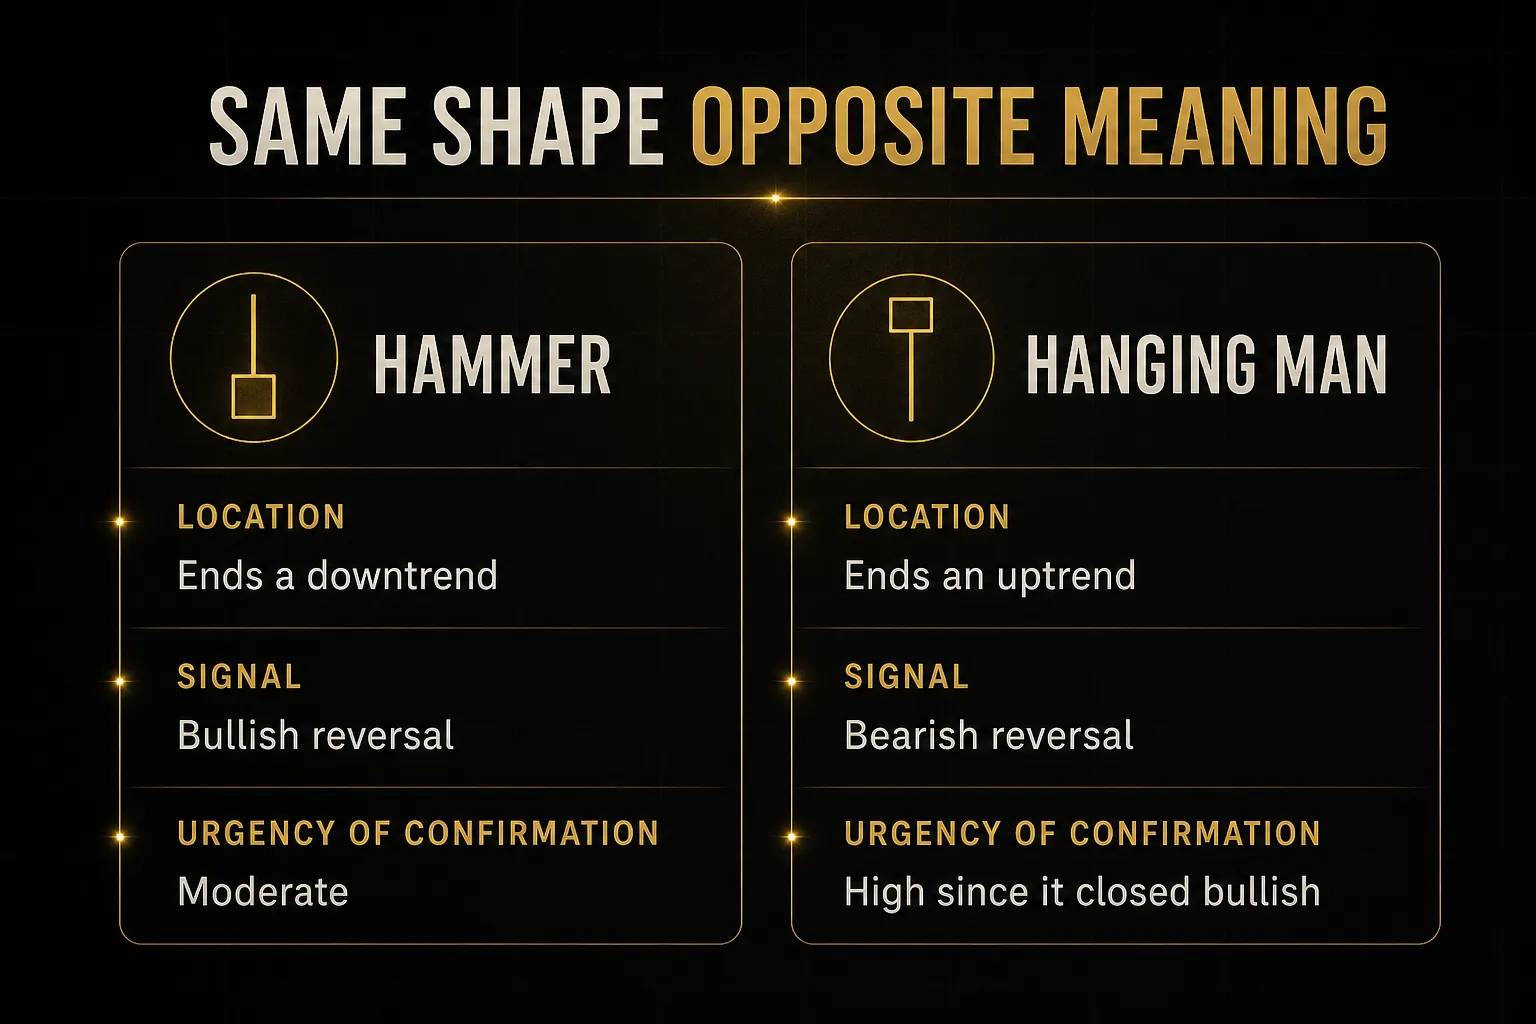
They are the same candle.
Full stop.
Long lower wick, small body near the high, negligible upper shadow.
A hammer sits at the bottom of a downtrend and says sellers tried to extend the move and got rejected.
A hanging man sits at the top of an uptrend and says sellers appeared in size for the first time, even though buyers recovered by the close.
The recovery is the reason a hanging man needs confirmation more urgently than a hammer does; it closed bullish while warning of bearish pressure.
Practical filter: measure the lower wick against the body. Below a 2:1 ratio, treat it as an ordinary candle with a tail, not a signal.
Inverted Hammer vs Shooting Star
Same story, flipped.
Long upper wick, small body near the low, minimal lower shadow.
The shooting star, appearing after an uptrend, is generally the more actionable of the two.
Buyers pushed into new highs and were sold hard back to the open.
That is a clean, readable rejection at a high, especially when it lands on prior resistance or into a liquidity zone above an old swing high.
The inverted hammer is trickier.
It appears after a downtrend and shows buyers attempting an advance that failed within the same period.
It closed weak.
Without a strong bullish candle immediately after, it frequently resolves as continuation rather than a bullish reversal.
Engulfing and Star Patterns
Multi-candle patterns generally outperform single candles, and the reason is mechanical: they require more participation to form.
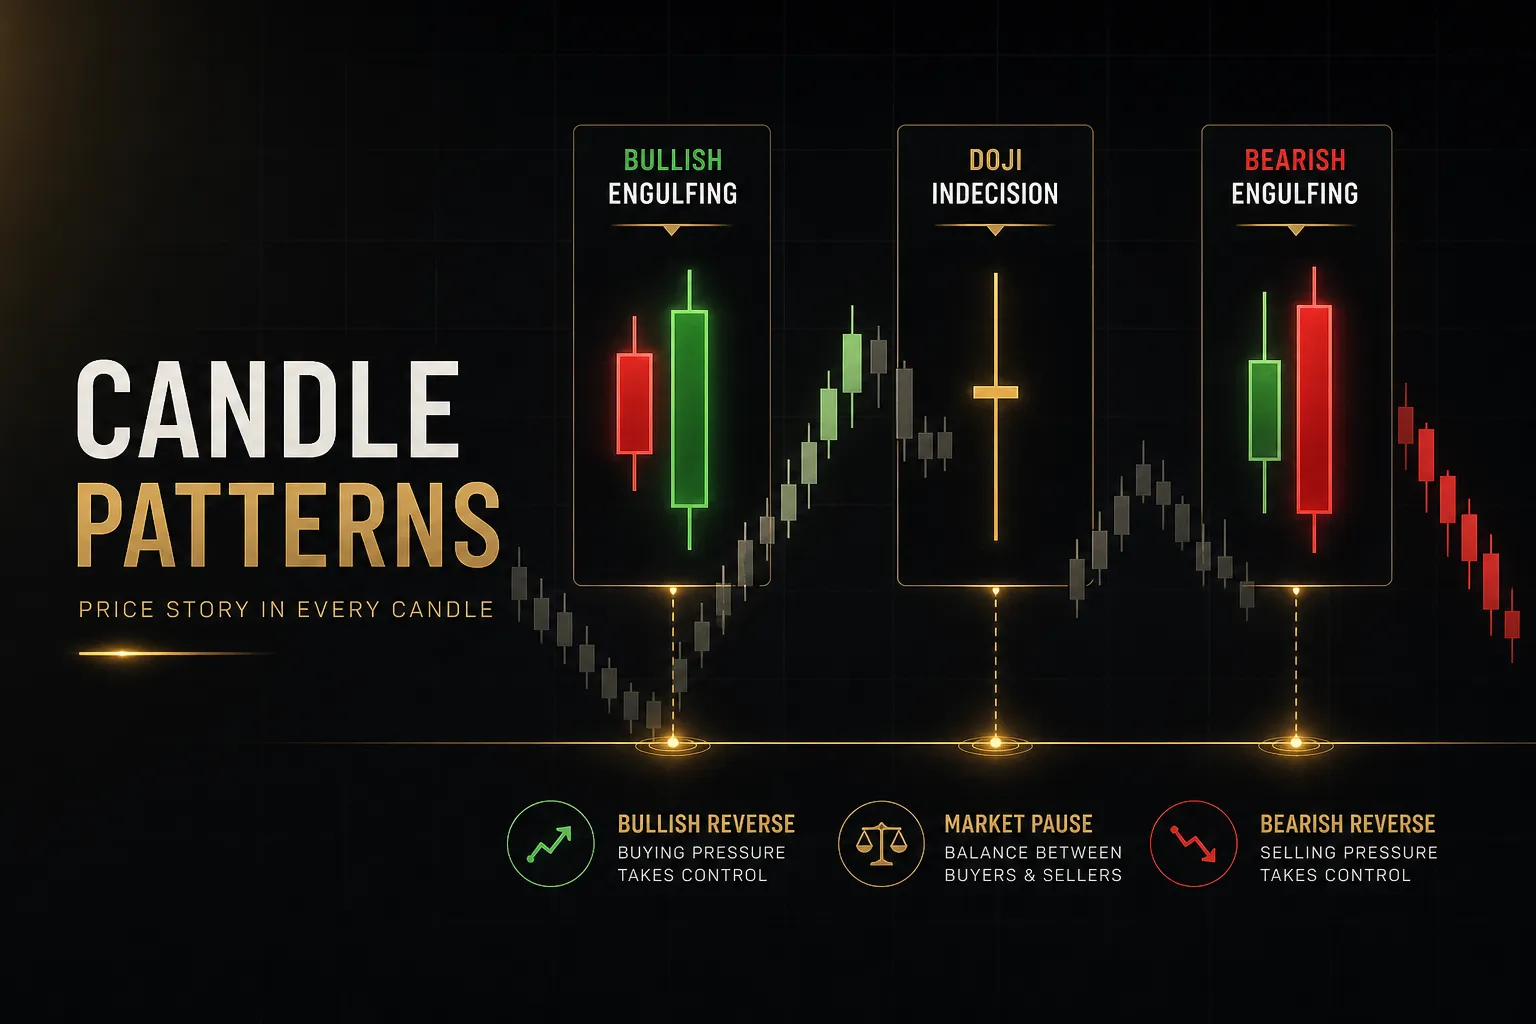
A bullish engulfing candle must contain the entire prior body and close above the previous open.
That means the period absorbed all the selling from the candle before it and then some.
On stocks, a genuine engulfing bar usually arrives with above-average volume confirmation. On forex, tick volume expansion serves as a rough proxy.
Star patterns add a third element: indecision in the middle.
The small-bodied candle (doji, spinning top) represents the moment the trend stalls.
The third candle then reverses through the midpoint of the first, which is why the midpoint rule is non-negotiable.
A third candle that closes at only 30% retracement is not a morning star; it’s a bounce.
Piercing lines and dark cloud cover are the weaker cousins of engulfing patterns, closing past the midpoint rather than fully reversing the prior body. They still qualify, but they earn a smaller position size in most rule sets.
Confirming the Signal Before You Act
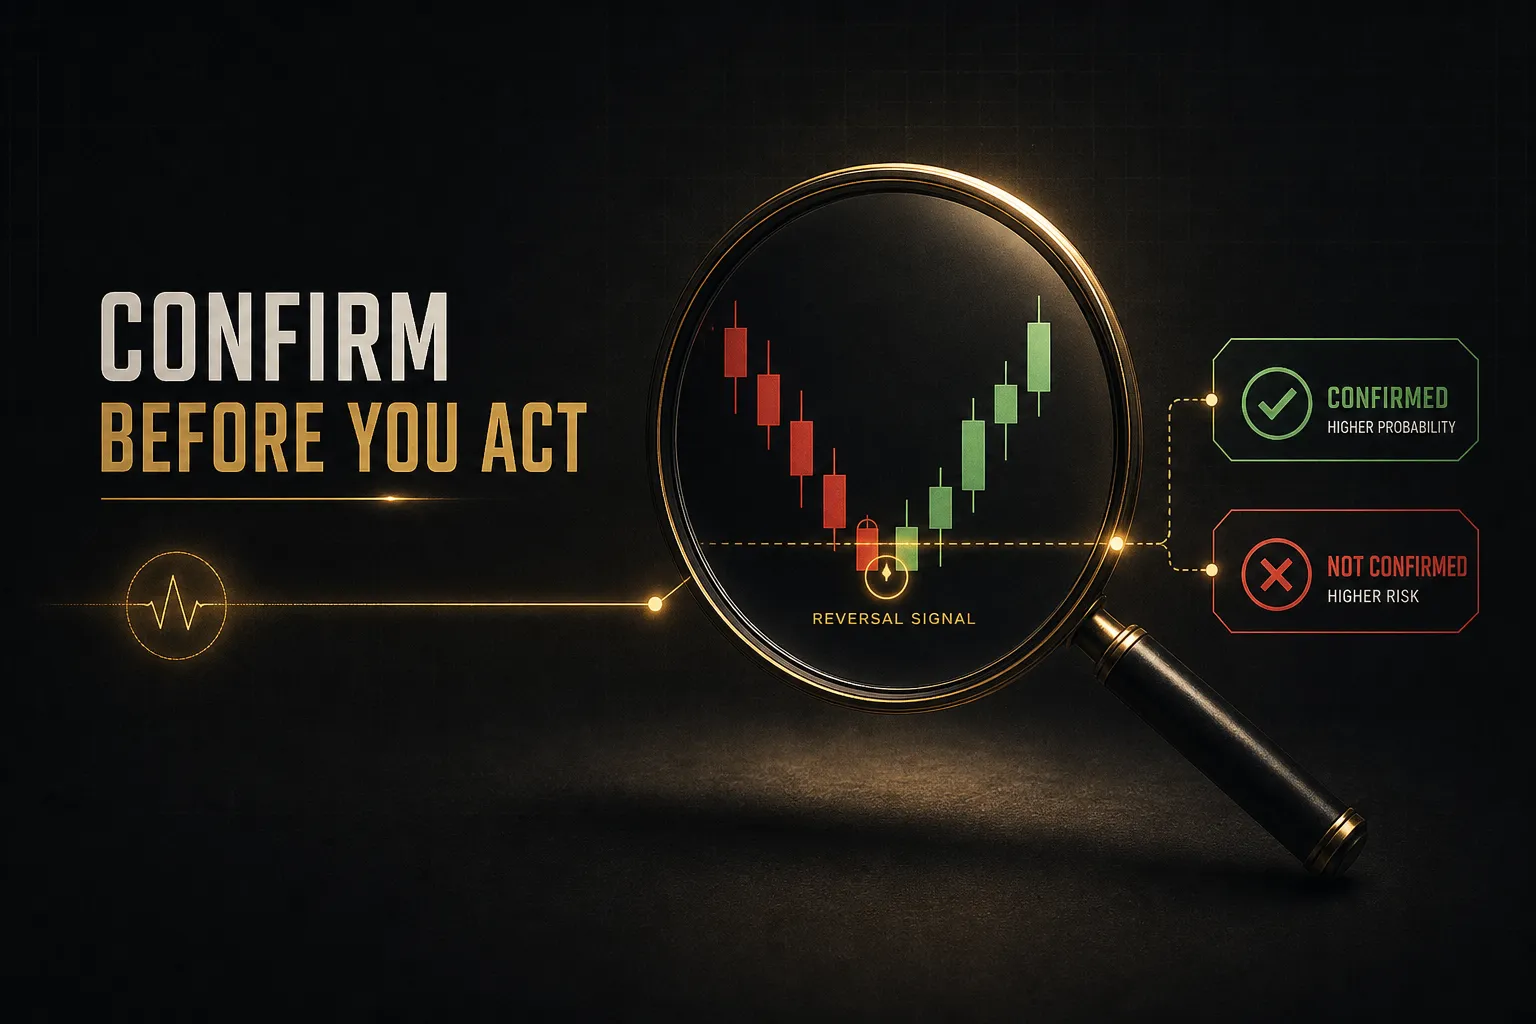
“Wait for confirmation” is the most repeated and least defined phrase in trading education.
Waiting for what, exactly?
For how long?
Vague advice produces vague execution, and vague execution produces random results.
What Actually Counts as Confirmation
Confirmation must be a specific, observable event that you could describe to another trader who would then identify the same moment on the chart.
Four qualify.
- Candle close confirmation beyond the pattern extreme. The candle after a bullish engulfing closes above the engulfing candle’s high. This is the cleanest and most testable rule. Not a wick through it, a close.
- Break of nearby market structure. Price takes out the most recent lower high (for a bullish reversal) or higher low (for a bearish reversal). This converts a pattern into a genuine market structure shift, which is a categorically stronger event.
- Momentum expansion. The follow-through candle’s range exceeds the recent average true range, or relative strength index crosses back out of oversold territory with the reversal. Expanding range means fresh participation, not drift.
- Follow-through on the next candle. Simply put: the next candle closes in the direction of the pattern with a body larger than its wicks. The weakest of the four, but usable on higher timeframes.
Choose one.
Write it down.
Apply it to every trade.
Mixing confirmation rules trade by trade means you can never measure whether any of them work.
Levels That Add Weight
A reversal candle in the middle of nowhere is a coin flip with extra steps. The same candle at a level where orders are already resting is a different proposition.
Proximity is what changes the odds.
A hammer forming directly on a weekly support level that has held three times carries far more information than one printing in open space 40 pips above it.
- Support and resistance: horizontal levels tested at least twice. The more recent and the more reactive, the better.
- Prior swing highs and lows: these hold stop orders, which is precisely why price often spikes through them and reverses. A shooting star just above an old high is frequently a stop raid.
- VWAP: heavily used by institutional desks in equities and increasingly in crypto. Reversals at VWAP on intraday charts have a mechanical reason to work.
- Liquidity zones and supply and demand areas: zones where price previously moved away with force. Unfilled orders may remain.
- Moving average alignment: a bullish reversal against a declining 200-period moving average faces a headwind. Aligned with it, tailwind.
The trade-off between anticipatory and confirmed entries is real and unavoidable.
Enter on the pattern close and you get a tighter stop and better risk-to-reward ratio, at the cost of more false signals.
Wait for confirmation and your win rate improves while your reward per trade shrinks, because the market has already moved.
Neither is correct.
What matters is knowing which one you’re using and having tested it.
Forex, Crypto, and Stock Differences
The same pattern behaves differently depending on market plumbing.
Spot forex has no centralised volume.
There is no exchange aggregating every trade, so your platform shows tick volume, a count of price updates rather than contracts traded.
It correlates reasonably with real activity but it is a proxy, not the thing itself.
Many forex traders substitute price displacement (candle range relative to average true range) as their participation measure.
Forex also rarely gaps, which breaks the textbook morning star definition that assumes a gap between candles one and two.
Use overlap rules instead: the star’s body must sit below the close of candle one, gap or no gap.
Rollover candles around 5pm New York produce distorted, thin-liquidity bars that generate false signals.
Session liquidity matters enormously; a shooting star during the London-New York overlap means something, the same shape during the Asian session on GBPJPY frequently doesn’t.
Stocks give you real volume confirmation and genuine overnight gaps, which makes classic pattern definitions work as originally written. The cost is gap risk against your stop.
Crypto trades 24/7 but liquidity is far from constant.
Weekend books thin out, and a bearish engulfing formed on Sunday morning thin volume can be entirely erased by Monday’s flow.
Exchange fragmentation means the pattern on one venue may not exist on another.
Check aggregate or high-volume venue charts before acting.
From Pattern to Trade
Recognition is maybe 20% of the job.
The rest is what you do with the recognition: where the stop goes, how much you risk, when you take profit, and crucially, when you pass.
Entry, Stop-Loss, and Targets
- Mark the invalidation point first. Before thinking about entry, identify the price that proves the pattern wrong. For a bullish reversal that is the low of the pattern’s extreme wick, plus a buffer of roughly 0.2 to 0.5 times average true range to survive spread and noise.
- Define the entry against your confirmation rule. Either the close of the pattern candle (anticipatory) or the close of the confirming candle beyond the pattern extreme. Log which one you used so you can compare performance later.
- Measure the invalidation distance in pips, points, or percent. This number, not a fixed lot size, drives everything that follows. A 12-pip stop and a 60-pip stop cannot carry the same position size.
- Size the position from fixed fractional risk. Risk a constant percentage of account equity per trade, commonly 0.5% to 1%. Position size equals risk amount divided by invalidation distance, adjusted for contract value. Add expected slippage and spread to the distance on volatile instruments.
- Set the first target at prior structure. The nearest opposing swing high, resistance level, or supply zone. If reaching it produces less than a 1.5:1 risk-to-reward ratio, the setup is not worth taking regardless of pattern quality.
- Use a measured move for the extended target. Project the height of the prior leg from the reversal point, or use a multiple of average true range. Partial exits at target one with a stop moved to breakeven is a common compromise between win rate and trade expectancy.
- Record the trade before the outcome is known. Pattern type, timeframe, level, confirmation rule, risk-to-reward ratio. Without this, backtesting your own live results is impossible.
When to Skip the Setup
The trades you don’t take shape your equity curve as much as the ones you do. A clean-looking hammer is not a reason to override a filter.
- Major scheduled news within 30 minutes. Non-farm payrolls, CPI, central bank decisions. Spreads widen, slippage spikes, and pattern logic dissolves into headline reaction.
- Low liquidity windows. Asian session on European crosses, the hour around forex rollover, crypto weekends, and the final minutes before a market holiday.
- Compressed or choppy ranges. If the last 20 candles have overlapping bodies and no directional bias, there is no trend to reverse. Every wick looks like a hammer in a range.
- Setups forming directly into an opposing level. A bullish engulfing with major resistance 10 pips overhead has nowhere to go. The reward side of the equation is already capped.
- Patterns on very low timeframes without higher timeframe support. A five-minute shooting star inside a strong daily uptrend is usually noise. A daily or H4 reversal at a weekly level is a different class of signal entirely, because it represents hours or days of aggregated order flow rather than minutes.
- After two consecutive losses on the same instrument in a session. Not a market rule, a behavioural one. Revenge sizing after a false breakout has ended more accounts than any pattern failure.
Multi-timeframe analysis solves most of these problems before they occur.
Read the trend on a timeframe four to six times higher than your execution chart, find your level there, then drop down to time the entry with a reversal pattern.
Alignment across two timeframes filters out the majority of low-quality signals.
Making Confirmation Systematic
Discretionary confirmation drifts.
On a good day you wait for the close; on a frustrating day you enter early because you “can see” where it’s going.
That inconsistency is what makes results impossible to evaluate.
The fix is mechanising the rule so the decision happens outside your emotional state.
Some traders do this with a written checklist and a timer.
Others use tooling.
As one practical example, systems built around candle-close confirmation and non-repainting logic, such as PipTrend’s multi-timeframe table with marked entry levels, exist specifically to stop the two failure modes described above: contradictory readings across timeframes and impulsive entries before a candle has actually closed.
The value isn’t the software itself.
It’s that the confirmation rule stays constant whether you’re up 3% on the week or down 3%.
Plenty of traders achieve the same discipline with a spreadsheet and a hard rule about acting only at candle close.
The method is negotiable.
The consistency is not.
Common Questions Traders Ask
What is the most reliable reversal candlestick pattern?
No pattern is universally most reliable, and any source claiming one is ignoring how testing works. Academic studies of candlestick performance show hit rates varying substantially by market, timeframe, sample period, and the confirmation rule applied, with the same pattern producing an edge in one equity index and none in another.
That said, when tested with candle close confirmation at established support and resistance, the bullish and bearish engulfing patterns and the morning and evening star tend to show more consistent results than single-candle signals. More candles means more participation, which means less noise.
What are the 3 major reversal patterns?
The three most widely used families are engulfing patterns, star patterns (morning and evening), and the hammer group (hammer, hanging man, inverted hammer, shooting star). Between them they cover the two-candle, three-candle, and single-candle cases.
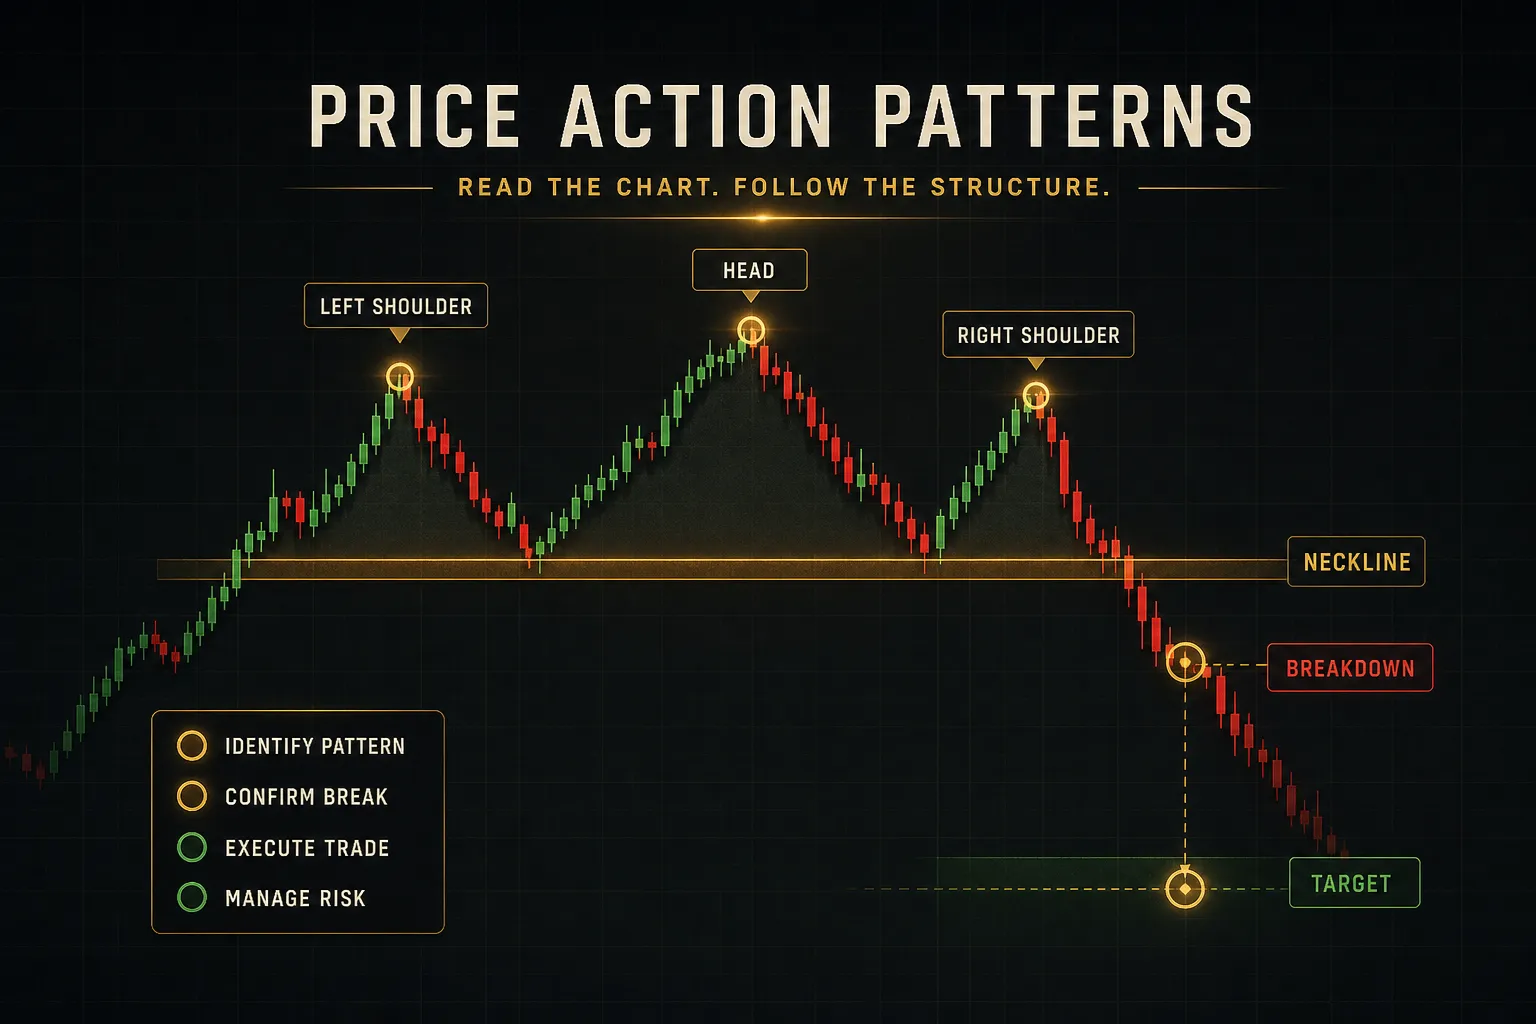
If you trade chart patterns rather than Japanese candlesticks, the equivalent trio is head and shoulders, double top or bottom, and the rising or falling wedge. Different scale, same underlying idea of trend exhaustion.
How do you identify a reversal candle?
Check three things in order: a measurable prior trend, a qualifying candle structure, and a meaningful level. Without the prior trend, of at least five to ten candles or 1.5 times average true range, the candle cannot be a reversal because there is nothing to reverse.
Then apply the structural test: wick at least twice the body for hammer-family patterns, or full body engulfment for engulfing patterns. Finally, confirm the candle sits at support, resistance, VWAP, or a supply and demand zone rather than in open space.
What candlestick pattern indicates a change in trend?
No single candlestick pattern indicates a change in trend on its own; a market structure shift does. The technical definition is price breaking the most recent higher low (for a downtrend reversal) or lower high (for an uptrend reversal) after the pattern forms.
Reversal candles are the early warning.
The structure break is the confirmation.
Traders who wait for both accept later entries in exchange for a materially higher probability that the trend has genuinely turned.
What is the strongest bullish reversal pattern?
On daily and H4 charts with volume confirmation, the morning star and the bullish engulfing tend to be the strongest bullish reversal signals, particularly when the reversal candle closes above the prior swing high. Both require substantial buying to complete, which is what separates them from a hammer’s single rejection wick.
Strength here is conditional, not absolute.
A bullish engulfing on the daily chart at weekly support with expanding volume is strong.
The same pattern on a five-minute chart mid-range is not.
What is the strongest bearish reversal pattern?
The evening star and the bearish engulfing generally show the most consistent bearish reversal edge on higher timeframes, especially when they form above a prior swing high after a liquidity sweep. The dark cloud cover is a weaker variant that closes only past the midpoint of the previous body.
One market-specific note: bearish reversals in equities often resolve faster than bullish ones because selling pressure compounds. In forex majors, where central bank flow dampens directional extremes, the asymmetry is much smaller.
Trade the Setup, Not the Shape
The decision rule fits in one line.
No prior trend plus no confirmation plus no level equals no trade, regardless of how textbook the candle looks.
Two out of three might justify a reduced-size entry.
One out of three is a chart you screenshot and walk away from.
Here is your next step, and it’s deliberately narrow.
Pick one pattern.
One timeframe.
One confirmation rule.
Then paper-test it across 20 occurrences, logging entry, stop, target, and outcome for each.
Twenty is not statistically bulletproof, but it will tell you more about your execution than a hundred hours of reading will.
The shift that separates consistent traders from pattern collectors is small but total.
Reversal candles are a probability tool for reading order flow at a moment in time.
Not a prediction engine.
Once you stop asking “what will this candle do” and start asking “what does this candle tell me about who is in control here”, the entire process becomes measurable… and measurable is the only thing that can be improved.
Sources
Risk Disclaimer: Trading involves risk. Past performance doesn't guarantee future results. Only trade with money you can afford to lose. PipTrend is a tool to assist your trading decisions, not financial advice.