
Want to identify the strongest trends and avoid false signals in 2025’s fast-moving markets? The adx indicator could be your edge. As volatility and algorithm-driven trading reshape the landscape, mastering the adx indicator gives you a powerful tool to measure trend strength, filter out noise, and trade with more confidence.
This guide covers everything you need to know: what the ADX is, how it works, setup and interpretation, step-by-step strategies, advanced tips, and the mistakes to avoid. Ready to master trend strength? Read on for actionable trading strategies designed for today’s markets.
Understanding the ADX Indicator: Basics and Components
Want to know what makes the adx indicator a favorite among traders in volatile markets? Let’s break down its essentials, so you can spot powerful trends and avoid market noise in 2025.
What Is the ADX Indicator?
The adx indicator, short for Average Directional Index, is a technical analysis tool that measures the strength of a market trend—without specifying its direction. Created by J. Welles Wilder Jr., it originally aimed to help commodity traders but now finds widespread use in forex, stocks, indices, and even crypto.
In fast-paced, algorithm-driven markets of 2025, traders rely on the adx indicator for its objectivity and ability to filter out false signals. Rather than just showing price movement, it quantifies whether a trend is genuinely gaining momentum or simply drifting sideways.
If you want a deep dive into the mechanics and evolution of this tool, check out this Average Directional Index guide for further insights.
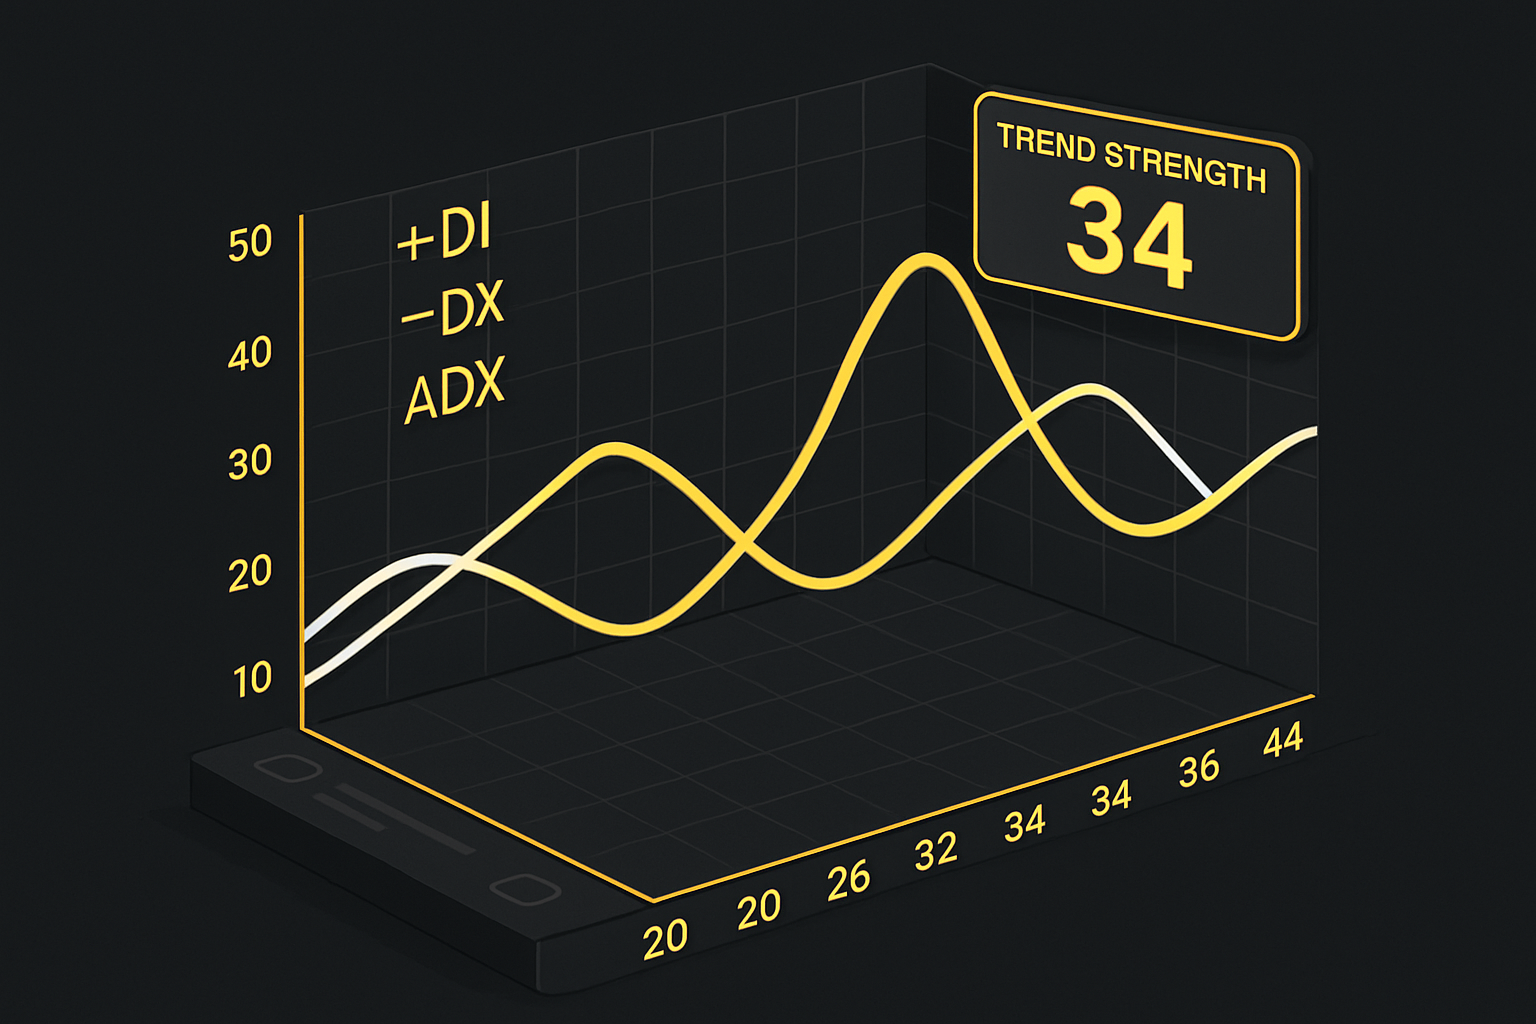
Components: ADX, +DI, and -DI
The adx indicator is part of a trio known as the Directional Movement System. Here’s how each part works:
- ADX line: Measures the overall strength of the trend, ranging from 0 to 100.
- +DI (Positive Directional Indicator): Gauges the strength of upward price moves.
- -DI (Negative Directional Indicator): Tracks the intensity of downward price moves.
These lines often appear together on your chart. When +DI crosses above -DI and the ADX line rises, you’re likely looking at a strong uptrend. If -DI is above +DI with a rising ADX, the trend is strong but downward.
| Component | Measures | Tells You About |
|---|---|---|
| ADX | Trend strength | How strong trend |
| +DI | Upward movement | Bullish momentum |
| -DI | Downward movement | Bearish momentum |
Remember, the adx indicator itself does not reveal trend direction—just its intensity.
How the ADX Is Calculated
Understanding how the adx indicator is calculated helps you trust its signals. The process involves:
- Calculating the true range for each bar to capture volatility.
- Measuring directional movement to see which way the market leans.
- Smoothing these values using Wilder’s method for reliability.
- Deriving the final ADX value, which is typically averaged over 14 periods (but can be adjusted).
Here’s a simplified formula:
ADX = 100 × (|+DI - -DI| / (+DI + -DI)) smoothed over n periods
The adx indicator is considered a lagging indicator, meaning it confirms a trend after it’s established. Values below 20 suggest a flat market, 20–40 indicate a trending phase, and above 40 mean a strong, persistent trend.
By knowing how the adx indicator works behind the scenes, you gain an edge in reading the true state of the market.
Setting Up and Interpreting the ADX Indicator in 2025
Getting the most out of the adx indicator in 2025 starts with proper setup and knowing how to read its signals. Whether you’re a beginner or an experienced trader, understanding how to configure, interpret, and optimize this tool is key for navigating today’s fast-paced markets. Let’s break down each step so you can confidently use the adx indicator in your trading routine.
How to Add ADX to Your Trading Platforms
Getting the adx indicator onto your charts is straightforward on most modern trading platforms. On TradingView, simply search for “ADX” in the indicator menu, then click to add it. MetaTrader users can find the adx indicator under “Trend” indicators—just drag it onto the chart. Most broker platforms offer similar access, typically through an “Add Indicator” button.
Customization is a breeze. You can adjust the period length (default is 14), change line colors for ADX, +DI, and -DI, and even overlay the indicator on your main chart or in a separate panel. Many platforms, like TradingView, allow advanced users to create multi-timeframe panels, displaying the adx indicator’s readings from different timeframes side by side. This is especially useful for traders who want to confirm trend strength across multiple periods.
For those wanting even more flexibility, some TradingView scripts combine ADX, +DI, and -DI from several timeframes into a single, consolidated panel. This approach gives you a bird’s eye view of market momentum—vital for spotting alignment or divergence in trend strength. For a deeper dive into current best practices for setting up and interpreting the adx indicator in the evolving 2025 market, check out the Understanding ADX in 2025 guide.
Reading and Interpreting ADX Values
Once you have the adx indicator set up, reading its signals is all about understanding its scale and the interaction of its three lines. The ADX line ranges from 0 to 100. If the value is below 20, the market is generally trendless. When the adx indicator climbs above 20, a trend may be emerging. Crossing the 25 mark often signals a trade-worthy trend, while readings above 40 indicate a strong, established trend. Extreme trends are rare but can see ADX values over 50.
To determine the trend’s direction, focus on the +DI and -DI lines. When +DI crosses above -DI and the adx indicator is rising, it’s a powerful sign of an uptrend. Conversely, if -DI overtakes +DI as the ADX increases, a downtrend is likely underway.
Many platforms enhance interpretation with color-coded histograms or overlays. For example, a green ADX area might highlight a strong trend, while yellow could signal caution. These visual cues help traders react quickly without constantly analyzing raw numbers. By combining ADX values with DI crossovers, you can filter out false signals and confirm when a trend is truly gaining strength.
Common Settings and Best Practices
The default period for the adx indicator is 14 bars, but this isn’t set in stone. Intraday traders often shorten the period to 7 or even 3 for faster signals, while swing or position traders might extend it up to 30 for smoother, less frequent signals. Smoothing methods also matter—Wilder’s original smoothing is standard, but EMA and SMA options provide different balances between lag and sensitivity.
Choosing the right settings depends on your asset and trading style. For volatile markets, a shorter DI length can catch quick moves, while calmer assets benefit from longer periods. Always backtest any changes to avoid overfitting your strategy to historical data. Remember, the adx indicator is most effective when used as a filter rather than a stand-alone signal, so combine it with price action or other tools for the best results.
Step-by-Step Guide: Using ADX for Trading Strategies in 2025
Ready to put the adx indicator to work in live markets? This step-by-step guide will help you navigate every stage, from spotting trend conditions to refining your approach for 2025’s fast-evolving landscape. Let’s break down each critical step so you can maximize trend strength while minimizing false signals.
Step 1: Identify Market Conditions
Start by using the adx indicator to determine if a market is trending or simply moving sideways. When the ADX value is below 20, it signals a lack of trend, meaning price action is likely choppy and range-bound.
- Avoid deploying trend-following strategies in these low-ADX environments.
- Markets with ADX under 20 often frustrate traders due to whipsaws and false starts.
- Wait for the ADX to climb above 20 before considering trend-based entries.
Being patient at this stage can save you from unnecessary losses and help you focus only on high-probability trading setups.
Step 2: Confirm Trend Direction with +DI and -DI
With the adx indicator showing a potential trend, it’s time to check direction. The +DI and -DI lines reveal whether bulls or bears are in control.
- A rising +DI above -DI signals a possible uptrend.
- A rising -DI above +DI points to a potential downtrend.
- Wait for a clear crossover and rising ADX to confirm momentum.
For example, if +DI crosses above -DI while ADX rises past 25, you have a textbook bullish signal. This dual confirmation helps reduce false positives and aligns your trade with the dominant force in the market.
Step 3: Validate Trend Strength
Not every trend is worth trading. The adx indicator quantifies how powerful a trend truly is. Only consider entering trades when the ADX value is above 25, confirming the trend has real strength.
- ADX between 20–25: Trend is emerging, but caution is warranted.
- ADX above 40: Indicates a strong, sustained trend—ideal for sizing up positions or holding trades longer.
- Rarely, ADX can exceed 70, marking "power trends" where momentum is at its peak.
Validating strength ensures you’re not chasing weak moves that could reverse quickly.
Step 4: Plan Entry and Exit Points
Once the adx indicator confirms trend direction and strength, plan your entries and exits. Enter after a crossover and rising ADX, but always consider price action or other supporting indicators.
Example entry logic:
If ADX > 25 and +DI crosses above -DI, and price breaks resistance, enter long.
If ADX > 25 and -DI crosses above +DI, and price breaks support, enter short.
- For exits, watch for the ADX peaking and starting to decline, or a reversal in DI lines.
- Combining ADX signals with RSI divergence or Bollinger Band squeezes can further improve timing.
This structured approach helps you avoid emotional decisions and stick to proven criteria.
Step 5: Risk Management and Stop Placement
The adx indicator is also invaluable for managing risk and setting stops. Strong trend signals allow for more dynamic stop placements.
- Place stops below/above recent swing points in the direction of the trend.
- Use ATR-based stops for volatile markets when ADX is high.
- Avoid tight stops in strong trends, as normal price fluctuations can trigger premature exits.
Proper risk management, guided by ADX readings, shields you from unexpected reversals and market noise.
Step 6: Review and Adjust Strategy
No strategy is set-and-forget. Continually review your adx indicator approach by backtesting on historical data and making adjustments as markets evolve.
- Optimize DI length and smoothing periods for your chosen asset and timeframe.
- Lower DI lengths (3–7) suit fast-moving, volatile instruments, while higher values (20–30) fit smoother markets.
- Regularly analyze performance and adapt to new volatility regimes.
For deeper insights into refining your ADX-based strategies, consult this ADX Trading Strategy Guide, which covers advanced techniques and risk management tips.
Advanced ADX Trading Techniques and Combinations
Unlocking the full power of the adx indicator in 2025 means going beyond the basics. As markets get faster and more complex, traders must combine tools, analyze multiple timeframes, and automate processes to stay ahead. Let’s explore how advanced techniques can elevate your trading, minimize false signals, and help you capitalize on robust market trends.
Combining ADX with Other Indicators
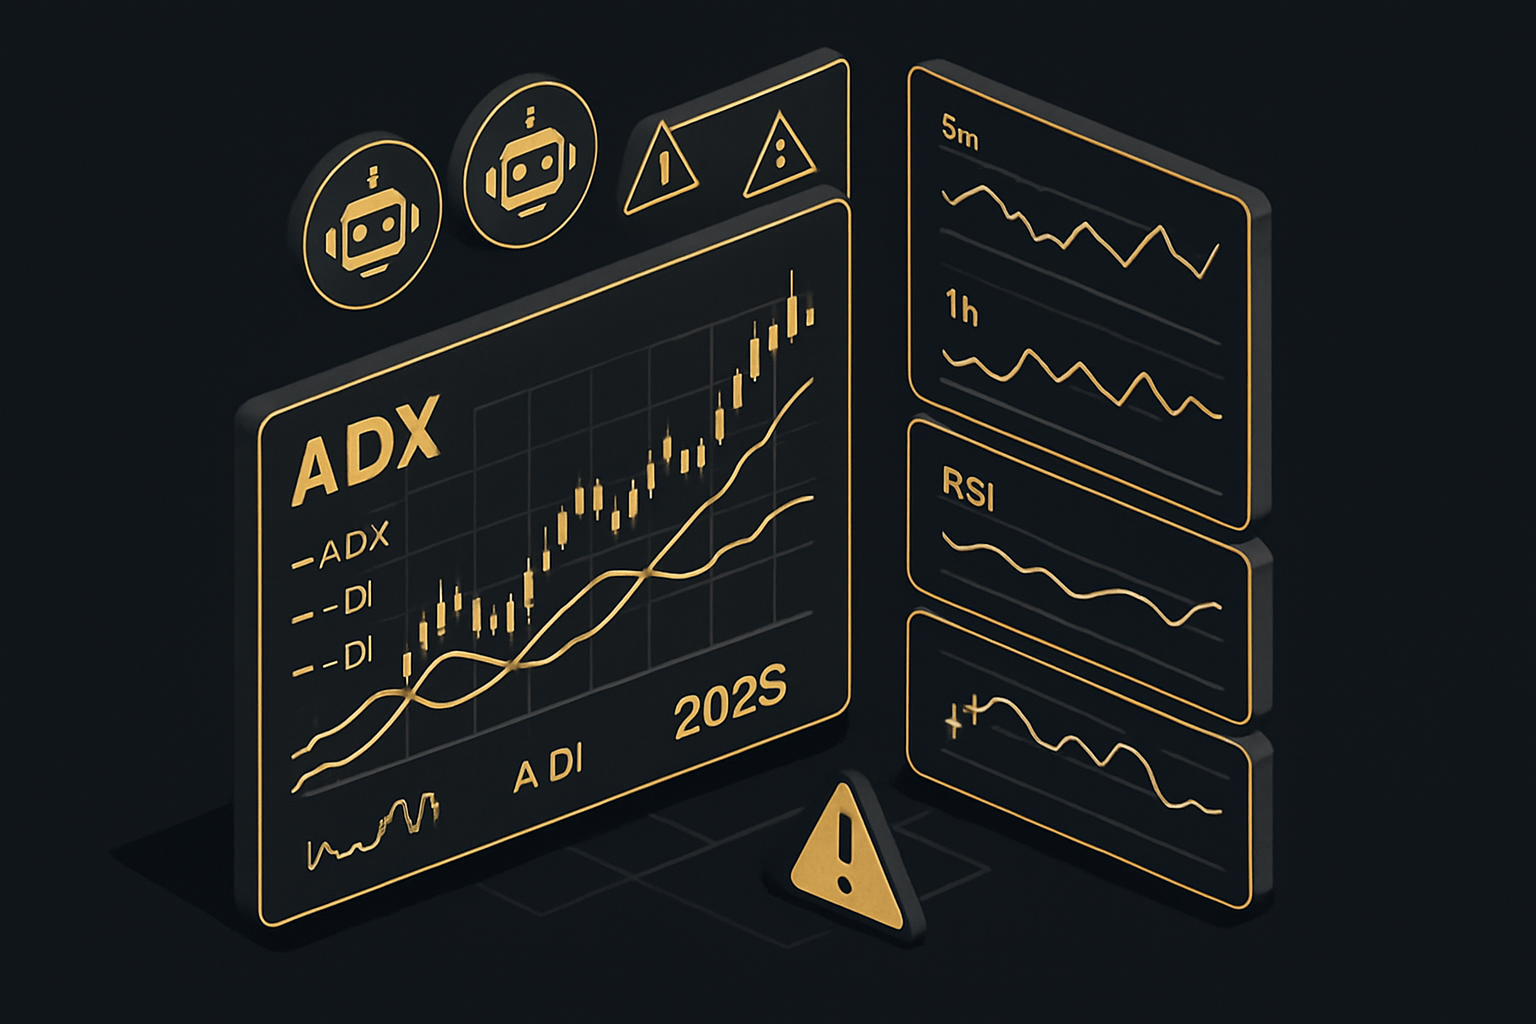
The adx indicator shines brightest when paired with other technical tools. By itself, it measures trend strength, but combining it with momentum or volatility indicators offers a clearer trading picture.
Popular pairings include:
- RSI (Relative Strength Index): Detects momentum shifts and divergence, helping confirm if a trend is likely to persist or fade.
- MACD (Moving Average Convergence Divergence): Adds momentum and trend direction, making entries and exits more precise.
- Bollinger Bands: Identify periods of low volatility (“squeezes”) that often precede explosive moves, which the adx indicator can help validate.
- ATR (Average True Range): Sets dynamic stop-loss and take-profit targets, matching trade management to trend volatility.
For example, traders might wait for the adx indicator to rise above 25, then look for RSI divergence to spot a high-probability reversal or continuation. Using these combinations reduces false signals and boosts confidence in your trades.
Multi-Timeframe and Custom Index Approaches
Advanced traders know that no single timeframe tells the whole story. Analyzing the adx indicator across multiple timeframes—like daily, 4-hour, and hourly charts—can filter out noise and improve entry timing. A strong trend on both the daily and 4-hour charts, confirmed by a rising adx indicator, offers higher conviction than a single-chart signal.
Multi-timeframe panels, now common in platforms like TradingView, let you view several adx indicator readings at once. Some even build custom indices, such as tracking gold’s trend strength versus the US dollar using dual adx indicator setups.
If you want to master this technique, check out this guide on multi-timeframe trading strategies for practical tips and step-by-step setups.
Algorithmic and Automated ADX Strategies
Automation is transforming trading in 2025. The adx indicator is a favorite filter in algorithmic systems, helping bots distinguish trending from ranging markets. A common approach is to program bots to only take trades when the adx indicator exceeds 25, reducing the risk of choppy, sideways action.
You can also set up alerts for adx indicator threshold crossovers or DI line events, ensuring you never miss a potential setup. For even smarter automation, combine the adx indicator with RSI, Bollinger Bands, and volume filters. Backtesting and forward-testing remain essential—verify your bot’s performance before going live.
Coding example:
if adx_indicator > 25 and plus_DI > minus_DI:
 execute_long_trade()
This snippet highlights how the adx indicator integrates into automated logic.
Avoiding Common Pitfalls with Advanced ADX Usage
While advanced techniques boost your edge, missteps can still happen with the adx indicator. Over-reliance is a big one: using the adx indicator as a stand-alone entry tool can lead to whipsaws, especially in low-volatility markets.
Watch for false positives. In sideways conditions, the adx indicator may briefly spike, tempting premature trades. Always confirm with price action or additional indicators.
Divergence detection—when price moves one way and the adx indicator another—can hint at reversals. But remember, the adx indicator is lagging, so use this insight cautiously and never as the sole signal.
Staying disciplined, combining signals, and continually optimizing your approach will keep your advanced adx indicator strategies robust as markets evolve.
Advantages, Limitations, and Best Practices for ADX in 2025
In 2025’s dynamic trading landscape, the adx indicator stands out as a reliable tool for assessing market trends. Understanding its strengths and weaknesses—and how to use it effectively—can give traders a significant edge.
Key Advantages of the ADX Indicator
The adx indicator offers several compelling benefits that make it a favorite among traders in 2025. First, it provides an objective measure of trend strength, which helps reduce emotional bias during volatile periods.
- Universal Application: The adx indicator works effectively across forex, stocks, crypto, and commodities.
- Trade Filtering: It helps filter out low-probability trades during sideways markets, minimizing unnecessary risk.
- System Integration: The adx indicator is easy to use in both manual strategies and automated trading systems.
- Algorithmic Adoption: High-frequency trading bots often use ADX as a trend filter, showcasing its versatility.
This objective approach enables traders to make more informed decisions, regardless of market conditions.
Limitations and How to Address Them
While the adx indicator excels at measuring trend strength, it does have limitations that traders must address. One key issue is that it’s a lagging indicator, meaning signals often appear after a trend has already started.
- False Signals: In choppy or range-bound markets, the adx indicator can generate misleading signals.
- No Directional Insight: ADX alone does not reveal trend direction—traders must also watch the +DI and -DI lines.
- Delayed Exits: Relying solely on ADX can result in late exits, as the indicator reacts after price moves.
To overcome these challenges, combine the adx indicator with leading indicators, volume analysis, or price action tools. This hybrid approach helps filter out false signals and sharpens trade timing.
Best Practices for Effective ADX Trading
To maximize results with the adx indicator, always confirm its signals with other technical tools or price structure. Adjust ADX settings based on the asset’s volatility and your chosen timeframe for greater accuracy.
- Use Alerts: Set up visual cues or alerts for timely responses to ADX and DI changes.
- Regular Reviews: Continually review and optimize your strategy as markets evolve.
- Avoid Overcomplication: Keep your chart clean—use the adx indicator as a filter, not the sole trigger for trades.
For a broader perspective on how the adx indicator fits among other popular trading tools, check out this Trading indicators overview. Many traders on advanced platforms use color-graded ADX panels for instant assessment, helping them adapt quickly to shifting markets.
Common Mistakes to Avoid When Trading with ADX
Trading with the adx indicator can be a game changer, but many traders fall into avoidable traps. Recognizing these common mistakes is crucial to improving your results and protecting your capital.
Misinterpreting ADX Readings
One of the most frequent errors is misreading what the adx indicator actually tells you. ADX measures trend strength, not direction. A high ADX doesn’t mean the market is bullish—it could signal a strong downtrend just as easily.
For example, a trader might see the ADX spike above 40 and assume it’s time to buy. However, if the -DI is above +DI, the market is likely in a powerful bearish phase. Always pair ADX readings with the direction of the DI lines to avoid this pitfall.
Overtrading in Low ADX Environments
Another common mistake is trading aggressively when the adx indicator is below 20. In these conditions, markets are often choppy and lack clear trends, leading to frequent whipsaws and frustrating losses.
If you find yourself entering trades during periods of low ADX, step back and wait for clearer setups. Patience pays off when using the adx indicator, especially in sideways or volatile markets.
Ignoring Confirmation from +DI and -DI
Relying solely on the adx indicator without checking the +DI and -DI crossovers increases the risk of false signals. The DI lines provide essential context by showing whether bulls or bears are in control.
For stronger trend confirmation, consider combining the adx indicator with other tools like the RSI indicator for trend confirmation. This approach can help filter out weak trends and prevent impulsive trades.
Using Inappropriate ADX Settings
Many traders stick with the default settings for the adx indicator, regardless of asset or timeframe. This can lead to lagging signals or missed opportunities.
For instance, using a 14-period ADX on a 1-minute chart may not capture fast market moves. Adjust your ADX period length based on your trading style and the volatility of your chosen market.
Neglecting Backtesting and Optimization
Failing to backtest your adx indicator strategies often leads to inconsistent results. What works on one asset class might not perform well on another, especially as market conditions evolve.
Regularly review and optimize your approach. For more comprehensive tactics, check out the Effective Use of ADX Indicator Guide for actionable strategies that emphasize trend strength analysis.
Overcomplicating with Too Many Indicators
Trying to combine the adx indicator with every tool under the sun can cause analysis paralysis. Too many indicators clutter your charts and make decision-making harder.
Instead, focus on a few high-quality filters and only add new tools that genuinely enhance your strategy. Remember, simplicity often leads to better execution and clearer signals.
Failing to Adapt to Market Evolution in 2025
Markets are more dynamic than ever, especially with 2025’s increased volatility and algorithmic trading. Relying on static adx indicator settings without adapting to new conditions can hurt your performance.
Stay flexible. Regularly update your strategies, monitor for shifts in market behavior, and be ready to tweak your approach as the trading landscape changes.
Frequently Asked Questions about ADX Trading
Navigating the world of trend trading? The adx indicator often sparks questions, especially as markets evolve. Here, we tackle the most common queries traders have about using the adx indicator for reliable results in 2025.
What is the ADX indicator used for in trading?
The adx indicator measures the strength of a market trend, helping traders distinguish between trending and ranging conditions. It is not designed to show direction—just how strong the current trend is.
By focusing on trend strength, the adx indicator helps filter out low-quality trades during sideways markets. Traders use it to confirm entries and exits, ensuring they only act when the market shows real momentum. This approach can improve accuracy and reduce emotional decision-making.
What are the best ADX settings for different trading styles?
Standard settings for the adx indicator use a 14-period lookback. However, adjustments can enhance responsiveness or stability:
| Trading Style | Period (Bars) | Notes |
|---|---|---|
| Intraday/Scalping | 7–10 | Faster, more signals |
| Swing Trading | 14–20 | Balanced, less noise |
| Position Trading | 20–30 | Smoother, slow to react |
For very short timeframes, some traders use a DI length of 3–7. The key is to test settings for your asset and timeframe. The adx indicator should be tuned to your specific market for optimal performance.
Which indicators work best with ADX?
The adx indicator is highly effective when paired with other tools. Popular combinations include:
- RSI: For spotting momentum divergence.
- MACD: For confirming trend direction.
- Bollinger Bands: For volatility and breakout signals.
Many traders build multi-indicator panels, combining the adx indicator with RSI or CCI for a more complete market view. This layered approach helps validate signals and reduce false positives.
Can ADX be used for all markets?
Yes, the adx indicator works across forex, stocks, crypto, commodities, and indices. Its calculation is based on price movement, making it versatile for any liquid asset.
Some traders even build custom indices—such as sector strength or currency baskets—using the adx indicator to compare performance. This flexibility is one reason for its enduring popularity in modern trading environments.
How do I avoid false signals with ADX?
To minimize false signals, combine the adx indicator with DI line crossovers, volume analysis, and price action. Avoid trading when the adx indicator is below 20, as markets are likely range-bound.
For extra confirmation, some traders use moving average filters or volume SMAs. Always wait for both trend strength and direction to align before entering a trade. For more actionable strategies, check out these Top 5 ADX Trading Strategies for practical examples.
Is the ADX indicator suitable for algorithmic trading?
Absolutely! The adx indicator is a staple in many algorithmic trading systems. Bots often use it to filter out sideways markets, trigger entries, or confirm trend continuations.
In automated setups, the adx indicator can be programmed to send alerts or execute trades when certain thresholds are crossed. This allows for consistent, rules-based trading—crucial for high-frequency or systematic strategies.
How do I interpret ADX divergence?
Divergence occurs when price moves in one direction, but the adx indicator or its DI lines show a different pattern. Regular divergence can hint at a weakening trend, while hidden divergence may suggest a trend continuation.
However, since the adx indicator is a lagging tool, use divergence signals carefully. Always confirm with price action or leading indicators before acting on a potential reversal.
What should I consider when using ADX in 2025?
For 2025, adapt adx indicator settings to match increased volatility and algorithmic market shifts. Use multi-timeframe analysis for confirmation, and consider integrating AI-powered tools for enhanced signal reliability.
Stay flexible—review and optimize your adx indicator strategy regularly as market conditions evolve. This proactive approach helps ensure your trading edge remains sharp.
Now that you have a solid understanding of how the ADX indicator works and how it can help you spot strong trends in 2025’s ever-changing markets, why not put your knowledge into action? If you’re ready to see clearer buy and sell signals, minimize guesswork, and trade with more confidence, there’s a smarter way to do it. PipTrend’s AI-powered trading tools are designed to make trend analysis easier, giving you real-time alerts and multi-timeframe clarity—just what you need for today’s fast-paced markets. Want to experience the difference for yourself?
See Your Trading Improve With PipTrend