
In today’s fast-paced markets, separating genuine trend strength from background noise is often the key to consistent trading results. Many traders find themselves guessing, unsure how to tell if a move is truly significant. The average directional index indicator offers a clear, objective way to quantify trend strength, cutting through uncertainty.
This comprehensive guide will empower you to master the average directional index indicator for 2026. We will cover everything from the core fundamentals and calculation steps to interpreting signals, integrating ADX into proven trading strategies, advanced techniques, and avoiding common pitfalls.
Ready to boost your technical analysis skills? Dive in and discover how the average directional index indicator can transform your trading approach.
Understanding the Average Directional Index (ADX) Indicator
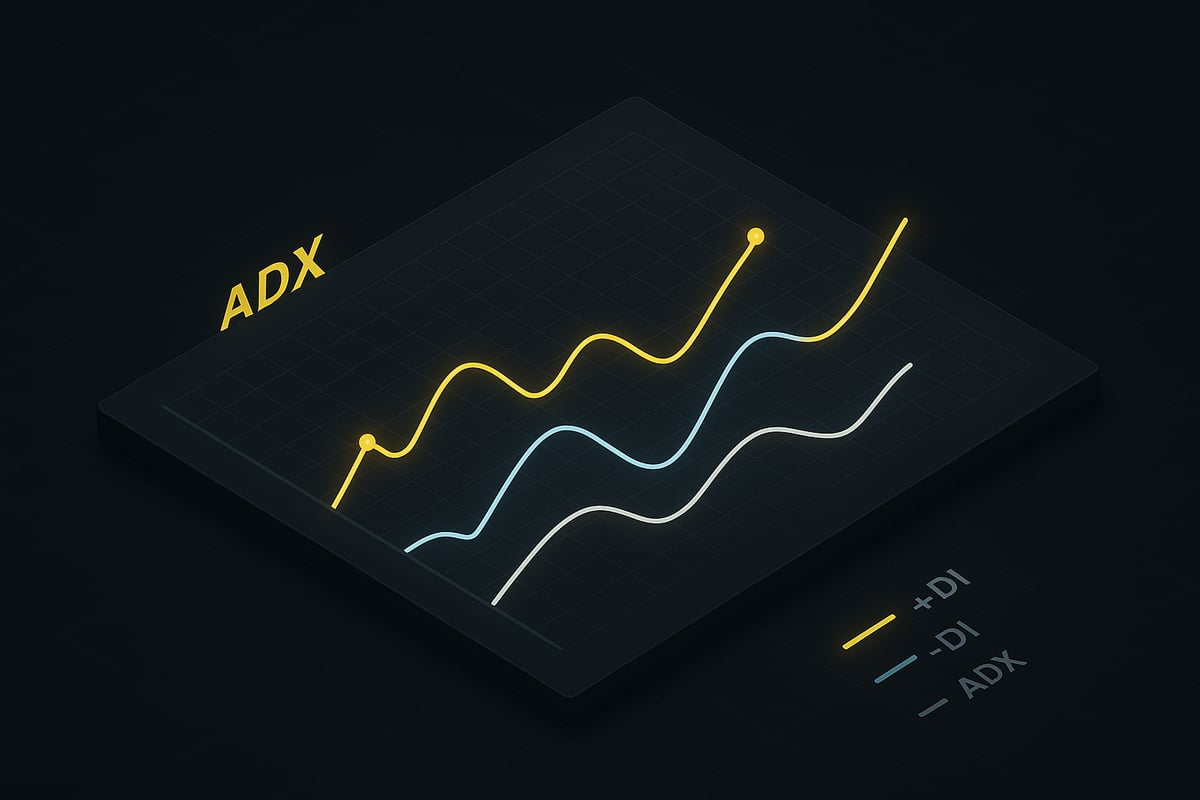
The average directional index indicator is a cornerstone of technical analysis for traders seeking objective ways to measure trend strength. Developed by J. Welles Wilder in 1978, the ADX was designed to cut through market noise and provide a clear, numerical assessment of whether a market is trending. The indicator is composed of three essential lines: the main ADX line, the Plus Directional Indicator (+DI), and the Minus Directional Indicator (–DI). These components work together to quantify trend strength, rather than direction, making the average directional index indicator valuable in forex, stocks, crypto, and commodities markets. Despite the evolution of trading technology, the ADX remains highly relevant, a point highlighted in Understanding the ADX Indicator.
What is the ADX?
The average directional index indicator serves as a gauge for the intensity of market trends. Unlike many indicators that focus on price direction, the ADX isolates the strength of a trend. First introduced in Wilder's "New Concepts in Technical Trading Systems," the ADX line quantifies trend vigor on a scale from 0 to 100. The +DI and –DI lines, plotted alongside it, identify which side of the market has the upper hand. The average directional index indicator is widely used across asset classes and is praised for its robustness, even as market dynamics have changed over decades.
The Theory Behind ADX: Trend Strength vs. Trend Direction
A common error is to confuse trend direction with trend strength. The average directional index indicator solves this by separating the two concepts. The +DI and –DI lines show whether bulls or bears are in control, but the ADX line itself measures only how strong the trend is, regardless of direction. For example, a rising ADX with +DI above –DI signals a strong uptrend, while a rising ADX with –DI above +DI points to a strong downtrend. In a flat or choppy market, the average directional index indicator typically reads low, indicating a lack of meaningful trend.
Key ADX Values and Their Interpretation
Interpreting the average directional index indicator involves understanding key threshold levels. Most traders use the following general guidelines:
| ADX Value | Trend Strength |
|---|---|
| 0–20 | Weak/No trend |
| 20–25 | Emerging trend |
| 25–50 | Strong trend |
| 50–75 | Very strong trend |
| 75–100 | Extremely strong |
When the average directional index indicator moves above 25, many traders use this as a filter for trend-following strategies. According to competitor research, ADX values between 25 and 50 are most commonly used to confirm robust market trends, while values below 20 often signal consolidation or sideways movement.
Why the ADX Remains Relevant in 2026
The average directional index indicator continues to adapt to the rapidly evolving trading landscape. In 2026, it is a staple in both discretionary and automated systems, thanks to its mathematical clarity and platform support. Whether coded into algorithmic bots or used by human analysts, the average directional index indicator is compatible with popular platforms like TradingView and MetaTrader. The ability to apply the ADX in multi-timeframe and cross-market strategies keeps it at the forefront of technical analysis, especially as AI-driven tools become standard in modern trading.
Limitations and Myths About the ADX
Despite its strengths, the average directional index indicator is sometimes misunderstood. Some traders mistakenly treat the ADX as a directional signal, but it only measures the strength of a trend, not its direction. It can also lag, especially in fast-moving markets. False signals may occur in choppy or range-bound conditions, so context is crucial. The average directional index indicator should always be used in combination with other tools and price action analysis to avoid common pitfalls and improve decision-making in real-world trading environments.
Calculating the ADX: Step-by-Step Guide for 2026
Understanding how to calculate the average directional index indicator is essential for traders aiming to accurately gauge trend strength. While most platforms automate this process, mastering the manual calculation gives you a powerful edge. Let us break down each step, so you can interpret ADX values with confidence in any market environment.
Step 1: Calculating Directional Movement (+DM and –DM)
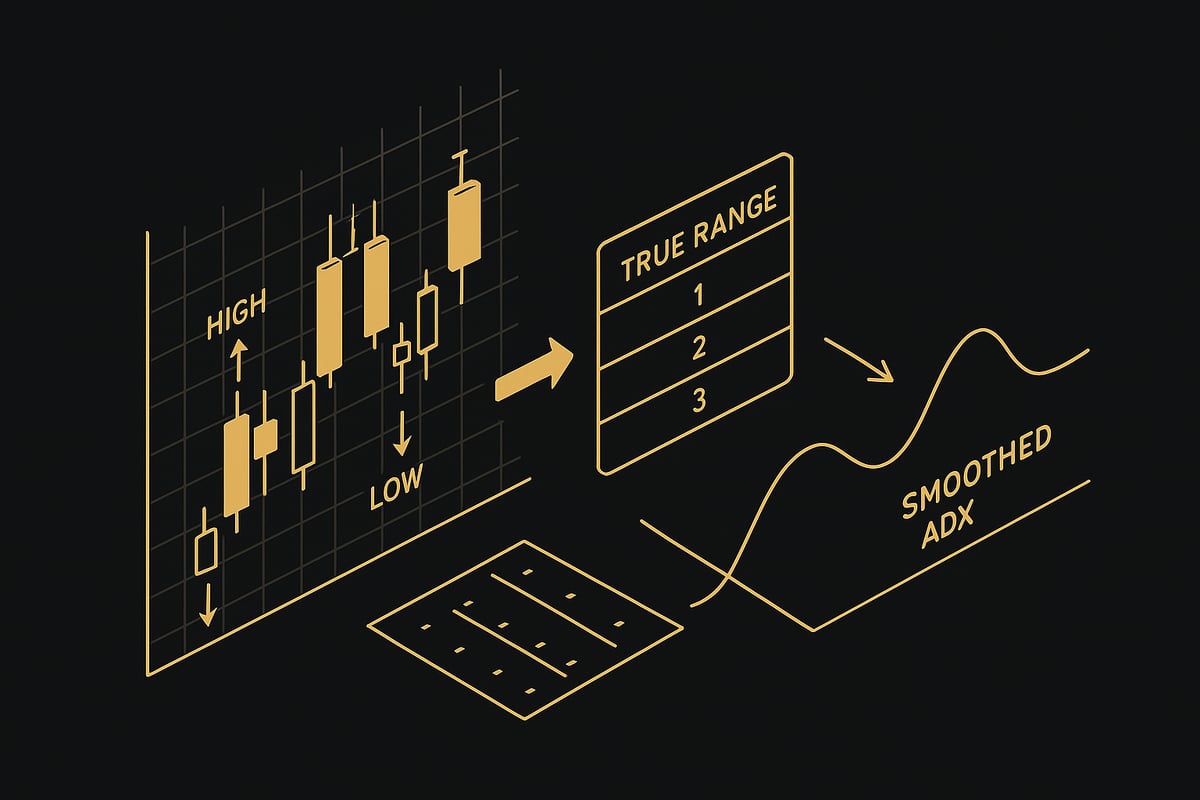
The first step in computing the average directional index indicator is identifying directional movement. Compare the current period’s high and low to the previous period’s values. If the difference between the current high and previous high is greater than the difference between the previous low and current low, you assign a positive directional movement (+DM). If the reverse is true, assign a negative directional movement (–DM).
- If both values are negative, set them to zero.
- Only one value is counted per period.
- This process isolates the dominant directional movement.
Understanding directional movement is critical, as it forms the basis for the entire average directional index indicator calculation.
Step 2: Calculating True Range (TR) and Smoothing
After establishing directional movement, the next part of the average directional index indicator calculation is determining the True Range (TR). True Range is the greatest value among these three:
- Current high minus current low
- Absolute value of current high minus previous close
- Absolute value of current low minus previous close
Apply Wilder’s smoothing technique to both TR and DM values. This smoothing averages out fluctuations, providing a more stable reading for the average directional index indicator. The formula for smoothing is:
Smoothed TR = (Previous Smoothed TR × (n – 1) + Current TR) / n
Smoothing ensures that the indicator responds to genuine market shifts rather than noise.
Step 3: Computing Directional Indicators (+DI and –DI)
With smoothed TR, +DM, and –DM in hand, you can now calculate the directional indicators. The average directional index indicator uses these values to quantify the strength of buying and selling pressure:
- +DI = (Smoothed +DM / Smoothed TR) × 100
- –DI = (Smoothed –DM / Smoothed TR) × 100
For example, if your smoothed +DM is 30 and your smoothed TR is 150, then +DI = (30 / 150) × 100 = 20. This process is crucial for distinguishing between bullish and bearish momentum. For an in-depth exploration of this relationship, see ADX and DMI Explained.
By understanding these calculations, you gain a clearer view of how the average directional index indicator reflects real market dynamics.
Step 4: Calculating the ADX Line
The final core step is calculating the ADX line itself. The average directional index indicator value is the smoothed average of the absolute difference between +DI and –DI, divided by their sum, then multiplied by 100:
ADX = 100 × (Smoothed |+DI – –DI|) / (+DI + –DI)
This step is repeated for each new period, using a typical 14-period setting. The ADX line rises as trend strength increases, regardless of direction. This makes the average directional index indicator especially valuable for confirming whether a market is trending or ranging.
Step 5: Modern Tools for ADX Calculation
Today, most trading platforms, such as TradingView, MetaTrader, and NinjaTrader, automatically calculate the average directional index indicator for you. Even so, understanding the manual process helps you avoid misinterpretation and ensures you trust the signals you see.
Many platforms also offer custom scripts for enhanced visualization and unique alerts based on the average directional index indicator. By knowing the fundamentals, you can better tweak these tools for your trading style and asset class.
Interpreting ADX Signals: Practical Application
Interpreting the average directional index indicator unlocks a new level of clarity for traders navigating complex markets. By understanding the ADX, +DI, and –DI lines, you can separate genuine trends from market noise, refine your entries and exits, and confidently integrate this tool into sophisticated trading strategies. Let us explore how to apply the average directional index indicator in real-world scenarios.
How to Read the ADX, +DI, and –DI Lines
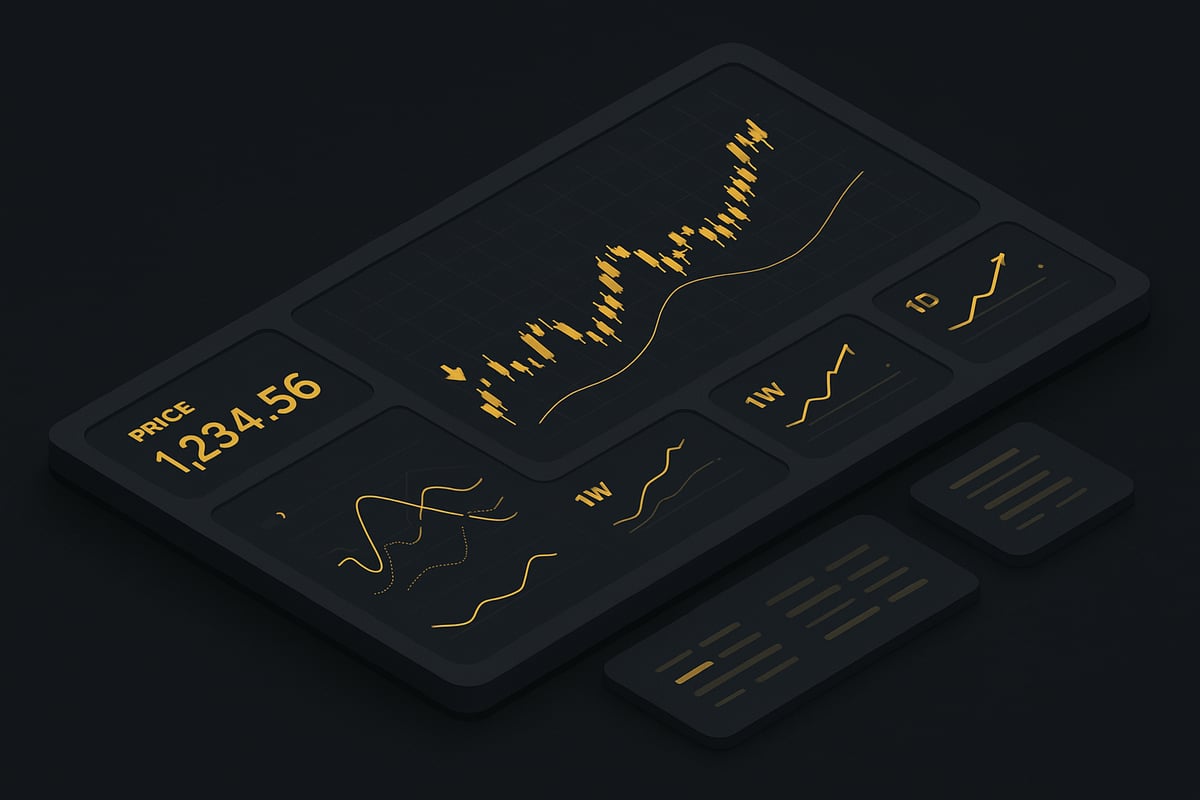
The average directional index indicator consists of three essential lines: the ADX, +DI, and –DI. The ADX line measures the strength of a trend, while the +DI and –DI lines indicate trend direction. When ADX rises, it signals that trend strength is increasing, regardless of whether the market is moving up or down. A falling ADX suggests weakening momentum.
For example, if ADX climbs above 25, it often confirms a strong trend is present. The +DI above –DI points to bullish conditions, while –DI above +DI signals bearish momentum. Monitoring the interaction of these lines gives traders a direct window into market dynamics.
Identifying Trend Strength and Trendless Markets
The average directional index indicator helps you differentiate between trending and range-bound environments. When ADX values are below 20, markets are typically consolidating or moving sideways, and breakouts may be imminent. Conversely, an ADX between 25 and 50 indicates a robust trend.
A practical approach is to scan for periods when ADX is low and then watch for a sharp rise, which can foreshadow significant price moves. In trendless markets, whipsaws and false signals are more common, so it is wise to adjust your strategy accordingly and avoid overtrading during low-ADX periods.
Directional Movement Crossovers: +DI and –DI
Directional movement crossovers act as actionable signals within the average directional index indicator framework. When the +DI line crosses above the –DI line, it often triggers a potential buy signal, especially if the ADX is rising. Conversely, a –DI crossing above +DI, accompanied by increasing ADX, may suggest a sell opportunity.
However, these crossovers are most reliable during periods of established trend strength. In ranging or choppy markets where ADX is low, crossovers can produce false signals. Always confirm crossover signals with other technical evidence and current ADX readings for better accuracy.
Using ADX for Entry and Exit Signals
The average directional index indicator can be a powerful tool for timing trade entries and exits. For entries, many traders wait for the ADX to rise above 25, confirming that a trend is strong enough to justify participation. Combining this with a +DI/–DI crossover increases the probability of success.
For exits, watch for a declining ADX, which may signal the trend is losing momentum. Additionally, reversal crossovers between +DI and –DI can prompt closing a position or tightening stop losses. Always complement these signals with price action and risk management protocols.
Combining ADX with Other Indicators
Integrating the average directional index indicator with other tools enhances your trading edge. For example, pairing ADX with RSI or MACD helps filter out trades during weak trends and confirms signals in trending conditions. Moving averages can further smooth price data, while volume indicators validate the strength behind moves.
For a deeper dive into how ADX fits within a comprehensive trading toolkit, you can consult the Top Trading Indicators Guide. This approach reduces false signals and increases confidence in your technical analysis decisions.
Interpreting ADX in Multi-Timeframe Analysis
Analyzing the average directional index indicator across multiple timeframes is a modern best practice. By checking ADX values on both higher and lower timeframes, traders ensure that their trade setups align with broader market trends. For example, a strong ADX on the daily chart, confirmed by a rising ADX on the hourly chart, increases the probability of a sustained move.
Advanced trading platforms often offer scripts or tools that automate this process, streamlining multi-timeframe ADX analysis. This method helps traders avoid conflicts between short-term signals and long-term market context, resulting in more robust strategies.
Integrating ADX into Winning Trading Strategies
Trading with the average directional index indicator gives traders a powerful edge when building robust strategies. By understanding how to apply the ADX in different market conditions, you can fine-tune your entries, exits, and risk controls. Let us explore proven methods to integrate the average directional index indicator into your trading approach for 2026.
Trend-Following Strategies with ADX
The average directional index indicator excels at confirming strong trends. Begin by scanning for assets where the ADX value rises above 25, indicating a robust trend is underway. Next, check the +DI and –DI lines; if +DI is above –DI, you have a bullish trend, and the reverse signals bearishness.
To enter a trend-following trade, wait for the ADX to confirm strength, then align your position with the prevailing direction. For example, in a stock with ADX at 32 and +DI above –DI, a long entry is favored. This systematic approach helps filter out weak trends, reducing false entries. For a comprehensive breakdown, see Average Directional Index (ADX) | Market strength | Fidelity.
Range-Bound and Mean Reversion Strategies
When the average directional index indicator drops below 20, markets are often consolidating. In these conditions, trend-following trades lose their edge, and mean reversion becomes more effective. Look for price oscillations between well-defined support and resistance levels.
A typical approach is to sell when the price reaches resistance and ADX remains low, or buy at support under the same conditions. Since breakouts are less likely, risk management is crucial. Always use stop losses, as sudden volatility can invalidate range setups. This tactical shift lets traders adapt their strategy to the market's rhythm, maximizing the utility of the average directional index indicator.
Advanced: ADX Crossovers and Signal Filtering
Refining your strategy with the average directional index indicator involves using ADX crossovers and combining signals. When ADX crosses above 25, it can act as a filter, allowing you to take only those RSI or MACD signals that align with a confirmed trend. This reduces whipsaws and increases your probability of success.
For example, you may use a moving average crossover as a primary trigger, but only enter trades if the ADX is above your set threshold. This layered approach adds a level of confirmation that can improve trade quality. By systematically filtering signals, the average directional index indicator becomes a gatekeeper for more disciplined trading.
ADX in Algorithmic and AI-Driven Trading Systems
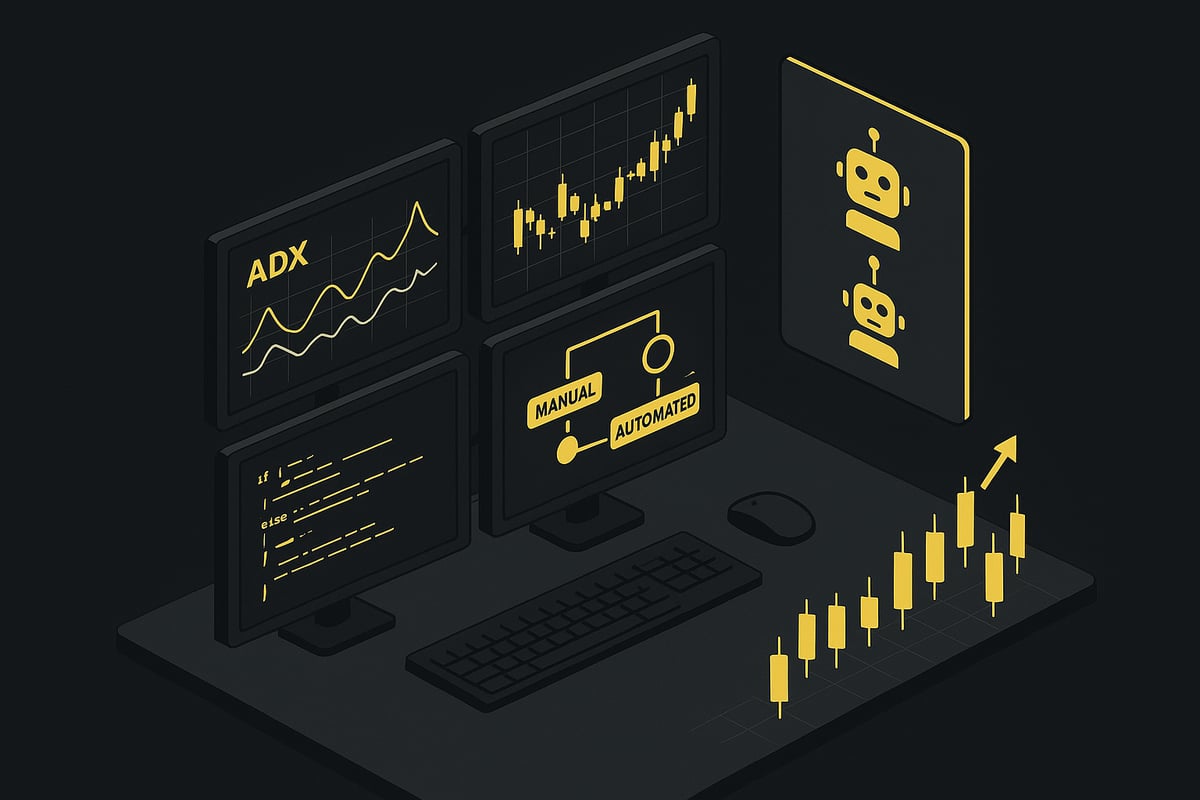
Modern trading bots often use the average directional index indicator as a key component in their logic. In algorithmic strategies, ADX thresholds define whether a bot will activate trend-following or mean reversion logic. AI models may optimize ADX parameters for specific assets or timeframes, adapting to changing volatility.
Backtesting platforms allow you to evaluate how different ADX settings affect performance, ensuring your strategy is robust. In 2026, integrating ADX with machine learning models provides adaptability and precision, making the average directional index indicator relevant for both discretionary and automated traders.
Case Study: Real-World ADX Strategy Example
Consider a scenario where a trader applies the average directional index indicator to EUR/USD on a 1-hour chart. ADX rises above 28, +DI crosses above –DI, and an RSI reading confirms momentum. The trader enters long, sets a stop loss below the recent swing low, and exits when ADX begins to decline or +DI crosses below –DI.
| Signal | Value | Action |
|---|---|---|
| ADX | 28 | Enter long |
| +DI vs –DI | +DI > –DI | Confirm trend |
| RSI | 62 | Confirm momentum |
| Exit Signal | ADX falls below 25 | Close trade |
This methodical approach highlights how the average directional index indicator, combined with other signals, creates a structured framework for trade decisions.
Common Mistakes and How to Avoid Them
Even experienced traders can misuse the average directional index indicator. Common pitfalls include:
- Over-reliance on ADX without considering price action or volume
- Misinterpreting +DI/–DI crossovers in choppy markets
- Ignoring market context or trading every crossover signal
To avoid these mistakes, always:
- Confirm ADX readings with additional indicators or chart patterns
- Use multi-timeframe analysis for broader context
- Prioritize quality signals over quantity
A disciplined approach ensures the average directional index indicator serves as a reliable guide rather than a source of confusion.
Advanced ADX Techniques and Customizations for 2026
Staying ahead in trading means adapting the average directional index indicator to new techniques and technologies. In this section, we explore how advanced customization, AI integration, and innovative visualizations can elevate your ADX-based strategies for 2026.
Multi-Timeframe and Cross-Market ADX Analysis
Applying the average directional index indicator across multiple timeframes and markets can reveal hidden trends and filter false signals. For instance, traders often confirm a trend on the daily chart before acting on a shorter timeframe. Cross-market analysis, like comparing a sector ETF’s ADX with its component stocks, boosts confidence in trend strength.
Automated scripts now make multi-timeframe ADX tracking seamless. For hands-on strategies and platform-specific setups, see Multi-Timeframe Trading Strategies for practical guidance on this approach.
Customizing ADX Periods and Settings
Adjusting the average directional index indicator period tailors its sensitivity to your trading style. The default 14-period setting is popular, but shorter periods (e.g., 7) respond faster, while longer periods (e.g., 21 or 28) provide smoother, more reliable signals for swing trading.
| Period | Use Case | Signal Type |
|---|---|---|
| 7 | Scalping | Fast, volatile |
| 14 | Standard | Balanced |
| 21+ | Swing/Position | Smooth, steady |
Test different periods on your chosen asset, as optimal settings may vary by market volatility and timeframe.
Visual Enhancements: ADX Clouds, Histograms, and Alerts
Modern charting platforms now offer enhanced ways to view the average directional index indicator. ADX clouds and shaded regions highlight strong trend periods visually, while histograms provide at-a-glance trend strength analysis. Custom alerts can notify you instantly when ADX crosses key thresholds or when +DI and –DI lines interact.
These visual enhancements help traders react swiftly and avoid missing important ADX signals. Explore these tools in your trading software to streamline your decision-making process.
Integrating ADX with AI-Powered Indicators
AI-driven tools are redefining how the average directional index indicator is used. Machine learning models can dynamically adjust ADX thresholds based on market conditions or combine ADX readings with pattern recognition for smarter trade signals.
Recent research, such as Technical Analysis Meets Machine Learning: Bitcoin Evidence, demonstrates how blending classic indicators like ADX with AI algorithms can improve trade efficiency and filter out noise, especially in fast-moving markets.
Leveraging AI-Powered Trend Detection with PipTrend
Platforms like PipTrend empower traders by combining AI-driven trend detection with the average directional index indicator. PipTrend delivers real-time buy and sell alerts, multi-timeframe analysis, and automatic trend recognition compatible with TradingView.
By syncing PipTrend's AI signals with your ADX readings, you can minimize guesswork and react faster to market shifts. This fusion enhances risk management and consistency. PipTrend also provides a free trial, lifetime updates, and 24/7 support to help traders maintain a modern edge.
Backtesting and Optimizing ADX Strategies for Today’s Markets
To maximize the potential of the average directional index indicator, rigorous backtesting is essential. Start by selecting your asset, defining ADX entry and exit rules, and using platforms like TradingView for historical testing.
Analyze results to optimize parameters, adapt to new market conditions, and refine your approach. Continuous backtesting ensures that your ADX strategies remain relevant and effective in evolving trading environments.
Troubleshooting, FAQs, and Resources for Mastery
Navigating the average directional index indicator can be challenging, especially with changing market dynamics and evolving trading platforms. This section addresses the most common issues, answers frequent questions, offers a comparison to other trend indicators, and provides a curated list of resources and community insights. Mastery requires both technical skill and ongoing learning, so let's break down each area for clarity.
Troubleshooting Common ADX Issues
Traders using the average directional index indicator often encounter flat readings, lagging signals, or conflicting +DI and –DI movements. These issues can make it difficult to trust the indicator in live markets.
Common problems and solutions include:
- Flat ADX Readings: This usually signals a consolidating market. Try increasing the period or confirm with a volatility indicator.
- Lagging Responses: The average directional index indicator is based on smoothed values, so there is always some lag. Reduce the period for more sensitivity, but be cautious of noise.
- Conflicting +DI/–DI Signals: In choppy ranges, +DI and –DI may flip frequently. Use price action or volume as confirmation.
Code example for quick troubleshooting:
if ADX < 20:
 print("Market is range-bound; avoid trend strategies.")
if abs(+DI - -DI) < 5:
 print("No clear direction; wait for confirmation.")
Always consider context and avoid relying solely on the average directional index indicator for critical decisions.
Frequently Asked Questions About ADX
The average directional index indicator raises many questions among new and experienced traders alike. Here are answers to some of the most common queries:
- What is the best ADX setting?
Most platforms use a 14-period setting, but shorter periods increase sensitivity while longer ones reduce noise. - Can it be used across all markets?
Yes, the average directional index indicator is suitable for forex, stocks, crypto, and commodities. - How to avoid false signals?
Combine the average directional index indicator with price patterns, volume, or momentum indicators for confirmation. - Is ADX a lagging indicator?
Yes, due to smoothing, but this helps reduce whipsaws in volatile markets.
For more details, review FAQ sections on trading forums and platform-specific documentation.
Comparing ADX to Other Trend Indicators
The average directional index indicator is often compared to RSI, MACD, moving averages, and Aroon. Each has unique strengths and weaknesses, making the right choice context-dependent.
| Indicator | Measures | Best For | Weakness |
|---|---|---|---|
| ADX | Trend Strength | Filtering trades | Lags in fast markets |
| RSI | Overbought/Oversold | Reversals | Prone to false signals in trends |
| MACD | Trend & Momentum | Crossovers | Late signals |
| Moving Avg | Trend Direction | Simple strategies | Whipsaws in ranges |
| Aroon | Trend Start/End | Early detection | Complex for some traders |
Empirical research, such as the Performance of technical trading rules: evidence from Southeast Asian stock markets, demonstrates that the average directional index indicator can outperform moving averages in certain trending conditions, especially when used with other tools.
Top Resources for Further Learning
Expanding your knowledge of the average directional index indicator is essential for ongoing success. Here are top recommendations:
- Books: "New Concepts in Technical Trading Systems" by J. Welles Wilder
- Courses: Online platforms like Coursera and Udemy offer technical analysis modules.
- Webinars: Follow TradingView and MetaTrader for live sessions.
- Articles: Inzinerine Ekonomika-Engineering Economics, 2020, 31(2), 188–196 provides a deep dive into ADX calculation, interpretation, and its role in various market conditions.
- Forums: Participate in discussions on StockCharts, TradingView, and Investopedia.
Bookmark these resources to stay ahead in your use of the average directional index indicator.
Community Insights and User Experiences
Real-world feedback is invaluable when mastering the average directional index indicator. Traders often share that ADX helps filter out sideways markets, reducing frustration from false breakouts.
Notable tips include:
- Wait for ADX to rise above 25 before acting on trend signals.
- Use community scripts for multi-timeframe analysis.
- Share and review sample strategies in trading forums.
Crowdsourced strategies and open-source code can accelerate your learning curve with the average directional index indicator.
Keeping Your ADX Skills Up-to-Date in 2026
To remain effective with the average directional index indicator, continuous adaptation is key. Stay informed by:
- Regularly updating trading platforms and scripts.
- Joining trader communities for script sharing and new ideas.
- Testing new indicator combinations and automation tools.
Market conditions evolve, so your approach to the average directional index indicator should too. Embrace ongoing education and experimentation to maintain your edge.
You’ve just taken a deep dive into mastering the ADX indicator, learning how to measure trend strength and apply it across different markets and strategies. If you’re ready to put these insights into action and want a tool that eliminates guesswork, PipTrend’s AI-powered signals can help you make confident, timely decisions. With features like real-time alerts, multi-timeframe analysis, and simple, clear trade signals, you can focus on catching strong trends instead of second guessing. Why not see the difference for yourself?
See Your Trading Improve With PipTrend