
Trading in 2025 is moving faster than ever—AI tools, automation, and unpredictable volatility are rewriting the rules. To thrive, traders need more than instinct; they need the right trader indicators to navigate these shifting tides.
This guide unveils the 7 best trader indicators for 2025. You’ll discover up-to-date tools with their core features, pricing, and unique benefits tailored to every trading style.
As markets grow more complex, actionable insights become essential. Ready to level up your trading? Dive in and upgrade your toolkit with the indicators that top traders trust.
Why Trader Indicators Matter in 2025
The landscape of trading is transforming at lightning speed as we move into 2025. Keeping up means having the right trader indicators in your arsenal—tools that help you interpret trends, navigate volatility, and stay ahead of the curve. But why are these tools more essential than ever, and how can you choose the best ones for your unique strategy?
The Evolving Trading Environment
Financial markets in 2025 are more complex and volatile than ever, driven by rapid advancements in automation and AI. Algorithmic trading now accounts for over 70% of global volume, and retail traders are increasingly leveraging sophisticated trader indicators to compete with institutions.
Data from 2023–2024 shows a sharp rise in the use of AI-powered and real-time analysis tools. Traders are seeking smarter, faster ways to interpret market data, highlighting the need for up-to-date trader indicators. As volatility increases and new asset classes emerge, these tools have become the backbone of both professional and retail trading strategies.
Types of Trader Indicators: Overlays vs. Oscillators
Trader indicators generally fall into two main categories: overlays and oscillators. Overlays, like moving averages and Bollinger Bands, sit directly on price charts, revealing trends and dynamic support/resistance levels. Oscillators, such as RSI and MACD, appear below charts, measuring momentum or identifying overbought/oversold conditions.
Combining overlays and oscillators can greatly improve accuracy. For example, using a moving average (overlay) with RSI (oscillator) allows traders to validate trend signals and avoid false entries—a practice widely adopted by top-performing competitors. This blend of trader indicators helps traders adapt to different market scenarios with greater confidence.
The Role of Customization and Automation
Customization and automation are now at the heart of modern trader indicators. Many tools let users tailor alert thresholds, timeframes, and display settings to fit their unique strategies. Automation, powered by AI and machine learning, reduces emotional trading and increases consistency.
AI-driven trader indicators can scan multiple markets and timeframes in real time, offering actionable insights that were once out of reach for individual traders. For a deeper dive into how AI is revolutionizing trading strategies, check out AI in Trading Strategies. The result? Traders can respond faster and with more precision, even as markets grow more unpredictable.
Common Mistakes Traders Make with Indicators
Despite the power of trader indicators, common mistakes persist. Some traders rely too heavily on a single indicator, missing the bigger picture. Others ignore the importance of aligning indicators with the right market context or timeframe, leading to inconsistent results.
Failing to update your toolkit as market conditions evolve is another pitfall. Successful traders regularly review and adapt their trader indicators, ensuring they remain effective as new technologies and market dynamics emerge. Avoiding these mistakes can make the difference between mediocre and outstanding trading performance.
How to Choose the Right Indicators for Your Strategy
Selecting the best trader indicators starts with understanding your asset class, trading style, and experience level. Day traders might prioritize fast-reacting tools, while swing traders could prefer indicators that capture broader trends.
Backtesting and demo trading are essential steps. Testing combinations—like pairing MACD with volume profile for trend confirmation—can reveal what works best for your approach. Remember, the right mix of trader indicators is often unique to each trader, and refining your selection over time leads to consistent, long-term success.
7 Best Trader Indicators for 2025: Essential Tools for Success
Navigating the fast-paced world of trading in 2025 demands a toolkit loaded with the most advanced trader indicators. The right combination can transform guesswork into strategy, giving you clarity and confidence even when markets seem unpredictable.
Below, you’ll find a detailed review of the seven best trader indicators for 2025. Each tool brings something unique to the table—whether you’re a beginner, a seasoned day trader, or somewhere in between. Compare features, pricing, and benefits to discover which indicators align best with your trading style and goals.
PipTrend AI Trading Indicator
If you’re seeking a competitive edge, PipTrend AI Trading Indicator stands at the forefront of trader indicators in 2025. With pricing options of $59.99/month, $134.99/quarter, or $479.99/year (all with lifetime updates), it’s a solid investment for serious traders.
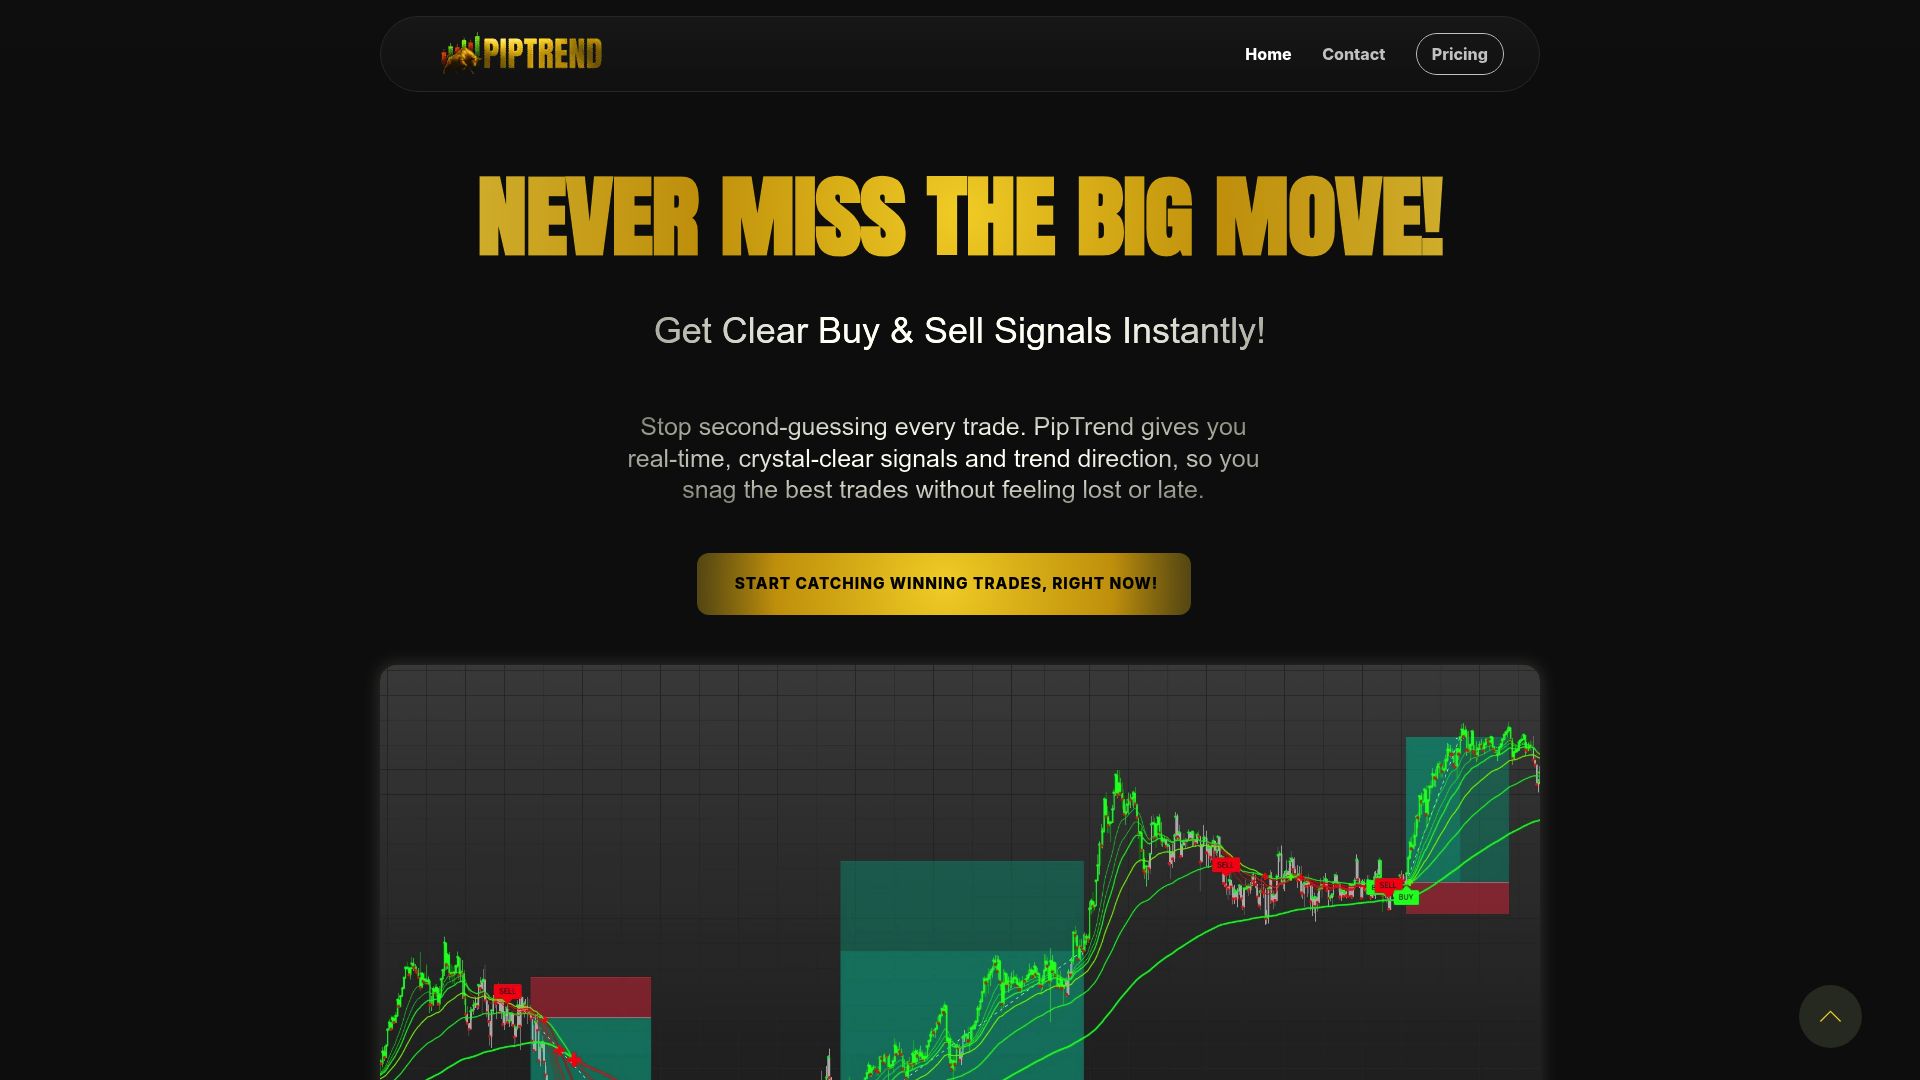
What sets PipTrend apart is its AI-powered real-time buy/sell signals and multi-timeframe dashboard. The tool instantly detects trends, delivers customizable alerts, and provides session liquidity insights. Integration with TradingView means you can use it across forex, crypto, stocks, and indices—making it versatile for different asset classes.
Key Benefits:
- Removes the guesswork from trade entries and exits.
- Supports both beginners and intermediate traders with a user-friendly interface.
- Offers multi-timeframe confirmation, ensuring you always have a big-picture view.
Pros:
- AI-driven clarity and instant signal alerts.
- Universal market support.
- Proven performance: 97% of users report more winning trades.
Cons:
- No refunds (due to digital nature).
- Requires an active TradingView account.
Why It’s Unique:
PipTrend’s lifetime updates and beginner-friendly onboarding make it a top pick among trader indicators for those seeking consistency and confidence. Its real-time session liquidity insights are especially valuable in volatile markets.
If you want to understand how these signals work, check out this Trading Signals Explained resource for a foundational overview.
Footprint Orderflow Indicator (NinjaTrader 8)
The Footprint Orderflow Indicator for NinjaTrader 8 is a powerhouse for traders who rely on granular market data. Priced at $459 (one-time), it brings professional-level order flow analysis to your desktop.
This indicator visualizes bid/ask volume in real time, using delta candles and advanced footprint charts to expose the true intent behind each price move. If you’re looking to spot institutional activity or fine-tune your entries and exits, it’s a must-have.
Key Benefits:
- Reveals hidden market activity, helping you anticipate moves before they happen.
- Ideal for scalping and short-term trading strategies.
- Highly customizable display to suit your workflow.
Pros:
- Supports multiple chart types.
- Delivers deep market insight for advanced users.
Cons:
- Steep learning curve for beginners.
- Requires NinjaTrader 8 platform.
Unique Selling Points:
Its ability to provide granular order flow data makes it stand out among trader indicators for futures and day traders aiming for precision.
Relative Strength Index (RSI)
The Relative Strength Index (RSI) remains a staple in every trader’s toolkit. Free and built into all major charting platforms, it measures the speed and change of price movements on a scale of 0 to 100.
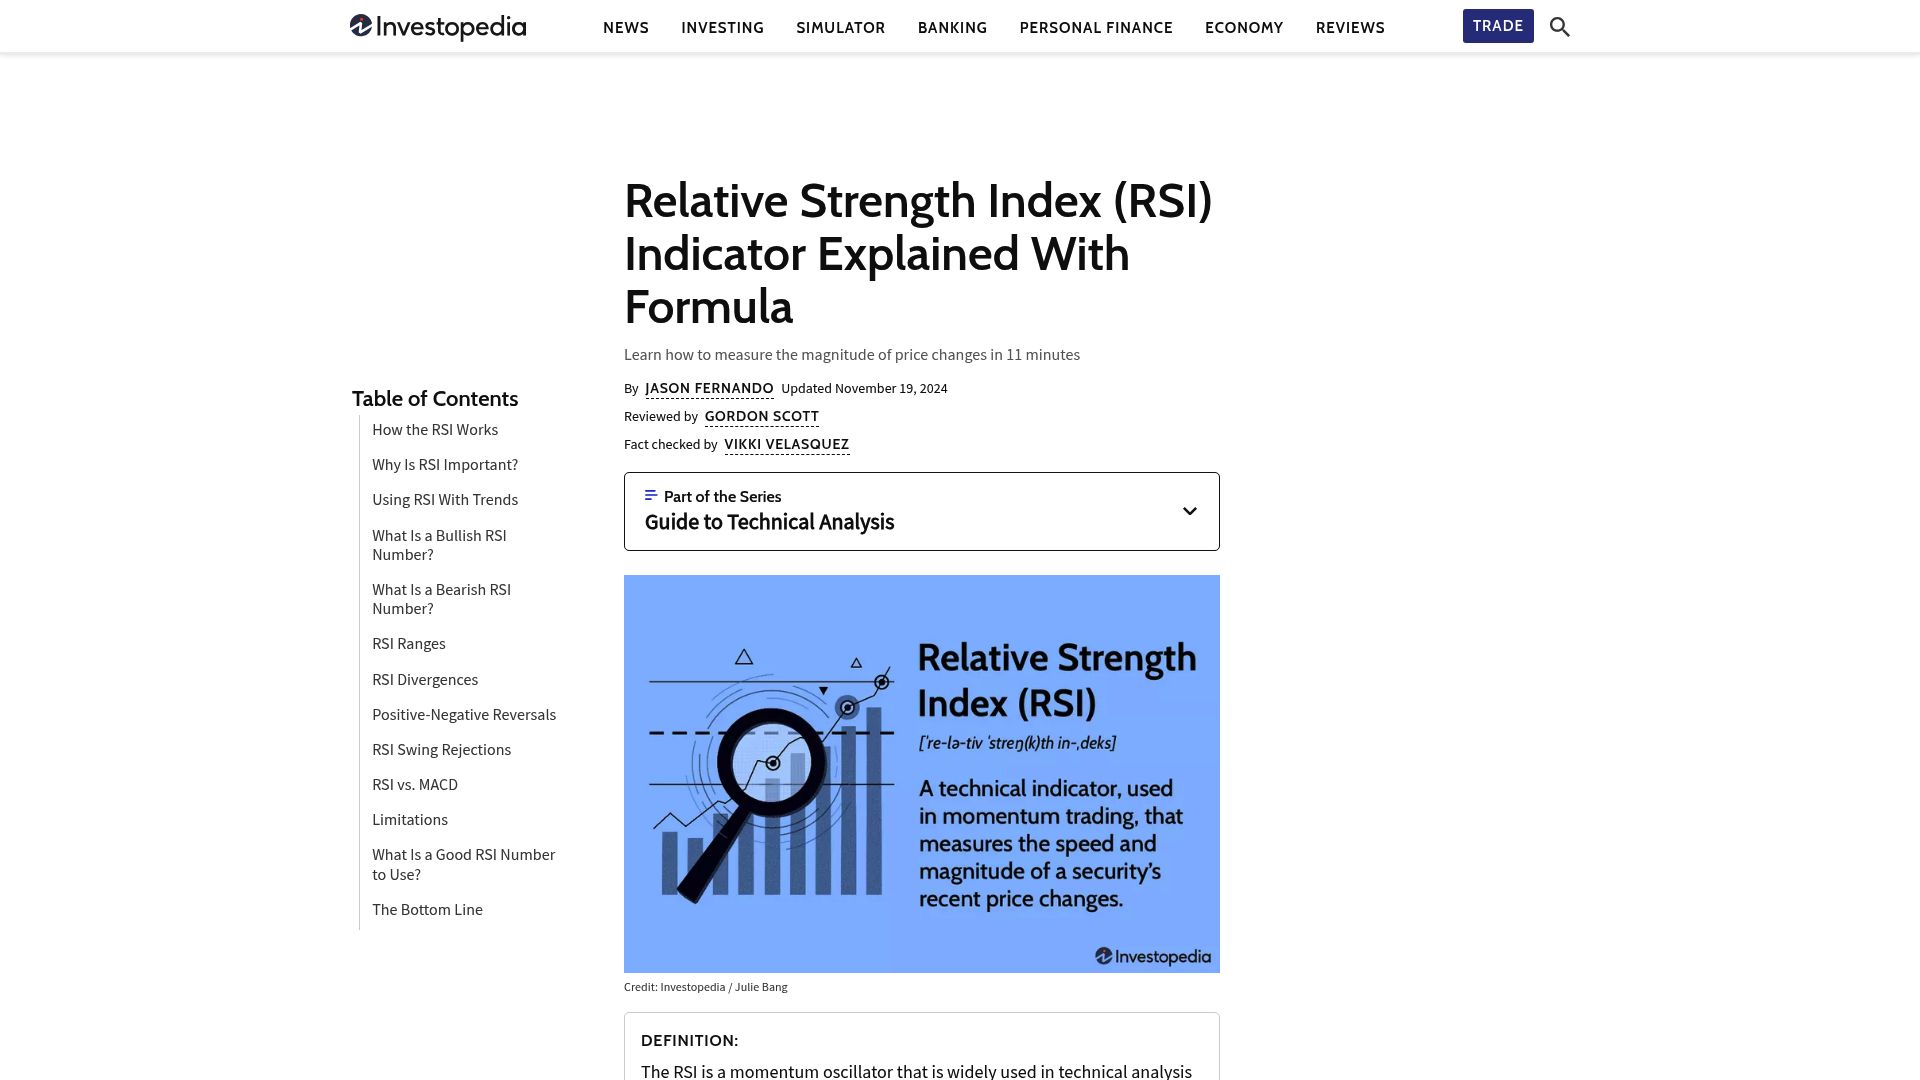
RSI is invaluable for identifying overbought and oversold conditions, signaling potential trend reversals. For swing and momentum traders, it provides clear, easy-to-interpret signals that work across asset classes.
Key Benefits:
- Instantly highlights market extremes.
- Simple to apply and understand, requiring little setup.
Pros:
- Universally trusted and widely adopted.
- Works well in combination with other trader indicators.
Cons:
- May generate false signals in highly volatile conditions.
- Best used alongside other tools for confirmation.
Unique Selling Points:
RSI’s universal adoption and foundational role in technical analysis cement its place among the best trader indicators for 2025.
Market Profile and Volume Profile (NinjaTrader)
Market Profile and Volume Profile for NinjaTrader ($339 one-time) offer deep insights into price distribution and volume at each level. These trader indicators help you see where the market is most active and identify key support and resistance zones.
The ability to visualize market structure is a game-changer for intraday and swing traders. By pinpointing high-probability trade areas, you can plan entries and exits with greater confidence.
Key Benefits:
- Reveals the “shape” of the market.
- Supports multi-timeframe analysis for a comprehensive view.
Pros:
- Enhances trade planning and risk management.
- Works across futures, forex, and stocks.
Cons:
- Requires learning curve for beginners.
- Needs charting software integration.
Unique Selling Points:
Combining both market and volume profiles, these trader indicators provide a layered perspective unavailable in simpler tools.
Moving Average Convergence Divergence (MACD)
The Moving Average Convergence Divergence (MACD) is a cornerstone among trader indicators, and it’s free on most platforms. By comparing two EMAs, it reveals trend direction, momentum, and potential reversals.
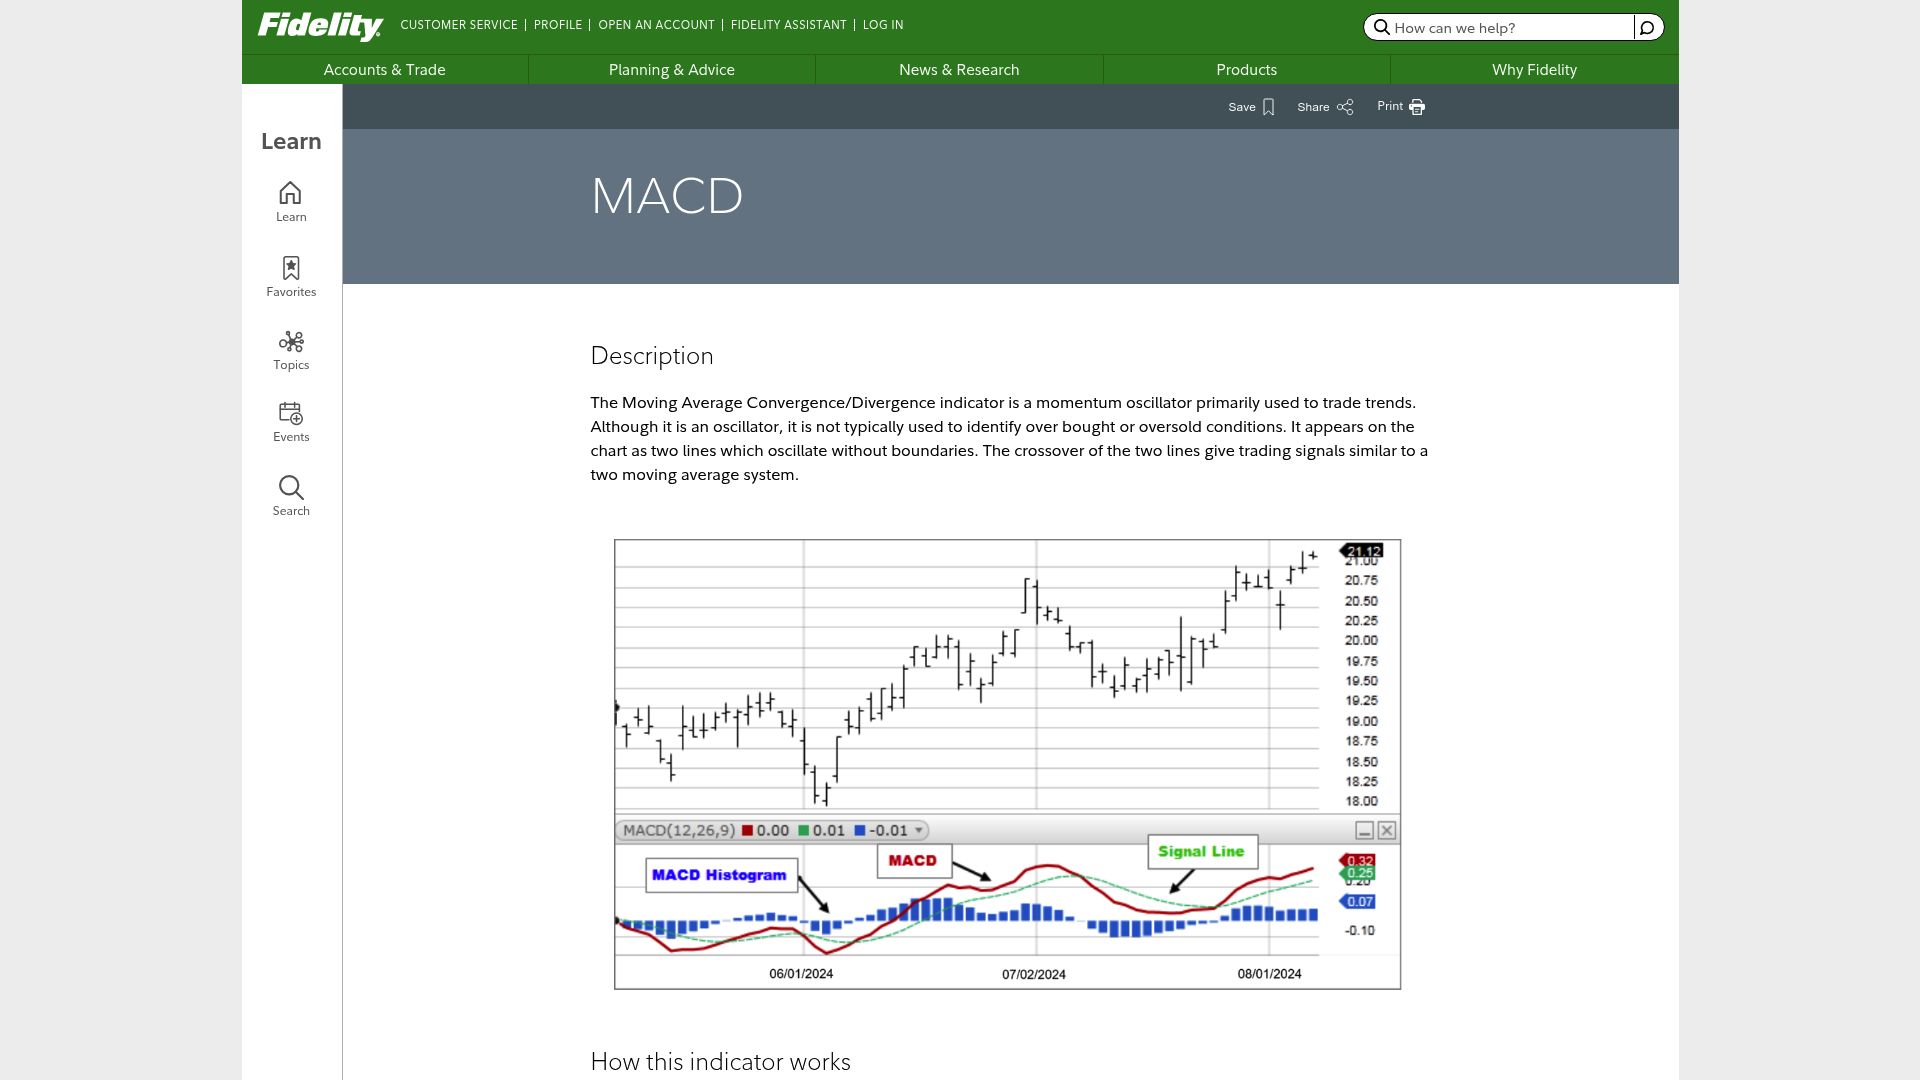
MACD features a main line, a signal line, and a histogram, making it easy to spot crossovers and shifts in momentum.
Key Benefits:
- Combines trend and momentum analysis for robust signals.
- Works across all asset classes and timeframes.
Pros:
- Visual crossover signals are easy to interpret.
- Highly versatile for different trading strategies.
Cons:
- As a lagging indicator, it may miss early moves.
- Can produce delayed signals in fast markets.
Unique Selling Points:
MACD’s ability to merge momentum with trend-following makes it a reliable choice among trader indicators for both new and seasoned traders.
Auto Trendline Breakout and Bounce Detector (NinjaTrader)
The Auto Trendline Breakout and Bounce Detector automates one of the most time-consuming charting tasks: drawing and managing trendlines. For $399 (one-time), it identifies breakouts and bounces in real time.
This indicator is a boon for technical analysts and breakout traders who want to streamline their workflow and eliminate subjectivity.
Key Benefits:
- Real-time detection of trendline events.
- Customizable parameters to match your trading style.
Pros:
- Saves time and increases efficiency.
- Fully automated for active traders.
Cons:
- Requires NinjaTrader platform.
- Not suitable for every asset class.
Unique Selling Points:
Among trader indicators, its real-time trendline management stands out for those who value automation and quick response.
On-Balance Volume (OBV)
On-Balance Volume (OBV) is a free, volume-based oscillator that tracks cumulative volume flow. It’s a vital companion for traders wanting to confirm price trends and spot early divergences.
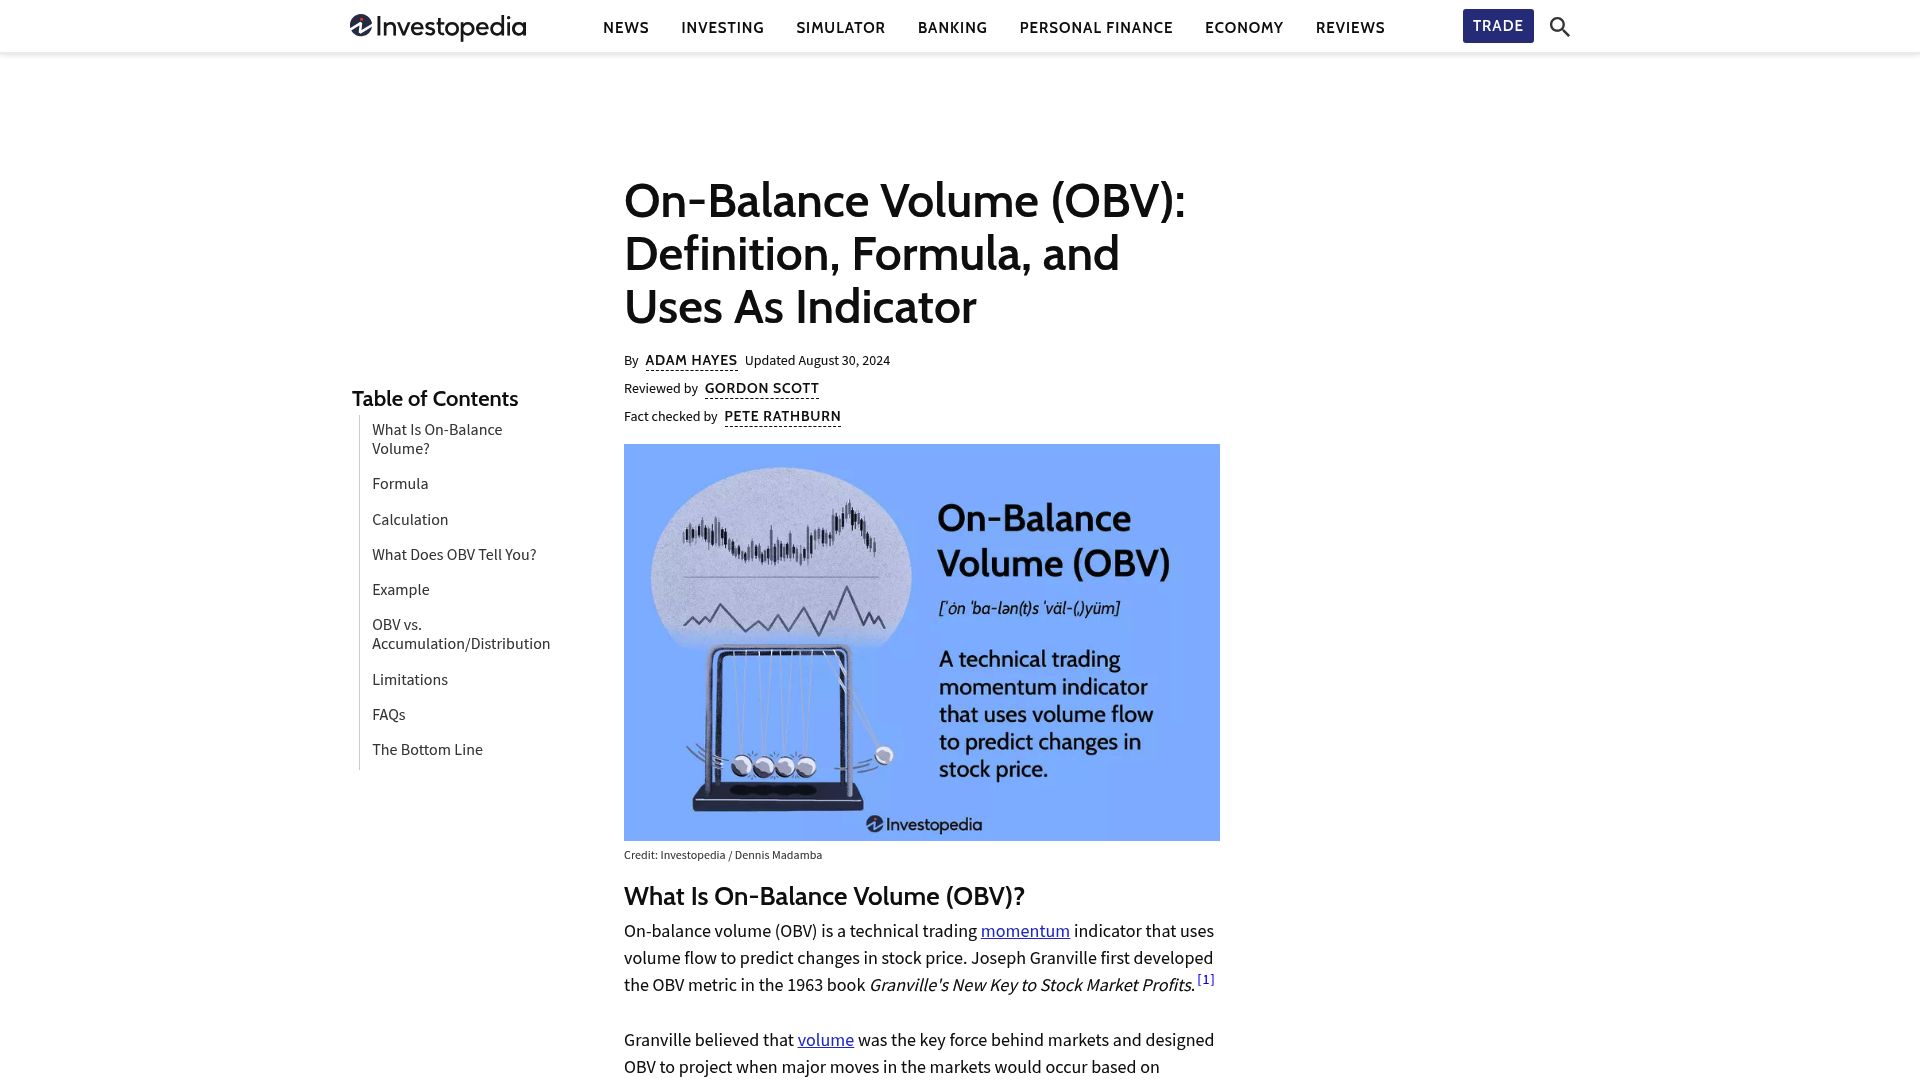
OBV integrates seamlessly with other trader indicators, making it especially useful for stock, forex, and crypto traders focused on volume analysis.
Key Benefits:
- Confirms the strength of price moves.
- Detects divergence for early signals of trend shifts.
Pros:
- Simple calculation and easy to use.
- Effective for confirming trade setups.
Cons:
- Less effective in markets with low volume.
- Not a standalone signal—best used in combination.
Unique Selling Points:
OBV’s integration of price and volume data offers a holistic approach, making it a top pick among trader indicators for those who want a fuller market picture.
Comparison Table: Top Trader Indicators for 2025
| Indicator | Pricing | Core Features | Best For | Unique Benefit |
|---|---|---|---|---|
| PipTrend AI | $59.99/mo+ | AI signals, multi-timeframe, liquidity insights | All traders | 97% report more wins |
| Footprint Orderflow | $459 | Order flow, delta candles | Futures/day traders | Institutional activity detection |
| RSI | Free | Overbought/oversold, reversals | Swing/momentum traders | Universal, easy to use |
| Market/Volume Profile | $339 | Price/volume distribution | Intraday/swing traders | Deep market structure insight |
| MACD | Free | Trend/momentum, crossovers | All traders | Momentum + trend in one |
| Auto Trendline | $399 | Auto trendlines, breakouts | Breakout/technical traders | Real-time, automated |
| OBV | Free | Cumulative volume | Volume-focused traders | Price-volume integration |
Selecting the right trader indicators is crucial to navigating the complex markets of 2025. Whether you’re focused on AI-powered automation, granular order flow, or classic momentum tools, these seven indicators provide a robust foundation for building your edge.
How to Integrate Multiple Indicators for Maximum Results
Navigating today’s markets requires more than just intuition—it means building a toolkit of trader indicators that work together seamlessly. By integrating multiple trader indicators, you can filter out market noise, confirm signals, and make more confident decisions. Let’s break down how to combine, test, and adapt trader indicators for maximum results.
Combining Indicator Types for Confirmation
The secret to reliable trading isn’t about stacking as many trader indicators as possible—it’s about choosing the right mix. Overlays like moving averages or Bollinger Bands show price direction and volatility, while oscillators such as RSI and MACD highlight momentum and reversal points.
Pairing overlays with oscillators can provide robust confirmation. For example, if a moving average signals an uptrend and RSI isn’t overbought, that’s a stronger buy signal. Similarly, combining order flow analysis with volume profile helps validate whether a price move is supported by real market activity.
For an advanced edge, traders are increasingly turning to multi-timeframe analysis techniques, allowing them to confirm signals across different chart intervals using multiple trader indicators. This approach reduces false signals and supports more strategic entries and exits.
Avoiding Signal Overload and Conflicting Information
It’s easy to fall into the trap of using too many trader indicators, leading to “analysis paralysis.” Too much information can cause hesitation, missed trades, or even conflicting signals that muddy your decision-making.
To avoid this, stick to 2–3 core trader indicators that complement each other. For example, a trend indicator, a momentum oscillator, and a volume-based tool often cover all bases without overwhelming your charts. Regularly review your toolkit and remove redundant or less effective indicators to keep your strategy sharp and focused.
Backtesting and Demo Trading for Strategy Validation
Before risking real capital, it’s essential to put your trader indicators to the test. Backtesting lets you see how your chosen combination would have performed in past markets. Start by selecting historical data, define your entry and exit rules, and track metrics like win rate and drawdown.
Demo trading is the next step—apply your trader indicators in live market conditions without financial risk. This builds confidence and helps you spot any issues before going live. If you’re new to this process, resources like a Beginner’s Guide to Trading can walk you through the basics of testing and refining your setup.
Adapting to Different Market Conditions
Markets never stay the same. Trending environments favor trader indicators like moving averages or MACD, while ranging markets respond better to oscillators such as RSI. High volatility may call for more dynamic tools, like order flow or automated trendline detectors.
Stay flexible by regularly reviewing which trader indicators are delivering value. Use multi-timeframe analysis to adjust strategies as volatility or liquidity changes. The ability to adapt is what separates consistent traders from the rest.
Common Pitfalls and How to Avoid Them
Be wary of overfitting strategies to past data, ignoring major news, or relying solely on automated signals. Even the best trader indicators can’t replace critical thinking—always keep market context in mind.
By combining, testing, and adapting your trader indicators, you’ll be well-positioned to meet whatever the markets throw your way.
Choosing the Right Trading Platform and Tools
Selecting the best platform for trader indicators in 2025 is more critical than ever. A well-chosen platform empowers traders to access advanced features, integrate powerful tools, and adapt to rapidly shifting markets. Let’s break down what matters most when upgrading your trading setup.
Platform Compatibility and Indicator Access
Not all platforms handle trader indicators equally. Industry leaders like TradingView, NinjaTrader, and MetaTrader offer broad support for both native and third-party tools. For multi-asset traders, cross-platform compatibility is essential—ensuring seamless use of favorite indicators whether trading forex, stocks, or crypto.
Many modern platforms now emphasize easy integration of external tools. For example, adding PipTrend to TradingView or specialized order flow indicators to NinjaTrader is straightforward. If you want a broader perspective, check out this comparative analysis of top AI trading platforms in 2025, which highlights key differences in indicator support, pricing, and user experience.
Pricing Models: Subscription vs. One-Time Purchase
Trader indicators come in various pricing models, each with pros and cons. Subscriptions (e.g., PipTrend AI) offer ongoing updates and support, while one-time purchases (like many NinjaTrader add-ons) can be more cost-effective in the long run. Some platforms include popular indicators for free, but advanced tools often come at a premium.
| Model | Example | Cost Range | Updates |
|---|---|---|---|
| Subscription | PipTrend AI | $59.99/month+ | Included |
| One-Time | NinjaTrader Add-ons | $339–$459 | Lifetime |
| Freemium | RSI, MACD, OBV | Free (basic) | Limited |
When choosing trader indicators, compare total costs, value of lifetime updates, and the level of customer support included.
User Experience: Customization and Alerts
A seamless user experience makes all the difference for trader indicators. Customizable dashboards let you tailor your workspace to your trading style. Alerts—whether on mobile or desktop—keep you informed of critical market moves in real time.
Platforms like TradingView provide flexible layouts and easy onboarding, while NinjaTrader excels in automation. Look for platforms offering intuitive setup, responsive alerts, and the ability to personalize indicator parameters. These features boost efficiency and help you stay on top of fast-moving markets.
Security, Reliability, and Support
Security and reliability are non-negotiable when using trader indicators. Secure platforms ensure your data and strategies remain protected, while reliable signal delivery prevents missed opportunities. Robust customer support—via live chat, forums, or detailed documentation—can be invaluable, especially when troubleshooting advanced indicators.
Many platforms foster active communities, providing another layer of support and sharing. Before committing, check for regular updates, transparent data policies, and responsive help channels to safeguard your trading journey.
Upgrading Your Toolkit for 2025
Staying ahead in 2025 means regularly reviewing your suite of trader indicators. The landscape is evolving, with AI, automation, and multi-timeframe analysis becoming industry standards. Consider exploring the latest AI-driven market indicators to keep your toolkit cutting-edge.
Set a regular schedule—perhaps quarterly—to assess your indicators, test new tools, and adapt as market conditions change. Staying proactive ensures you’re always equipped to thrive in dynamic markets.
Now that you’ve seen how the right indicators can transform your trading strategy in 2025, it’s the perfect time to put this knowledge into action. If you’re looking for clarity, confidence, and consistent results—especially as markets become more complex—using an AI-powered tool like PipTrend could be your best next step. With real-time buy and sell signals, instant alerts, and support for all major markets, you can say goodbye to guesswork and start trading with purpose. Ready to see the difference for yourself?
Start Catching Winning Trades, Right Now!