
In a market landscape where trends shift rapidly, staying ahead requires more than just intuition. Traders in 2026 face complex and volatile conditions, making technical analysis tools indispensable for navigating uncertainty.
The average directional indicator stands out as a critical resource for identifying trend strength and direction. Mastering this tool can empower you to make smarter trading decisions, manage risk effectively, and boost profitability.
This guide is designed to provide a clear, step-by-step understanding of the average directional indicator. Explore its history, calculation, interpretation, strategies, integration with other tools, and the latest innovations shaping trading in 2026.
Understanding the Average Directional Indicator: Origins and Core Concepts
In the fast-evolving world of trading, the average directional indicator stands out as a critical tool for identifying and measuring market trends. Understanding its origins and structure is essential for traders seeking an edge amid relentless market shifts.
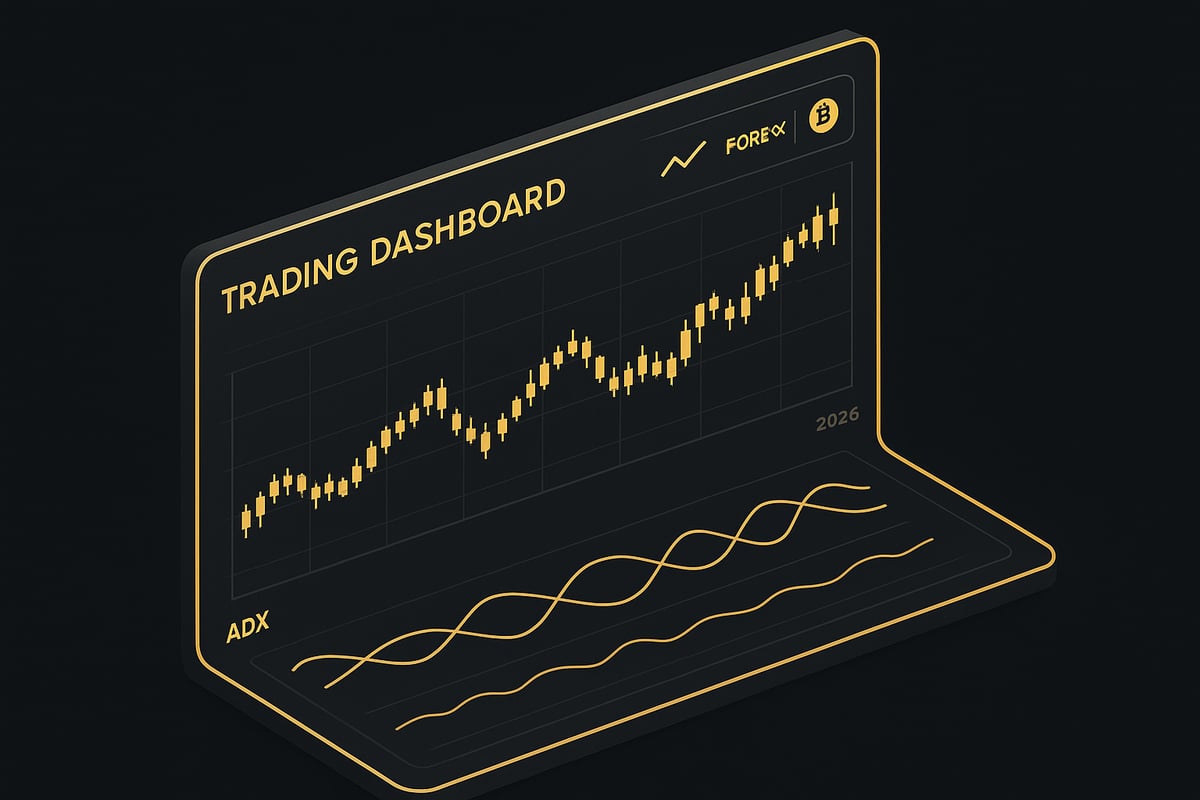
The Evolution of Directional Movement Indicators
The average directional indicator was first introduced by J. Welles Wilder Jr. in 1978, marking a turning point in technical analysis. Wilder designed the indicator specifically to address a challenge faced by traders: how to measure not just the direction but also the strength of a price trend. Before this innovation, most tools focused on direction alone, often leaving traders vulnerable to false signals in weak or consolidating markets.
This indicator comprises three main components:
- ADX: Measures the absolute strength of a trend, regardless of direction.
- +DI: Captures positive price movement, signaling bullish momentum.
- -DI: Tracks negative price movement, indicating bearish momentum.
Unlike oscillators that simply follow price direction, the average directional indicator quantifies how strong a trend is, offering traders a more nuanced perspective. Initially developed for commodities, its reliability has led to widespread adoption across stocks, forex, crypto, and indices.
For example, in a trending market, a rising ADX value highlights growing momentum, while in range-bound conditions, a falling ADX warns traders to stay cautious. According to 2023 StockCharts data, the average directional indicator remains one of the top 10 most-used technical indicators worldwide.
To explore the ADX component further, traders can refer to Understanding the ADX Indicator for a more detailed explanation of how this vital metric works within the average directional indicator framework.
Key Terminology and Indicator Structure
A solid grasp of the average directional indicator begins with understanding its key terms and how each part interacts on a chart.
- ADX (Average Directional Index): This line measures trend strength on a scale from 0 to 100. Higher values indicate stronger trends, while lower values suggest weak or non-existent trends.
- +DI (Positive Directional Indicator): When this line is above -DI, it signals that upward price movement dominates.
- -DI (Negative Directional Indicator): When this line is above +DI, downward momentum takes the lead.
On a typical chart, traders see three colored lines—ADX (often black or gold), +DI (green), and -DI (red)—moving above and below each other. The interplay between +DI and -DI provides early trend signals, while the ADX line confirms whether the trend is robust enough to act on.
Consider an example: if +DI crosses above -DI and the ADX is rising above 25, it suggests a strong bullish trend. Conversely, a declining ADX, even with a crossover, warns of potential range trading or false signals.
A common misconception is that the ADX reveals trend direction, but in reality, it only measures strength. Traders often misinterpret flat or low ADX values as trend reversals, when in fact, these readings may simply reflect market consolidation.
For clarity, here’s a summary table of the components:
| Component | Measures | Typical Signal |
|---|---|---|
| ADX | Trend strength | Above 25 = strong trend |
| +DI | Upward moves | Above -DI = bullish |
| -DI | Downward moves | Above +DI = bearish |
Understanding these basics equips traders to read and apply the average directional indicator with greater confidence and accuracy.
Step-by-Step Calculation of the Average Directional Indicator
Calculating the average directional indicator is foundational for traders aiming to interpret trend strength with precision. A clear understanding of each step ensures accurate readings, which directly impact trade timing and risk management.
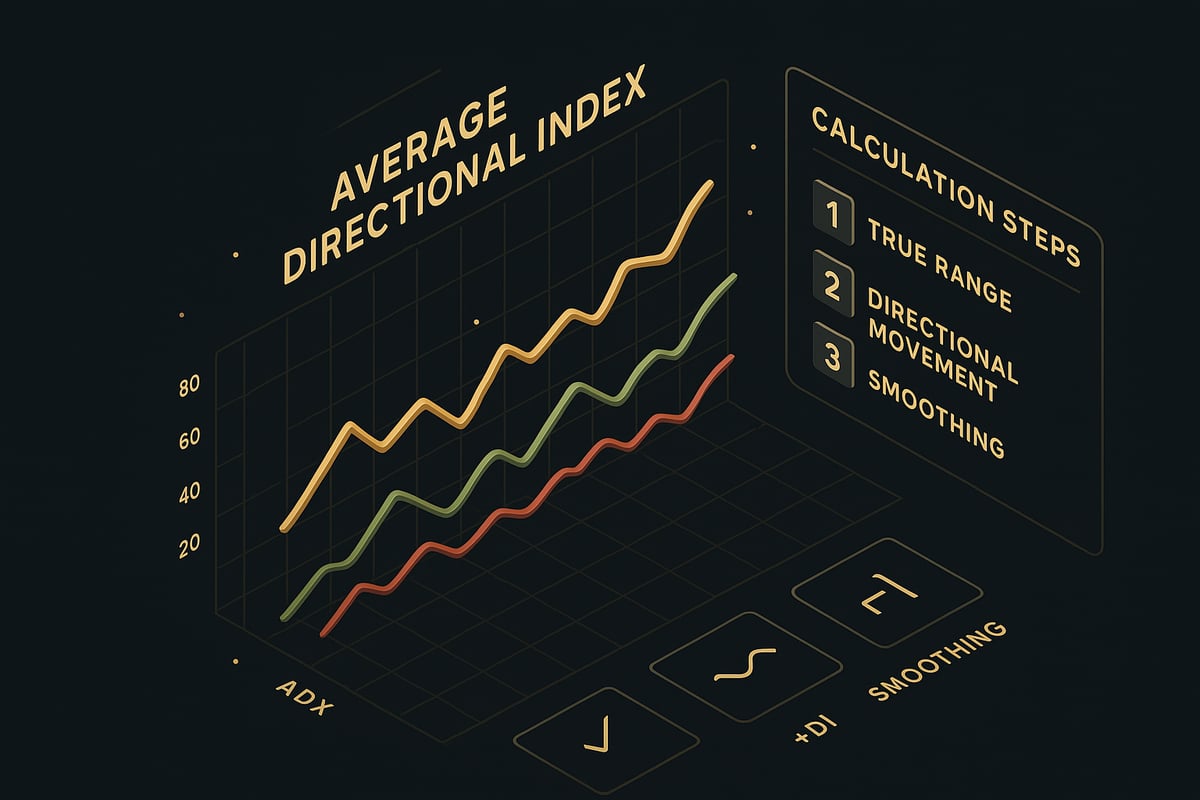
Chronological Calculation Process
The average directional indicator calculation follows a logical progression, each step building on the last. Here is a simplified overview:
| Step | Calculation Detail | Purpose |
|---|---|---|
| 1 | True Range (TR) | Measure volatility for each period |
| 2 | +DM and -DM | Identify positive/negative movement |
| 3 | Smooth TR, +DM, -DM | Reduce noise using Wilder’s method |
| 4 | Calculate +DI and -DI | Express directional movement as a ratio |
| 5 | Compute ADX | Smooth Directional Index for trend strength |
Step 1: Calculate True Range (TR)
For each period, TR is the greatest of:
- Current High minus Current Low
- Absolute value of Current High minus Previous Close
- Absolute value of Current Low minus Previous Close
Step 2: Determine +DM and -DM
- +DM = Current High minus Previous High (if greater than Current Low minus Previous Low, else 0)
- -DM = Previous Low minus Current Low (if greater than Current High minus Previous High, else 0)
Step 3: Wilder’s Smoothing
Apply smoothing to TR, +DM, and -DM using the formula:Smoothed Value = (Prior Smoothed Value x (n-1) + Current Value) / n
Step 4: Calculate +DI and -DI
- +DI = (Smoothed +DM / Smoothed TR) x 100
- -DI = (Smoothed -DM / Smoothed TR) x 100
Step 5: Compute ADX
- DX = (|+DI – -DI| / |+DI + -DI|) x 100
- ADX is the smoothed average of DX values
Here is a quick code-style illustration:
# Calculate True Range (TR)
TR = max(High - Low, abs(High - PrevClose), abs(Low - PrevClose))

# Calculate +DM and -DM
plusDM = High - PrevHigh if (High - PrevHigh) > (PrevLow - Low) else 0
minusDM = PrevLow - Low if (PrevLow - Low) > (High - PrevHigh) else 0

# Smooth values (Wilder's method)
SmoothedTR = (PrevSmoothedTR * (n-1) + TR) / n
SmoothedPlusDM = (PrevSmoothedPlusDM * (n-1) + plusDM) / n
SmoothedMinusDM = (PrevSmoothedMinusDM * (n-1) + minusDM) / n

# Calculate +DI and -DI
plusDI = (SmoothedPlusDM / SmoothedTR) * 100
minusDI = (SmoothedMinusDM / SmoothedTR) * 100

# Calculate DX and ADX
DX = abs(plusDI - minusDI) / abs(plusDI + minusDI) * 100
ADX = Smoothed DX values
For most traders, a default period of 14 is used. Shorter periods make the average directional indicator more sensitive to recent price movements, while longer periods smooth out short-term fluctuations. Accurate calculation is essential, as minor errors can lead to misleading trend signals.
For a comprehensive breakdown of these steps and further insights into the average directional indicator calculation, you can reference this Average Directional Index (ADX): Components and Calculation resource.
Wilder’s Smoothing Techniques in Detail
Wilder’s smoothing method is central to the reliability of the average directional indicator. By gradually integrating new values, this approach minimizes the impact of erratic price swings that can distort indicator readings.
The main rationale is to filter out market noise. Unlike simple moving averages (SMA), which treat all periods equally, Wilder’s smoothing gives more weight to historical data. This results in a steadier line that adapts smoothly to changing market conditions.
Comparing Wilder’s smoothing to exponential moving averages (EMA), the latter reacts more quickly to new data, which can be both an advantage and a drawback. For the average directional indicator, Wilder’s approach provides a balance between responsiveness and stability, making it well-suited for identifying sustained trends.
Consider a real-world scenario:
In a volatile market, sudden price spikes can cause false signals. Wilder’s smoothing ensures the average directional indicator does not react to every fluctuation, instead focusing on persistent shifts in trend strength. This helps traders avoid overreacting to short-lived market noise.
Mastering the smoothing process is crucial for anyone using the average directional indicator. It directly impacts signal reliability and, ultimately, trading outcomes.
Interpreting the Average Directional Indicator: Signals, Strength, and Limitations
Understanding how to interpret the average directional indicator is crucial for any trader aiming to distinguish real trends from market noise. Proper interpretation can help you identify high-probability trades, avoid false signals, and manage risk more effectively. Let us break down what the ADX, +DI, and -DI lines reveal, and highlight common pitfalls to watch for.
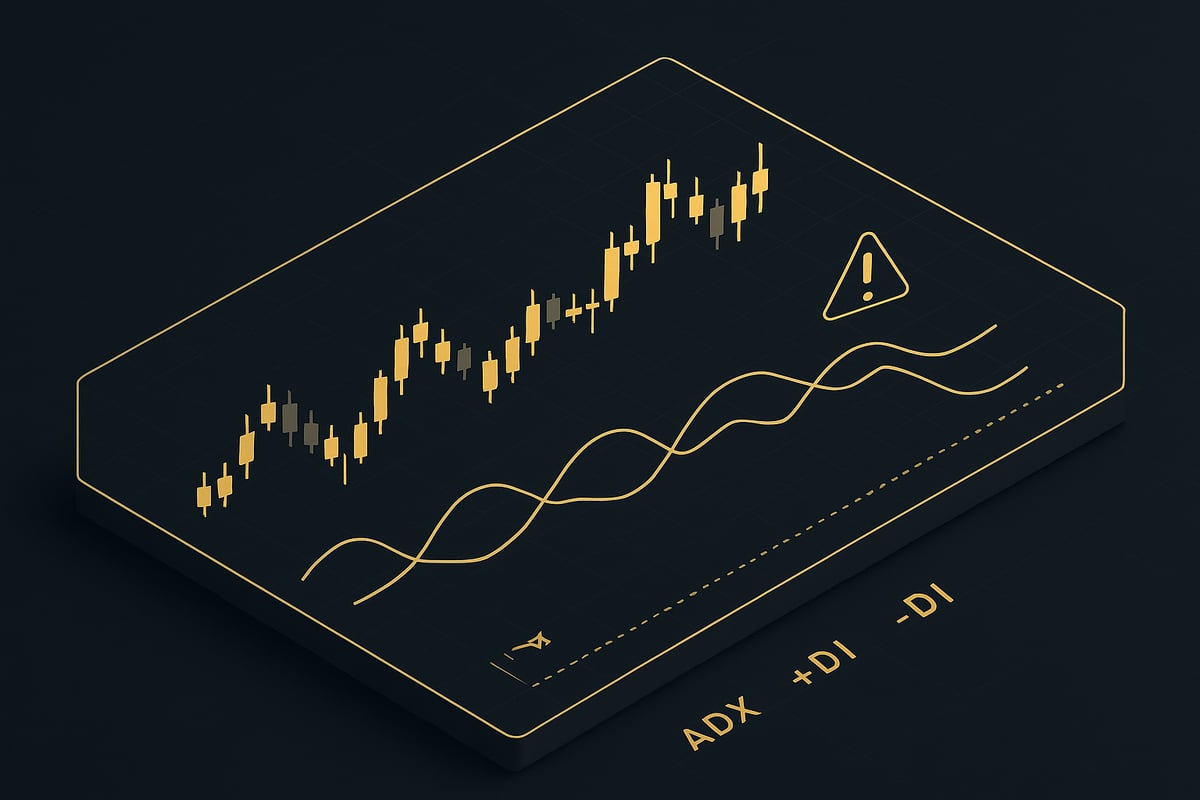
How to Read ADX, +DI, and -DI Values
The average directional indicator consists of three distinct lines: the ADX itself, the +DI (positive directional indicator), and the -DI (negative directional indicator). Each line serves a unique function in evaluating trend conditions.
The ADX line quantifies trend strength on a scale from 0 to 100. Values below 20 indicate a weak or non-existent trend, while readings above 25 suggest a strengthening trend. When the ADX rises, it signals increasing momentum, regardless of direction. A falling ADX implies a weakening trend or transition to a range-bound market.
The +DI and -DI lines reflect bullish and bearish momentum, respectively. When the +DI crosses above the -DI, it suggests buyers are gaining control, indicating a possible bullish trend. Conversely, a -DI crossing above +DI points to sellers taking the lead, a sign of bearish sentiment.
Here is a quick reference table to summarize these signals:
| ADX Value | Trend Strength | Typical Interpretation |
|---|---|---|
| 0-20 | Weak/No Trend | Avoid trend trades |
| 20-25 | Emerging Trend | Watch for confirmation |
| 25-40 | Strong Trend | Active trend, trade signals |
| 40+ | Very Strong Trend | Possible trend exhaustion |
Crossovers between +DI and -DI act as entry or exit signals, especially when confirmed by an ADX reading above 25. For instance, if +DI crosses above -DI and ADX is rising above 25, this combination often precedes a durable bullish move.
Statistical studies indicate that an average directional indicator reading above 25 is associated with higher trend persistence, meaning trends are more likely to continue once this threshold is breached. For more details on how these components interact in real trading scenarios, you can consult the ADX DMI Indicator Details.
Recognizing False Signals and Common Pitfalls
While the average directional indicator is a robust tool, it does have limitations. The ADX measures trend strength but does not specify direction. This means traders must always look to +DI and -DI for directional clues.
One common pitfall is relying solely on ADX readings during fast-moving or volatile markets. The indicator is calculated using smoothed averages, which introduces lag. This can cause signals to appear after much of the move has already occurred, especially in sharp reversals or news-driven environments.
Choppy, sideways markets often generate whipsaw signals, where +DI and -DI cross frequently without a sustained trend. In these conditions, the average directional indicator may produce multiple false entries, leading to frustration and potential losses.
To mitigate these risks, always confirm ADX-based signals with additional tools. For example, look for supporting evidence in price action patterns, or use volume spikes to validate breakouts. Avoid trading when the ADX is below 20, as this usually signals a lack of clear direction.
By combining the average directional indicator with other technical and fundamental factors, you can filter out noise, reduce false positives, and increase the reliability of your trading decisions.
Practical Applications: Integrating ADI/ADX into Trading Strategies
Mastering the average directional indicator can transform your approach to trading, offering a structured way to spot trends, manage risk, and boost profitability. In this section, we explore practical methods to integrate the average directional indicator into daily trading routines for any asset class.
 into Trading Strategies">
Using ADX for Trend Identification and Trade Entry
The average directional indicator is a cornerstone for identifying robust market trends. Traders often look for the ADX line rising above 25 as a sign of a strong trend. When +DI crosses above -DI, it signals bullish momentum, while the reverse suggests bearish conditions.
A typical long entry strategy could involve:
- Waiting for ADX to rise above 25
- Confirming +DI is above -DI
- Entering a trade on a pullback with trend confirmation
Backtesting across various markets, including Southeast Asian equities, has shown that filtering trades with the average directional indicator can increase entry accuracy and reduce false signals. For more on real-world effectiveness, see this study on technical trading rules in Southeast Asian markets.
ADX in Risk Management and Trade Exits
Effective risk management is essential for long-term success, and the average directional indicator offers clear guidance for exits. When the ADX starts to drop below 20 or shows divergence from price, it often signals potential trend exhaustion.
Consider these exit strategies:
- Close positions when ADX falls sharply after a strong trend
- Use ADX divergence as an early warning to tighten stops
- Avoid entering trades in low ADX environments to reduce whipsaw risk
A disciplined exit plan using the average directional indicator helps traders preserve gains and avoid unnecessary losses in choppy markets.
Multi-Timeframe and Multi-Asset Analysis with ADX
Applying the average directional indicator across multiple timeframes enhances signal reliability. For instance, aligning daily and 4-hour ADX readings can filter out noise and confirm trend strength before committing capital.
In forex and crypto markets, traders might:
- Scan weekly charts for major trend direction
- Use daily ADX to confirm trend persistence
- Fine-tune entries on 4-hour charts for optimal timing
This multi-timeframe approach with the average directional indicator has been shown to reduce false positives and improve overall trade quality, especially in volatile asset classes.
Integrating ADX with Other Technical Indicators
The average directional indicator becomes even more powerful when used alongside other tools like RSI, MACD, or moving averages. For example, combining ADX with RSI helps filter out overbought or oversold signals that lack trend confirmation.
A robust trading system might include:
| Indicator | Role | Example Use Case |
|---|---|---|
| ADX | Trend strength | Confirming market phase |
| RSI | Momentum/overbought zones | Timing entry/exit |
| MACD | Trend change | Supplementing ADX moves |
By building rules-based systems around the average directional indicator, traders can reduce emotional decision-making and improve consistency.
How AI-Powered Tools Enhance ADX-Based Trading
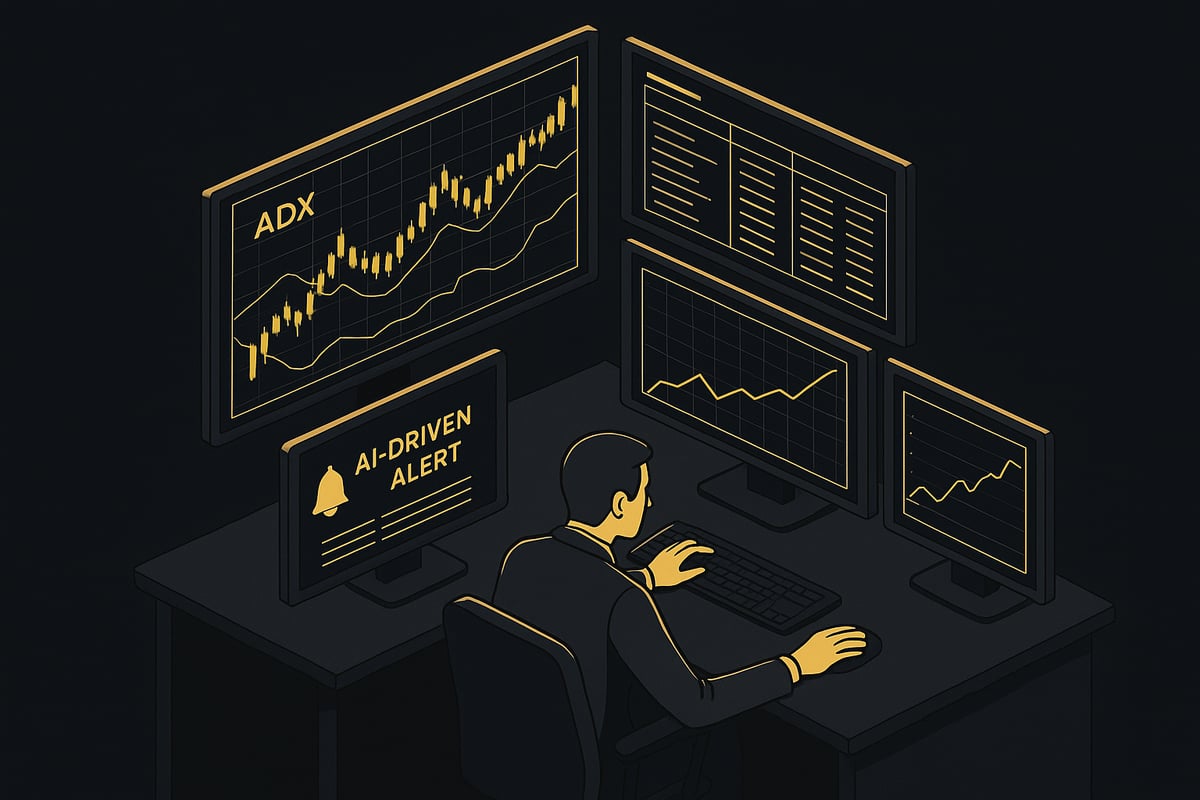
Modern AI-powered platforms are revolutionizing how traders use the average directional indicator. Tools like PipTrend analyze ADX, +DI, and -DI in real time, delivering instant buy and sell signals that adapt to changing market conditions.
With AI-driven alerts:
- Lag is reduced, making ADX signals more actionable
- Multi-timeframe ADX analysis becomes seamless
- Traders gain confidence through automated, data-driven decisions
Imagine receiving an alert as soon as the average directional indicator confirms a new trend, letting you act quickly and efficiently. This fusion of AI and the average directional indicator is set to define smart trading in 2026.
Advanced ADX Strategies and Customization for 2026
Mastering the average directional indicator in 2026 requires more than understanding the basics. Traders need to adapt their strategies, optimize indicator settings, and leverage automation to stay competitive. This section explores advanced ADX techniques, real-world applications, and customization options for modern markets.
Optimizing ADX Settings for Modern Markets
Fine-tuning the average directional indicator is essential for adapting to different asset classes and volatility regimes. Shorter ADX periods, like 7 or 10, are often preferred for crypto or high-frequency environments, while traditional 14 or 21 settings work better for blue-chip stocks.
| Asset Class | Typical ADX Period | Volatility Level | Notes |
|---|---|---|---|
| Crypto | 7 – 10 | High | Responds quickly to shifts |
| Forex | 10 – 14 | Medium | Balances noise and signal |
| Stocks | 14 – 21 | Low/Medium | Reduces false positives |
Recent research confirms that optimized ADX settings can significantly enhance trend detection and forecasting accuracy. For deeper insights, the Key technical indicators for stock market prediction article explores how the average directional indicator supports market prediction across asset types.
Algorithmic and Automated Trading with ADX
The average directional indicator is a cornerstone in many algorithmic trading models. Modern platforms like TradingView or MetaTrader allow traders to automate ADX-based entries and exits, reducing emotional bias and improving execution speed. Here is a sample ADX-based strategy in pseudocode:
if ADX > 25 and +DI > -DI:
 enter_long()
elif ADX > 25 and -DI > +DI:
 enter_short()
if ADX drops below 20:
 exit_all_positions()
Institutional trading bots often integrate ADX with machine learning, optimizing trade timing and risk management. To learn how AI-driven tools are transforming indicator-based automation, see Integrating AI with Trading Indicators.
ADX for Portfolio Diversification and Asset Allocation
The average directional indicator provides a systematic way to identify trending versus range-bound assets. By rotating capital into assets with strong ADX readings, traders can dynamically balance their portfolios and potentially improve risk-adjusted returns.
A recent simulation demonstrated that using ADX to guide allocation led to higher Sharpe ratios and smoother equity curves:
| Strategy | Sharpe Ratio | Max Drawdown |
|---|---|---|
| ADX-based rotation | 1.35 | -8% |
| Static allocation | 1.02 | -12% |
This approach is especially effective in volatile years, as the average directional indicator helps avoid stagnant markets and focuses exposure where trends are more persistent.
Custom Scans and Alerts with ADX
Setting up custom scanners and alerts for the average directional indicator empowers traders to spot opportunities in real time. Most trading platforms allow you to filter assets by ADX value, +DI/-DI position, or ADX slope.
Key screening criteria include:
- ADX > 30 for strong trend candidates
- +DI > -DI for bullish setups
- ADX rising for emerging trends
Integrating ADX alerts on desktop and mobile platforms ensures traders never miss a critical signal. These customizations streamline decision-making and enhance overall trading discipline.
Case Studies: Real-World Successes and Challenges
In 2025, a trend-following strategy based on the average directional indicator outperformed the S&P 500 by focusing on assets with sustained ADX readings above 25. However, during periods of market chop, ignoring ADX signals led to a string of losses due to false breakouts and whipsaws.
| Scenario | Outcome | Lesson Learned |
|---|---|---|
| Strict ADX filtering | Outperformed market | Reduced false trades |
| Ignored ADX in chop | Underperformed | Increased drawdown |
Professional traders emphasize the importance of respecting the average directional indicator's readings and combining them with other forms of analysis to minimize risk.
The Future of the Average Directional Indicator: Trends and Innovations in 2026
The average directional indicator continues to evolve as financial markets undergo rapid transformation. In 2026, traders face heightened volatility, algorithmic dominance, and new asset classes. Staying ahead means adapting your approach and understanding how the average directional indicator is changing to meet modern demands.
Evolving Market Conditions and ADX Relevance
In 2026, the trading landscape is shaped by algorithmic strategies and round-the-clock global markets. The average directional indicator remains essential for identifying trend strength, especially in fast-moving environments like crypto and DeFi.
As volatility spikes, the indicator’s ability to filter noise is invaluable. ADX readings above 25 help traders distinguish real trends from short-lived price swings. For instance, during recent market turbulence, the average directional indicator provided timely signals when traditional momentum indicators faltered.
A 2023 study on the profitability of technical analysis during the COVID-19 market meltdown highlighted ADX’s reliability in extreme market conditions. This research supports the continued relevance of the average directional indicator for trend confirmation, even as new assets and trading hours emerge.
Integration with AI, Machine Learning, and Big Data
Artificial intelligence is fundamentally reshaping how traders use the average directional indicator. Machine learning models now incorporate ADX data to improve trend forecasting and signal accuracy. These systems analyze vast datasets, learning to recognize subtle market shifts that might elude even experienced analysts.
Big data platforms process millions of price points per second, enabling the average directional indicator to adapt in real time. AI-driven algorithms can adjust ADX parameters dynamically, optimizing for asset class and volatility. Backtests reveal that AI-enhanced ADX strategies outperform traditional methods, boosting returns and reducing false signals.
For quantitative traders, integrating the average directional indicator into neural networks or ensemble models is becoming standard practice. This synergy between classic technical analysis and cutting-edge AI is defining the next era of trading innovation.
User Experience and Visualization Advances
User interfaces for the average directional indicator have undergone a revolution. Modern charting platforms offer interactive dashboards that visualize ADX, +DI, and -DI across multiple timeframes and assets.
Traders can now customize indicator displays, set advanced alerts, and view trend strength in context—all from a single screen. Mobile and cloud-based tools ensure that the average directional indicator is accessible anywhere, supporting the needs of both retail and institutional users.
Innovations such as heatmaps and multi-asset overlays help users spot opportunities at a glance. This enhanced visualization streamlines decision-making and reduces the cognitive load of monitoring several markets simultaneously.
Regulatory and Ethical Considerations
As algorithmic and AI-powered trading expand, regulatory scrutiny of technical indicators like the average directional indicator is increasing. Compliance requirements now dictate how automated strategies are deployed, particularly in high-frequency environments.
Ethical considerations also come to the forefront. The use of AI to optimize average directional indicator signals raises questions about transparency and market fairness. Traders must ensure their systems adhere to best practices and avoid creating unintended market distortions.
Regulators are issuing new guidelines to govern the use of automated ADX-based strategies. Staying informed about these changes is crucial for anyone relying on the average directional indicator for systematic trading.
Educational Resources and Community Support
The demand for expertise in the average directional indicator has led to a surge in online courses, webinars, and community forums. In 2026, traders benefit from real-time discussions, troubleshooting, and shared research on ADX applications.
Platforms like Technical Indicators Overview provide comprehensive resources covering the average directional indicator, helping both beginners and professionals deepen their understanding. Active communities foster collaboration, allowing users to exchange strategies and stay current on the latest advancements.
With a wealth of educational content and peer support, mastering the average directional indicator has never been more accessible. Ongoing learning is key to leveraging the indicator’s full potential in a rapidly changing market.
Now that you have a clear understanding of how the Average Directional Indicator can empower your trading decisions in 2026, imagine the advantage of combining this knowledge with real-time, AI-driven insights. With PipTrend, you gain instant alerts and actionable buy or sell signals—helping you move beyond guesswork and act confidently, no matter the market. If you are ready to experience a smarter, more reliable approach to trading, I encourage you to See Your Trading Improve With PipTrend and take the next step toward consistent results.