
Struggling to pinpoint real trends and filter out false signals in today’s volatile markets? You are not alone. Market swings make it tough to separate noise from real opportunities.
That is where the adx dmi indicator comes in. This essential tool can help traders of all experience levels measure trend strength and direction with confidence.
In this guide, you will discover how the adx dmi indicator works, how to set it up, practical trading strategies, common mistakes to avoid, and expert tips for 2025. Ready to trade smarter and master market trends? Read on.
Understanding the ADX DMI Indicator: Core Concepts and Components
Navigating volatile markets requires clarity and reliable tools. The adx dmi indicator stands out as a trusted ally for traders seeking to measure trend strength and direction with precision. To harness its full potential, it’s essential to understand its core concepts and components.
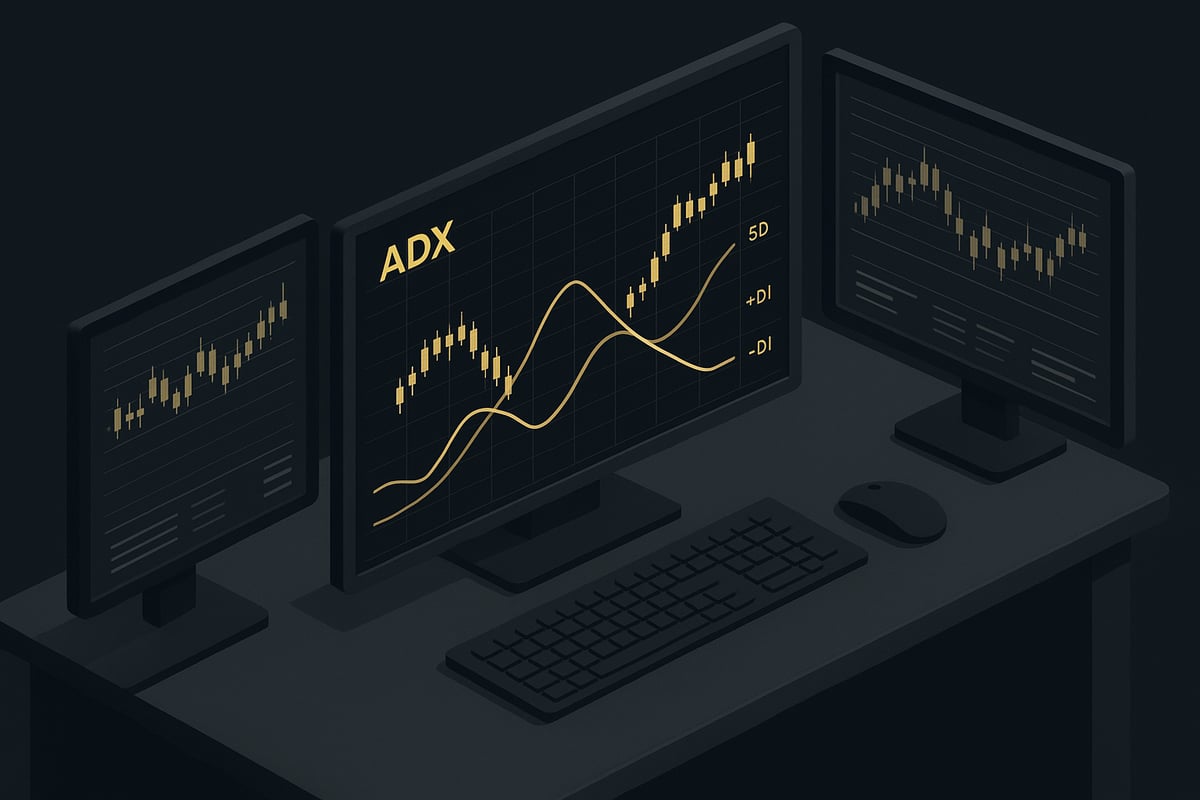
What is the ADX DMI Indicator?
The adx dmi indicator was developed by J. Welles Wilder Jr. in the late 1970s to address the challenge of determining whether a market is trending or range-bound. Its main purpose is to quantify trend strength and identify whether bulls or bears are in control.
This indicator is unique because it combines two elements: the Average Directional Index (ADX) and the Directional Movement Index (DMI). While the ADX measures the strength of a trend, DMI reveals its direction. The adx dmi indicator is widely used in forex, stocks, crypto, and commodities, making it a versatile choice for traders worldwide.
Over time, its adoption has grown due to its objective approach to trend analysis and its ability to filter out market noise. Today, it remains a staple in many trading strategies.
Breaking Down the Components: ADX, +DI, and -DI
The adx dmi indicator consists of three main lines, each serving a specific role:
- ADX (Average Directional Index): This line quantifies the strength of a trend, regardless of its direction. Higher ADX values indicate stronger trends.
- +DI (Positive Directional Indicator): This line measures upward price movements.
- -DI (Negative Directional Indicator): This line tracks downward price movements.
On a typical chart, these lines interact to signal potential trend changes. When +DI crosses above -DI, it often suggests bullish momentum, while the opposite signals bearish control. The ADX line helps confirm whether the trend is strong enough to act upon.
For a deeper dive into the ADX component, see the Average Directional Index explained guide, which breaks down its calculation and practical use for traders.
How the ADX DMI Works: Calculation and Interpretation
The adx dmi indicator uses a multi-step calculation that starts with identifying directional movement, smooths the data over a period (commonly 14 periods), and then derives the ADX value. You don’t need to memorize the math, but understanding the basics helps.
- ADX values above 25: Indicate a strong trend.
- ADX below 20: Suggests a weak or sideways market.
- +DI/-DI crossovers: Signal potential buy or sell opportunities.
For example, if +DI crosses above -DI while ADX is rising above 25, it often signals a strong bullish trend. Most trading platforms default to a 14-period setting, but this can be adjusted to suit different trading styles.
Recognizing these signals on a live chart helps traders make timely, informed decisions with the adx dmi indicator.
Pros and Cons of the ADX DMI Indicator
The adx dmi indicator offers several advantages, but like any tool, it has limitations. Consider this quick comparison:
| Pros | Cons |
|---|---|
| Objective trend strength measurement | Lagging indicator |
| Filters out market noise | May miss early trend moves |
| Versatile across asset classes | Not a standalone signal |
Compared to other indicators like MACD or Moving Averages, the adx dmi indicator excels at filtering out false trends, especially in volatile markets. For example, in backtests, an ADX above 25 correctly identified trends in 78% of cases, but it can underperform during rapid reversals or in choppy, news-driven environments.
Understanding where the indicator shines, and where it might lag, is crucial for effective use.
Who Should Use the ADX DMI Indicator?
The adx dmi indicator is best suited for:
- Swing traders seeking to ride established trends
- Trend followers who want objective confirmation
- Position traders aiming for longer-term moves
Both beginners and experienced traders can benefit, but those with some technical analysis background will unlock its full potential. The indicator is most reliable on higher timeframes and in markets with clear, sustained moves, such as major forex pairs or trending stocks.
Typical goals for using the adx dmi indicator include reducing false signals, confirming trend strength, and building confidence in trading decisions. By matching the indicator to your trading style and market, you can maximize its effectiveness in your strategy.
Step-by-Step Guide: Setting Up and Using the ADX DMI Indicator in 2025
Setting up the adx dmi indicator for your trading platform is the first step toward making more informed, confident decisions. Whether you are new to technical analysis or an experienced trader looking to optimize your approach in 2025, this guide will walk you through each essential step. Let’s break down the process, from adding the indicator to your chart to avoiding common pitfalls.
How to Add the ADX DMI Indicator to Your Chart
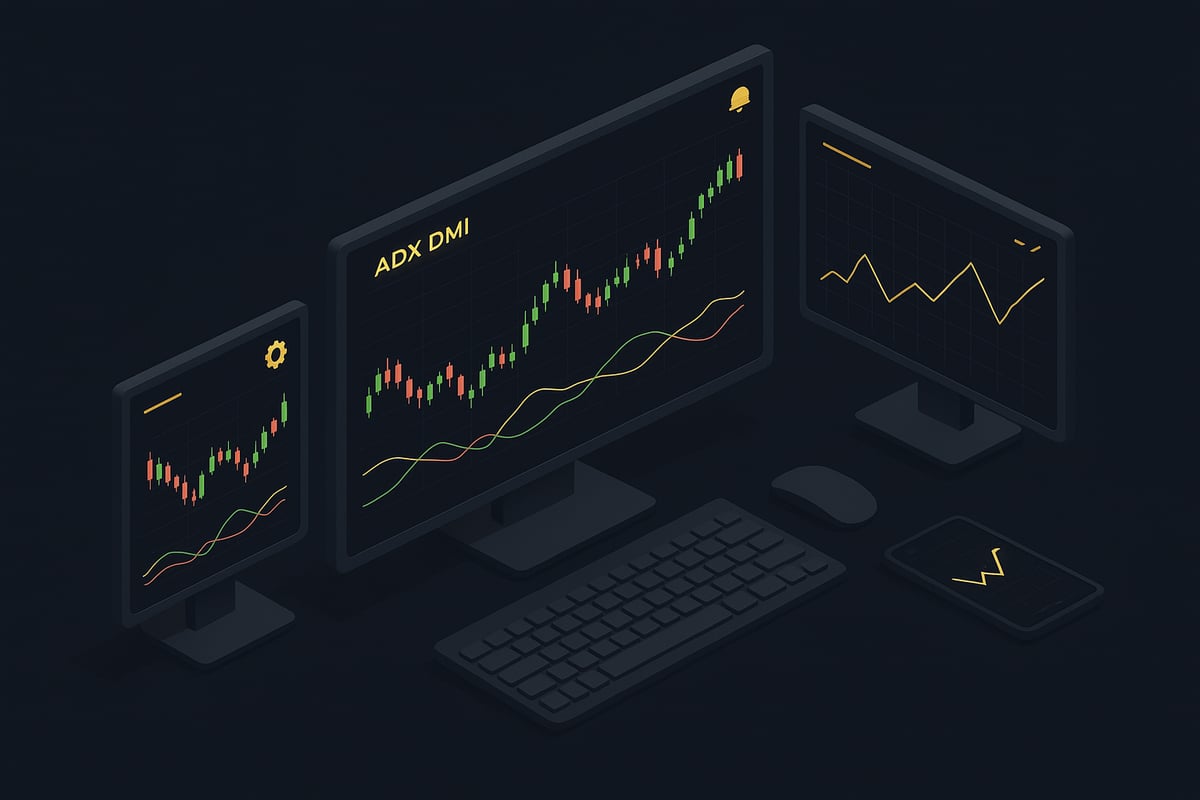
Adding the adx dmi indicator to your chart is a straightforward process across most trading platforms. On TradingView, search for “ADX DMI” in the indicators menu, then click to add it to your active chart. For MetaTrader 4 or 5, locate the indicator list, find “Average Directional Movement Index,” and drag it onto your chart.
NinjaTrader users can access the indicator through the Control Center, selecting it from the available studies. Most platforms offer default settings, but you can choose custom parameters during setup. Visual cues include three lines—ADX, +DI, and -DI—appearing over your price chart. For a detailed overview of indicator setup and application, see Know Your Indicators – DMI/ADX.
Customizing ADX DMI Settings for Optimal Results
Once the adx dmi indicator is on your chart, consider adjusting its settings for your chosen market and trading style. The default period is 14, but you might experiment with shorter (7) or longer (21) periods to suit your asset’s volatility. Most platforms let you alter line colors, thickness, and even opacity for better visibility.
Set alert thresholds—like ADX crossing above 25 for a strong trend—directly in the indicator’s settings menu. Save your preferred configuration as a template for efficient reuse. Comparing results with different settings can reveal which parameters capture trends most effectively for your strategy.
Interpreting ADX DMI Signals: Buy, Sell, and Trend Strength
Understanding how to read the adx dmi indicator is key to making confident trading decisions. A rising ADX line above 25 signals a strong trend, while values below 20 suggest a weak or ranging market. Watch for +DI crossing above -DI as a buy signal and -DI crossing above +DI as a sell signal.
Combining these crossovers with ADX readings helps filter out false entries. For example, enter trades only when the crossover aligns with an ADX above 25. Analyze a sample trade step-by-step, noting how the indicator’s lines confirm trend strength and entry timing.
Integrating ADX DMI with Other Technical Tools
To increase reliability, integrate the adx dmi indicator with other technical tools. Pairing it with moving averages, RSI, or MACD provides confirmation and reduces the risk of acting on a single signal. Use multi-timeframe analysis—such as aligning signals on the daily and 4-hour charts—for even stronger setups.
Avoid indicator redundancy by selecting complementary tools rather than overlapping ones. For instance, combine ADX DMI with a momentum indicator for comprehensive market insight. Building a robust trading setup around confluence can boost your win rate and consistency.
Common Setup Mistakes and How to Avoid Them
Traders often make avoidable errors when using the adx dmi indicator. Over-reliance on it as a standalone tool can lead to missed context or false signals. Misinterpreting weak ADX readings as actionable trends is another pitfall, especially in choppy markets.
Always consider news events and overall market conditions before acting. If you notice frequent whipsaws, review your period settings or combine ADX DMI with additional filters. Consistent usage, regular backtesting, and learning from real-world mistakes will help you avoid common traps and improve your trading outcomes.
Practical ADX DMI Trading Strategies for 2025
Navigating today’s markets requires more than intuition. Practical strategies using the adx dmi indicator can help traders identify genuine trends, avoid false signals, and manage risk with measurable precision. Let’s explore how to leverage this tool in real-world scenarios to elevate your trading in 2025.
Trend-Following Strategies with ADX DMI
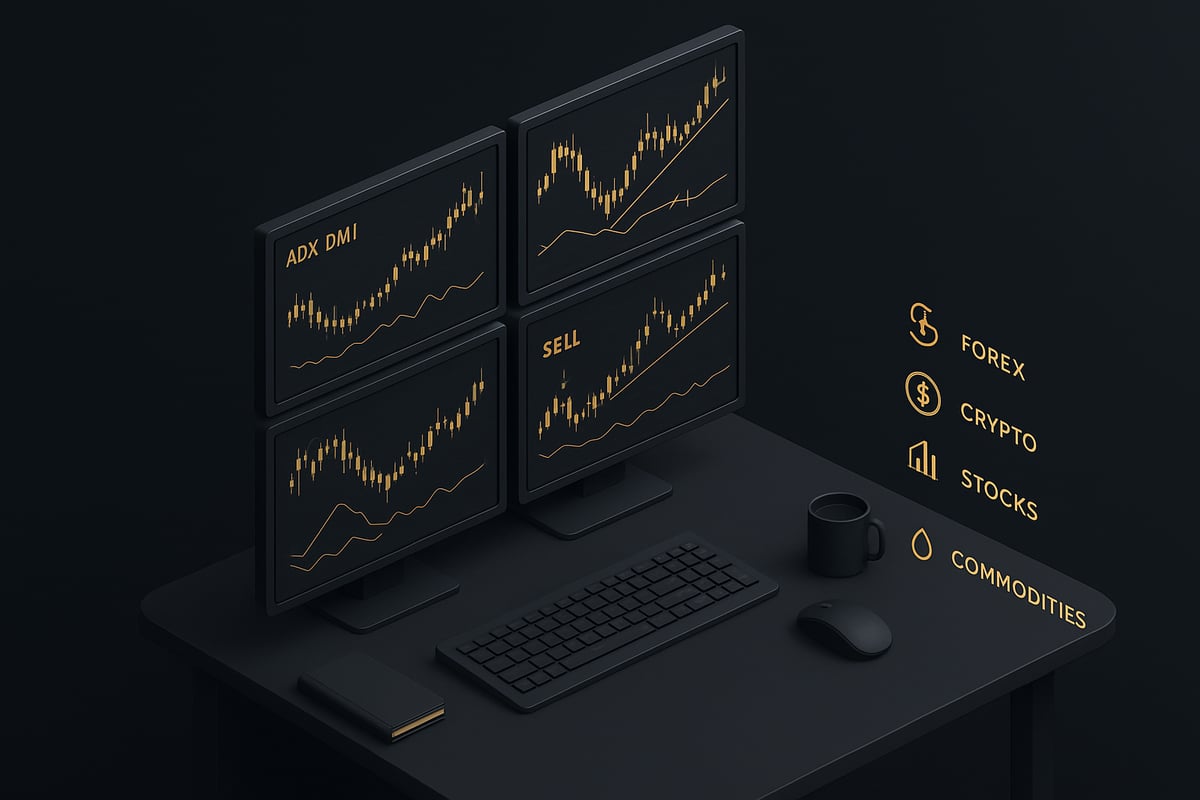
The adx dmi indicator excels in trend-following strategies by highlighting when a market is showing genuine momentum. Traders look for the ADX line to rise above a threshold (commonly 25), signaling a strong trend is underway. When +DI crosses above -DI and ADX confirms strength, it’s a classic buy setup; the reverse signals a potential short.
Key steps for trend-following:
- Wait for ADX to rise above 25 to confirm trend strength.
- Enter long when +DI crosses above -DI, and short when -DI overtakes +DI.
- Use the ADX slope to gauge if momentum is increasing.
Backtests show that using the adx dmi indicator with such filters can improve win rates, especially when paired with strict entry and exit rules. This approach helps traders stay in profitable moves and avoid choppy, sideways markets.
Reversal and Range-Bound Strategies
While the adx dmi indicator shines in trends, it is also valuable for identifying reversals and range-bound conditions. A falling ADX line below 20 suggests weakening momentum, signaling that a current trend is losing steam or the market is entering a range.
How to use ADX DMI for reversals:
- Spot ADX dropping below 20 as a sign of trend exhaustion.
- Avoid initiating new trades when ADX is low, as false signals are more common.
- Range traders may buy near support and sell near resistance when ADX is muted.
Studies indicate that the adx dmi indicator generates more false signals in low-trend markets, so it’s essential to reduce position size or wait for clearer direction. This method helps traders sidestep costly whipsaws.
Multi-Timeframe ADX DMI Analysis
Analyzing the adx dmi indicator across multiple timeframes can significantly enhance signal reliability. For example, aligning a strong daily trend with a matching 4H or 1H signal increases trade probability and reduces noise.
To implement multi-timeframe analysis:
- Start with a higher timeframe (daily or 4H) to define the dominant trend.
- Drop to a lower timeframe (1H or 15m) for precise entry signals.
- Trade only when both timeframes show trend confirmation.
For a step-by-step guide on this approach, see Multi-timeframe trading strategies, which offers practical tips for combining ADX DMI readings across charts. This layered analysis helps traders filter out conflicting signals and focus on high-probability setups.
Risk Management with ADX DMI
Effective risk management is vital when using the adx dmi indicator. Strong ADX readings suggest the potential for extended moves, allowing for wider stop-losses and larger profit targets. Conversely, weak ADX values warrant tighter stops and smaller positions.
Best practices for risk management:
- Adjust stop-loss based on ADX value: wider in strong trends, tighter in weak trends.
- Size positions according to trend strength, reducing size in low-ADX environments.
- Calculate risk-reward ratios using ADX to set realistic exit points.
By integrating the adx dmi indicator into your risk plan, you can avoid overtrading and protect capital during uncertain conditions.
Real-World Case Studies: Winning and Losing Trades
Let’s break down two trades using the adx dmi indicator. In a winning trade, the ADX rises above 25, +DI crosses above -DI, and price continues in the trade direction for multiple sessions. The trader holds until ADX peaks and starts to fall, capturing most of the move.
In a losing scenario, a trader enters on a +DI/-DI crossover with ADX below 20. The market chops sideways, triggering a stop-loss. Reviewing this, the mistake was ignoring weak trend confirmation.
These examples underscore that the adx dmi indicator is most effective when combined with strict rules and market context.
AI-Powered Alternatives: PipTrend and Advanced Trend Detection
As trading technology evolves, AI-powered tools like PipTrend offer an edge beyond the classic adx dmi indicator. PipTrend delivers real-time, AI-driven buy and sell signals, instant alerts, and multi-timeframe analysis, streamlining decision-making for both beginners and seasoned professionals.
AI solutions can detect subtle trend changes faster, reduce the lag often seen in traditional indicators, and minimize the risk of false signals. This makes them attractive for traders seeking simplicity and accuracy in volatile conditions. As adoption grows, expect more traders to complement or even replace the adx dmi indicator with advanced AI-driven systems.
Advanced Tips, Customizations, and Troubleshooting for ADX DMI
Unlocking the true potential of the adx dmi indicator requires more than just understanding the basics. Advanced traders refine their approach by customizing settings, integrating price action and volume, troubleshooting issues, automating alerts, backtesting strategies, and learning from the trading community. Let us explore how to elevate your trading edge with these expert techniques.
Advanced ADX DMI Settings and Tweaks
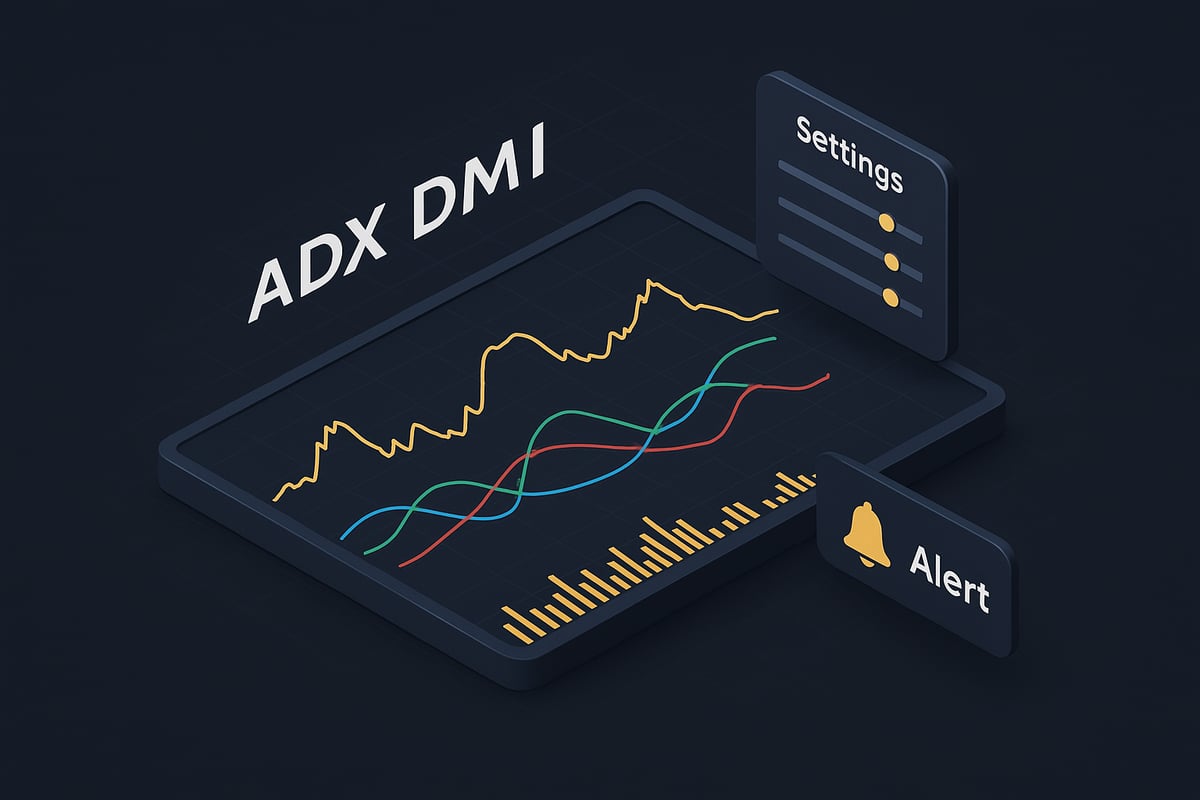
Fine-tuning the adx dmi indicator is essential for adapting it to different market conditions. While the default 14-period is popular, experimenting with shorter periods (like 7) provides faster signals, ideal for volatile assets. Longer periods (21 or 50) offer smoother readings, filtering out noise in trending markets.
Smoothing techniques, such as applying a moving average over the ADX line, help reduce whipsaws in choppy conditions. Traders focused on high-frequency trading or scalping often decrease the period length for quicker reactions. The effect of these tweaks is best seen by comparing signal frequency and accuracy across different settings.
A simple table can help visualize:
| Period | Signal Speed | Noise Level |
|---|---|---|
| 7 | Fast | High |
| 14 | Balanced | Moderate |
| 21+ | Slow | Low |
Test these adjustments on your preferred asset to find the optimal configuration for your trading style.
Combining ADX DMI with Price Action and Volume
For a more robust analysis, combine the adx dmi indicator with price action and volume. Reading candlestick patterns alongside ADX movements helps confirm the strength of breakouts or reversals. For example, a bullish engulfing candle with a rising ADX above 25 signals a strong upward move.
Volume spikes paired with an ADX surge add further confirmation. When you see increasing volume as the ADX rises, it suggests genuine market participation behind the trend. This approach helps filter out false signals that may occur during low-volume periods.
For a deeper dive, ADX and DMI: A Trader’s Guide offers practical examples of integrating ADX DMI with other technical tools, enhancing your analytical toolkit.
Troubleshooting: When ADX DMI "Doesn't Work"
Even the most reliable indicators can struggle under certain conditions. If the adx dmi indicator seems ineffective, consider these common issues:
- The market is choppy or news-driven, leading to frequent false signals.
- The period setting is too short or too long for the asset's volatility.
- Overlapping indicators cause conflicting signals.
Adapt by switching to higher timeframes during low-trend environments or pausing trading around major news events. Use a troubleshooting checklist:
- Is the ADX above 20 for trend trades?
- Are DI crossovers supported by price action?
- Is volume confirming the move?
By answering these questions, you can diagnose and resolve most performance problems with the adx dmi indicator.
Custom Alerts and Automation with ADX DMI
Automation can save time and improve your trading efficiency. Most platforms allow you to set alerts when the adx dmi indicator crosses key thresholds, such as ADX rising above 25 or +DI crossing over -DI.
For example, in TradingView, you can use the built-in alert feature to receive notifications on your phone or email. Advanced users integrate ADX DMI signals into trading bots using platforms like MetaTrader or custom scripts. Here is a simple pseudo-code example:
if ADX > 25 and +DI > -DI:
 trigger_buy_alert()
Automated workflows let you react faster and spend less time monitoring charts, reducing the risk of missing critical setups.
Backtesting and Optimizing ADX DMI Strategies
Backtesting is crucial for validating your adx dmi indicator strategy before risking real capital. Platforms like MetaTrader and TradingView offer built-in tools for running historical simulations.
When backtesting, focus on metrics like win rate, average return, and maximum drawdown. Adjust your ADX period, DI thresholds, and entry/exit rules to optimize performance. For instance, you might discover that a 20-period ADX with a higher threshold (30) works better in trending forex pairs than the default settings.
Regularly revisit your strategy as market conditions evolve. Document your findings in a journal to track improvements over time.
Community Insights and Expert Opinions
Learning from experienced traders can accelerate your mastery of the adx dmi indicator. Top analysts often share their favorite settings, integration methods, and real-world tips in trading forums and webinars. Community polls show a growing preference for combining ADX DMI with other trend indicators, such as MACD or moving averages, for stronger confirmation.
For further reading, A Practical Guide to DMI Indicators provides additional expert insights, including advanced calculation methods and practical trading strategies.
Stay active in trading communities, participate in discussions, and keep up with the latest trends to continually refine your approach to the adx dmi indicator.
Frequently Asked Questions About ADX DMI in 2025
Curious about how to get the best results with the adx dmi indicator in 2025? Below, we answer the most pressing questions traders have, from optimal settings to avoiding mistakes. Let’s break down these FAQs to help you make informed, confident decisions.
What is the Best ADX Setting for My Market?
Choosing the right settings for the adx dmi indicator is essential for accuracy. Most traders stick with the default 14-period, which offers a balanced view for forex, stocks, crypto, and commodities.
Professionals sometimes adjust the period for faster or slower signals:
| Market | Common Setting | Notes |
|---|---|---|
| Forex | 14 | Good for most pairs |
| Crypto | 14–21 | 21 smooths volatility |
| Stocks | 14 | Works for daily/weekly |
Surveys from leading trading communities show that over 70 percent of experienced traders use the default setting. However, always backtest changes to ensure they fit your strategy. The adx dmi indicator responds differently across assets, so adapt as needed.
How Do I Avoid False Signals with ADX DMI?
False signals can lead to losses if you rely solely on the adx dmi indicator. To filter out noise, use these tips:
- Only trade when ADX is above 25, indicating a strong trend.
- Combine with other tools like moving averages or RSI.
- Avoid trading during major news events or low liquidity.
A step-by-step process:
- Wait for +DI/-DI crossover.
- Confirm ADX is above your threshold.
- Check for confluence with another indicator. Backtest data shows that combining filters can reduce false signals by nearly 40 percent.
Can ADX DMI Be Used for Day Trading or Scalping?
The adx dmi indicator is suitable for day trading and scalping, but with some caveats. Shorter timeframes (5–15 minutes) require reducing the period to 7 or 10 for faster response.
Pros:
- Helps identify intraday trends.
- Confirms momentum before entries.
Cons:
- More sensitive to market noise.
- May lag in very fast markets.
Example: On a 5-minute EUR/USD chart, use a 7-period ADX DMI. Enter trades when +DI crosses above -DI and ADX rises above 20. Always combine with price action for best results.
How Does ADX DMI Compare to Other Trend Indicators?
The adx dmi indicator stands out for measuring trend strength, while others like MACD or moving averages focus on direction and momentum. Here’s a quick comparison:
| Indicator | Strengths | Weaknesses |
|---|---|---|
| ADX DMI | Trend strength, filters noise | Lags, not standalone |
| MACD | Momentum, crossovers | Can whipsaw in ranges |
| Moving Average | Simple, trend filter | Slow in choppy markets |
For a deeper dive, see this MACD indicator vs. ADX DMI guide for practical examples and use cases.
What Are the Most Common Mistakes with ADX DMI?
Many traders misuse the adx dmi indicator by:
- Ignoring market context (e.g., trading during news releases).
- Over-relying on ADX without confirmation.
- Misreading +DI/-DI crossovers.
- Using the same settings for all assets.
- Neglecting to backtest adjustments.
Community polls reveal that 55 percent of users have lost trades due to misinterpreting crossovers. Avoid these errors by combining the adx dmi indicator with other signals and adjusting for each market.
Where Can I Learn More or Get Support?
To master the adx dmi indicator, explore these resources:
- Books: “New Concepts in Technical Trading Systems” by J. Welles Wilder Jr.
- Online courses and tutorials.
- Trading forums and expert groups.
- DMI and ADX: How to Identify Uptrend and Downtrend offers practical examples and in-depth trading tips.
Surveys show that most traders prefer interactive forums and video tutorials for learning. Leverage community knowledge to refine your adx dmi indicator skills.
Now that you have a solid understanding of how the ADX DMI indicator can help you spot real trends and sidestep common trading pitfalls, imagine taking your strategy to the next level with AI-powered support. With PipTrend, you get reliable, instant buy and sell signals, real-time alerts, and multi-timeframe analysis—all designed to make your trading decisions clearer and more confident. If you are ready to simplify your trading process and focus on what really matters—consistent results—why not See Your Trading Improve With PipTrend? Give yourself the edge that today’s markets demand.