
Day trading in 2026 is moving faster than ever. With markets driven by algorithms and volatility at all-time highs, every decision counts.
Success now depends on mastering technical indicators for day trading. These tools give traders the objective signals needed to navigate unpredictable price swings and seize fleeting opportunities.
This guide reveals the seven most important technical indicators for day trading in 2026. You will learn how each indicator works, why it matters, and get actionable tips to improve your trading results.
Unlock the edge that technical analysis provides. Discover proven strategies, sharpen your skills, and take confident steps toward consistent profits by exploring our full guide.
The Role of Technical Indicators in Modern Day Trading
Modern day trading has undergone a dramatic transformation. The tools and strategies traders rely on today are shaped by rapid advances in technology, data, and artificial intelligence. Understanding how technical indicators for day trading have evolved is essential for anyone looking to stay competitive.
Evolution of Technical Indicators
Technical indicators for day trading have come a long way from their origins in manual charting. With the explosion of high-speed internet and advanced computing, traders now access real-time data and sophisticated charting platforms. The rise of algorithmic and AI-driven trading systems has made it possible to process vast datasets in milliseconds.
Retail traders, once limited by access and cost, can now use advanced indicators that were previously reserved for institutional desks. According to recent industry reports, over 80% of active day traders rely on at least three different technical indicators for day trading in their daily workflows. For a deeper dive into how AI is shaping indicator evolution, see this AI-Driven Decision Systems in Trading article.
Why Technical Indicators Matter in 2026
In 2026, markets are faster and more volatile than ever. Technical indicators for day trading provide traders with real-time, objective signals that help cut through market noise. These tools allow traders to spot emerging trends, potential reversals, and precise entry or exit points.
For example, a trader using technical indicators for day trading can quickly identify a trend reversal that might be missed by relying on price action alone. Without these tools, traders may act on emotion or outdated information, leading to costly mistakes. With them, the edge comes from data-driven decisions and improved risk management.
Types of Technical Indicators: Overlays vs. Oscillators
There are two main categories of technical indicators for day trading: overlays and oscillators. Overlays, such as moving averages and Bollinger Bands, are plotted directly on price charts. They help identify support, resistance, and volatility.
Oscillators, like RSI and MACD, move above or below a centerline and indicate momentum or trend strength. Combining overlays and oscillators is a best practice for robust analysis. For instance, if an overlay shows a price approaching a key level while an oscillator signals overbought conditions, traders gain extra confirmation before acting.
| Type | Examples | Main Use |
|---|---|---|
| Overlay | Moving Average, Bollinger Bands | Trend, Volatility |
| Oscillator | RSI, MACD | Momentum, Trend Confirmation |
Common Pitfalls and Best Practices
Many new traders fall into the trap of over-relying on a single technical indicator for day trading. This can lead to missed signals or false confidence. Ignoring broader market context or the inherent lag in some indicators is another common mistake.
To avoid these pitfalls, traders should always backtest and adapt their technical indicators for day trading to fit their unique strategies. Using confluence—when multiple indicators align—raises the probability of successful trades. As markets and indicators evolve, continuous learning and adaptation remain critical for sustained success.
7 Essential Technical Indicators for Day Trading in 2026
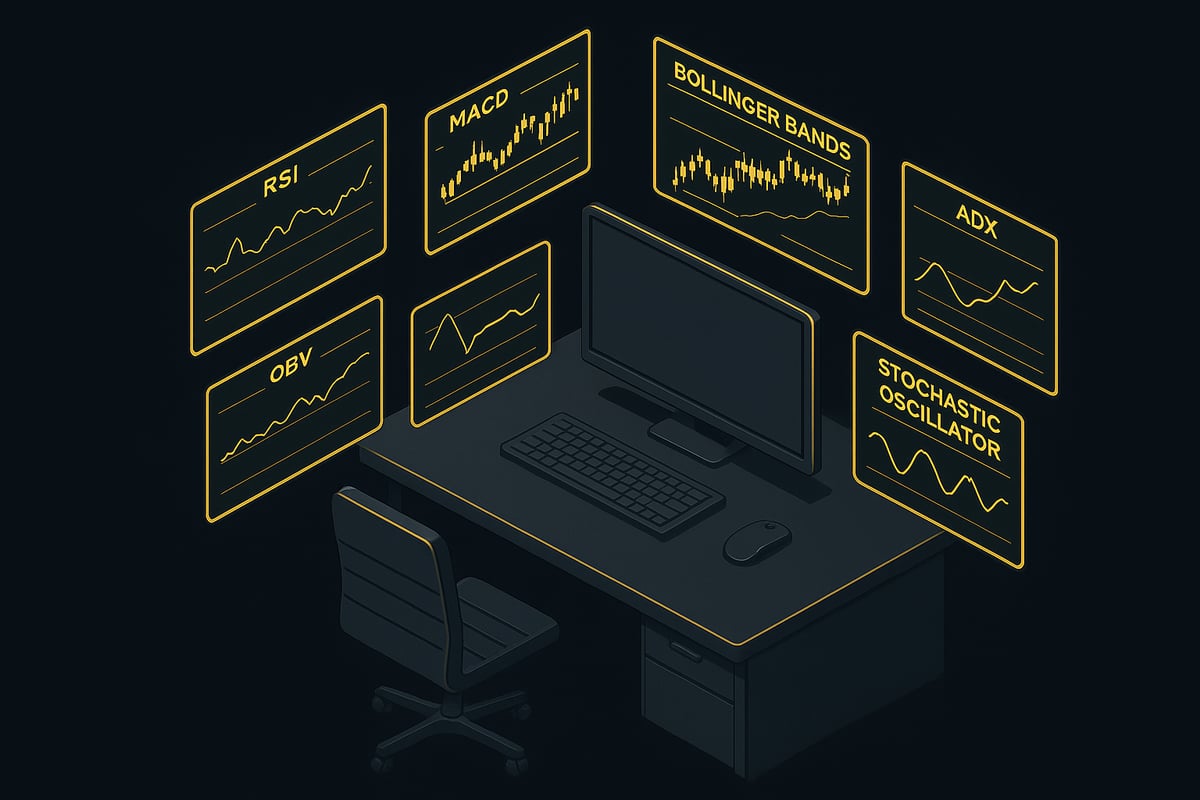
Mastering the right technical indicators for day trading is more important than ever in 2026. With markets evolving rapidly, traders need precision tools to identify opportunities, manage risk, and stay ahead of algorithmic trends. Below, we break down the seven most essential technical indicators for day trading, covering how each works, why they matter now, and practical advice for using them effectively.
1. Relative Strength Index (RSI)
The Relative Strength Index (RSI) remains a cornerstone among technical indicators for day trading. It measures the speed and change of price movements, oscillating between 0 and 100. Traders rely on RSI to spot overbought conditions (above 70) and oversold zones (below 30), providing actionable signals to enter or exit trades.
In 2026, RSI is more adaptive, often enhanced by AI to adjust thresholds in response to heightened volatility. For example, during a high-frequency trading session, an RSI divergence—where price makes a new high but RSI does not—can signal a potential reversal before it unfolds.
Tips for using RSI include:
- Combine RSI with trend-following indicators for confirmation.
- Adjust period settings to better fit the specific asset or market regime.
- Remember that in strong uptrends, RSI often ranges between 40 and 90, while in downtrends, it may stay between 10 and 60.
To dive deeper into RSI strategies, see this Relative Strength Index (RSI) guide.
2. Moving Average Convergence Divergence (MACD)
The Moving Average Convergence Divergence (MACD) is a versatile tool in the suite of technical indicators for day trading. MACD tracks the relationship between two exponential moving averages (typically 12 and 26 periods) and a signal line, providing insights into momentum shifts and trend direction.
In 2026, AI-driven MACD variants offer real-time adaptability, allowing traders to respond instantly to market volatility. For instance, a MACD line crossing above the signal line during a news-driven price spike can confirm a bullish reversal, giving traders the confidence to act.
Best practices with MACD include:
- Monitor the MACD histogram for additional momentum cues.
- Avoid relying solely on MACD in sideways markets, where false signals are more common.
- Recognize that a MACD line crossing above zero often signals the start of an uptrend.
3. Bollinger Bands
Bollinger Bands are a dynamic volatility indicator, making them invaluable technical indicators for day trading. They consist of upper and lower bands set a certain number of standard deviations from a moving average, expanding and contracting with market volatility.
In 2026, machine learning enables real-time band adjustments, reflecting ever-changing volatility conditions. A classic example is a Bollinger Band squeeze, where the bands contract tightly, signaling a potential breakout. Traders often wait for a price move beyond the bands, confirmed by increased volume, to enter trades.
Tips for maximizing Bollinger Bands:
- Look for price touches at the bands paired with strong volume as breakout indicators.
- Combine with momentum indicators for more robust signals.
- Remember: Tightening bands suggest low volatility and potential explosive moves, while widening bands indicate high volatility.
For a comprehensive breakdown, see Bollinger Bands explained.
4. Average Directional Index (ADX)
The Average Directional Index (ADX) is essential among technical indicators for day trading, as it measures trend strength on a scale from 0 to 100. An ADX reading above 25 signals a strong trend, while below 20 suggests a weak or ranging market.
In 2026, ADX is frequently integrated into algorithmic trading systems, helping filter trades for optimal trend conditions. For example, if ADX rises above 25 while the +DI is above the -DI, traders can confirm the start of a strong directional move and adjust their strategy accordingly.
Practical ADX tips:
- Pair ADX with its directional movement lines (+DI and -DI) for clarity on trend direction.
- Use ADX to avoid trend-based trades in ranging markets.
- Note that ADX rarely exceeds 60, and persistent readings below 20 indicate little trend.
Explore more in this Average Directional Index (ADX) overview.
5. On-Balance Volume (OBV)
On-Balance Volume (OBV) is a volume-based indicator that stands out among technical indicators for day trading. OBV adds volume on up days and subtracts it on down days, creating a running total that helps forecast price direction.
By 2026, OBV leverages big data analytics for sharper, real-time volume signals. A common scenario is OBV making higher highs while price consolidates, a sign that institutional traders may be accumulating positions before a breakout.
Key OBV strategies:
- Watch for OBV divergences as early warnings of possible reversals.
- Use OBV in conjunction with price action for confirmation.
- Consistent OBV increases typically signal an ongoing uptrend.
6. Momentum Oscillator
Momentum oscillators are powerful technical indicators for day trading, measuring the rate of price change over a set period. They help traders identify trend strength, overbought or oversold conditions, and potential reversals.
In 2026, these oscillators feature adaptive boundaries, often powered by AI to respond to shifting volatility. For example, a momentum oscillator divergence—where the indicator fails to confirm a new price high—can precede sharp reversals, especially in fast-moving markets like crypto.
Tips for optimal use:
- Customize upper and lower boundaries based on the asset’s historical volatility.
- Confirm momentum signals with trend indicators to reduce false positives.
- Identify key support and resistance levels to contextualize oscillator readings.
7. Stochastic Oscillator
The Stochastic Oscillator rounds out the list of essential technical indicators for day trading. It compares the closing price to a recent price range, typically over 14 periods, to pinpoint overbought (above 80) and oversold (below 20) conditions.
By 2026, real-time data feeds and AI smoothing have made the Stochastic Oscillator more accurate and responsive. For example, a stochastic crossover below 20 can highlight a high-probability buy setup, especially when aligned with prevailing trend direction.
Effective Stochastic Oscillator strategies:
- Use in trending markets for best results, avoiding choppy or low-volume environments.
- Experiment with fast and slow stochastic settings for varied sensitivity.
- Combine with other indicators to confirm reversal signals.
How to Combine Technical Indicators for Higher Probability Trades
Combining technical indicators for day trading is a powerful way to filter out noise and improve your trade accuracy. Rather than relying on a single tool, smart traders integrate multiple signals to build stronger cases for entry and exit. This approach helps you handle the complexity of modern markets with clarity and confidence.
The Power of Confluence
In today’s fast-moving environment, using technical indicators for day trading in isolation often leads to false signals. The real advantage comes from confluence—when two or more indicators agree on a trading setup. For example, if both RSI and MACD confirm a bullish reversal, the probability of success increases.
Studies show that traders who use confluence improve their win rates. According to industry experts, never rely on a single indicator. Instead, look for agreement among multiple tools. For a deeper dive into which indicators pair well, check out this Best indicators for day trading resource.
A confluence-driven approach gives your strategy a statistical edge, making it easier to act decisively and consistently.
Optimal Indicator Pairings and Strategies
Choosing the right combinations of technical indicators for day trading is crucial. Pairing trend indicators with momentum tools is a classic strategy. For instance, using a moving average (trend) alongside RSI (momentum) can help you spot not just the direction but also the strength of a move.
Here’s a sample table of effective pairings:
| Pairing Type | Example Combo | Use Case |
|---|---|---|
| Trend + Momentum | MA + RSI | Confirming trend entries |
| Volatility + Volume | Bollinger Bands + OBV | Breakout and continuation trades |
| Trend + Oscillator | ADX + Stochastic | Filtering trends from ranges |
Always align indicator timeframes for consistency. A practical setup might use a 20-period EMA, RSI, and Bollinger Bands to confirm a breakout before entering a trade.
Common Mistakes When Combining Indicators
A frequent mistake with technical indicators for day trading is redundancy—using multiple indicators that measure the same thing. This can lead to analysis paralysis, where too many signals cause hesitation or missed trades.
Another pitfall is overcomplicating your setup. For example, stacking five similar oscillators rarely adds value and can create confusion. Successful traders develop clear rules and backtest their combinations.
Consider a case where a trader used six overlapping indicators. Despite strong signals, indecision led to missed opportunities. Simplicity and focus are essential for effective execution.
Customizing Indicator Settings for 2026 Markets
Adapting technical indicators for day trading to current market conditions is vital. Volatility, asset class, and trading style all influence optimal indicator parameters. In 2026, AI and machine learning tools help traders optimize settings in real time.
For example, adaptive moving averages adjust to shifting volatility, while AI-driven oscillators can recalibrate boundaries based on historical data. Regularly review your strategies and tweak indicator settings as markets evolve.
Continuous evaluation ensures your indicator combinations remain relevant, giving you an edge in dynamic trading environments.
Practical Tips for Using Technical Indicators in Day Trading
Mastering technical indicators for day trading requires not just knowledge of the tools but also practical strategies for applying them in the fast-moving markets of 2026. Success depends on rigorous testing, adaptability, disciplined risk management, and a commitment to ongoing learning.
Backtesting and Forward Testing Strategies
Before risking capital, always backtest your technical indicators for day trading using historical data. Backtesting helps you understand how a strategy would have performed in various market conditions. Use platforms like TradingView or MetaTrader to simulate trades and analyze outcomes.
Forward testing, or paper trading, allows you to apply your system in real-time without financial risk. This step reveals how your indicators perform in live markets, exposing any weaknesses. Consider this table for comparison:
| Testing Type | Purpose | Tools |
|---|---|---|
| Backtesting | Historical performance check | TradingView, Python |
| Forward testing | Real-time strategy validation | Demo accounts |
Research shows that traders who backtest and forward test consistently improve their win rates. Make this a core habit when using technical indicators for day trading.
Adapting to Market Conditions in 2026
Markets in 2026 are shaped by high volatility, algorithmic trading, and emerging asset classes. To stay competitive, adjust your technical indicators for day trading to fit the current regime. For instance, during news events, tighten indicator periods for faster signals, or widen them in slow markets to reduce noise.
AI-driven tools now offer adaptive indicator settings that respond to changing conditions. As highlighted in the AI-Driven Algorithmic Trading Study, integrating machine learning can help your strategies evolve with the market. The key is flexibility: be ready to tweak your approach for stocks, crypto, or forex as required.
Risk Management with Technical Indicators
Technical indicators for day trading are powerful for setting precise stop-loss and take-profit levels. For example, use ATR (Average True Range) to size your stops based on volatility, or set profit targets when an oscillator signals overbought.
Position sizing is equally important. Let indicators guide you to risk only a small percentage of your capital per trade. Avoid emotional decisions by sticking to indicator-based rules, especially during rapid price swings.
Consider this scenario: If your indicator signals a bullish entry, set a stop-loss just below recent support and a take-profit at the next resistance. This approach supports a favorable risk-reward ratio, protecting your account from large drawdowns.
Staying Ahead: Continuous Learning and Technology
Continuous learning is essential for leveraging technical indicators for day trading. Markets and technology evolve rapidly, so commit to regular study of new indicators, AI-powered trading tools, and market research.
Join trading communities and attend webinars to stay informed about fresh strategies. For example, the Impact of Technical Indicators on Machine Learning Models paper explores how indicator selection can enhance predictive power in AI-driven systems. Adopting such advancements keeps you ahead of the curve.
Traders who embrace new tools and refine their skills consistently report stronger results. Make ongoing education a cornerstone of your trading journey.
Frequently Asked Questions About Technical Indicators for Day Trading
Do you have questions about technical indicators for day trading? Here are clear, practical answers to the most common concerns traders face in 2026.
What Makes a Technical Indicator “Essential” in 2026?
An essential technical indicator for day trading in 2026 must be reliable, adaptable, and easy to interpret. The best indicators offer predictive power across changing market conditions. They integrate seamlessly with modern trading platforms and support quick decision-making.
Indicators like RSI, MACD, and Bollinger Bands have stood the test of time because they consistently help traders spot trends and reversals. Experts agree that adaptability is crucial, as AI and algorithmic trading reshape the landscape. Traders should prioritize technical indicators for day trading that deliver clear, actionable signals backed by historical success.
How Many Technical Indicators Should I Use?
Using too many technical indicators for day trading can lead to confusion and conflicting signals. Most professional traders recommend focusing on two to four complementary indicators. This allows for a balanced approach without overwhelming your analysis.
Beginners may start with just one trend and one momentum indicator, gradually adding more as their skills grow. Experienced traders may customize their indicator sets for specific assets or market conditions. The key is to avoid indicator overload and ensure each tool adds unique value to your trading decisions.
Are AI-Powered Indicators Worth Using?
AI-powered technical indicators for day trading offer significant advantages in speed and adaptability. These tools can process large datasets in real time, identify subtle patterns, and adjust parameters automatically. However, some traders caution against relying solely on AI, as overfitting and lack of transparency can be concerns.
Recent research, such as Decision Trees in Intraday Trading, demonstrates how advanced algorithms can enhance intuitive strategies and improve the effectiveness of technical indicators for day trading. Evaluate AI tools carefully, and always backtest them before integrating into your daily workflow.
Can Technical Indicators Guarantee Profit?
No technical indicators for day trading can guarantee profit. Markets are unpredictable, and every strategy carries risk. Indicators provide valuable insights, but successful trading depends on discipline, robust risk management, and continuous learning.
Historical data shows that indicator-based strategies can improve consistency, but losses are still possible. Set realistic expectations, use stop-losses, and focus on refining your approach over time. Remember, indicators are tools, not magic formulas.
Now that you understand how vital technical indicators are for navigating the fast paced world of day trading in 2026, it’s time to put this knowledge into action. The right tools can help you cut through the noise, spot real opportunities, and make smarter decisions in any market—whether you trade forex, crypto, stocks, or indices. PipTrend’s AI powered technology gives you instant buy and sell signals, so you can trade with clarity and confidence, not second guessing your moves. If you’re ready to take your trading to the next level, Start Catching Winning Trades, Right Now!