
In a rapidly evolving global economy, understanding which numbers matter most can mean the difference between thriving and falling behind in 2026. The power to interpret lagging and leading indicators gives business leaders, investors, and analysts a crucial edge.
This comprehensive guide will demystify these essential indicators, showing you how to identify, interpret, and leverage them for strategic success. You will discover clear differences between types, practical examples, methods for integration into planning, common mistakes to avoid, and actionable steps for implementation.
Ready to unlock the insights that drive better decisions? Dive in and position yourself ahead of the curve.
Understanding Economic Indicators: The Foundation of Strategic Decision-Making
Economic indicators are the compass guiding business leaders, investors, and policymakers through the ever-changing landscape of the global economy. These indicators are statistics that reveal patterns and shifts in business activity, financial markets, and overall economic health. Understanding lagging and leading indicators gives decision-makers a crucial edge, allowing them to anticipate changes and respond with agility.
Economic indicators serve as the building blocks for fiscal and monetary policies. Governments and central banks rely on these statistics to set interest rates, adjust tax policies, and manage inflation. For companies, tracking indicators helps shape long-term strategies and short-term pivots, while investors use them to spot opportunities or risks before they become obvious to the broader market.
There are three main types of economic indicators: leading, lagging, and coincident. Each type plays a unique role in interpreting economic trends. These indicators are produced from a mix of regular surveys, official government data releases, and specialized industry reports. For example, quirky measures like the lipstick indicator—where increased lipstick sales signal economic downturns—can sometimes offer unique insights, but traditional statistics remain the backbone of serious analysis.
Market sentiment often shifts in response to indicator releases, making them essential for economic forecasting. When business leaders master the use of lagging and leading indicators, they gain the power to make informed, proactive decisions that can define their success.
Defining Economic Indicators and Their Role
Economic indicators are more than just numbers—they are vital signals that help decode the complex story of economic activity. At their core, indicators show where the economy has been, where it is now, and where it might be headed. The role of these indicators is to translate raw data into meaningful insights for planning and performance evaluation.
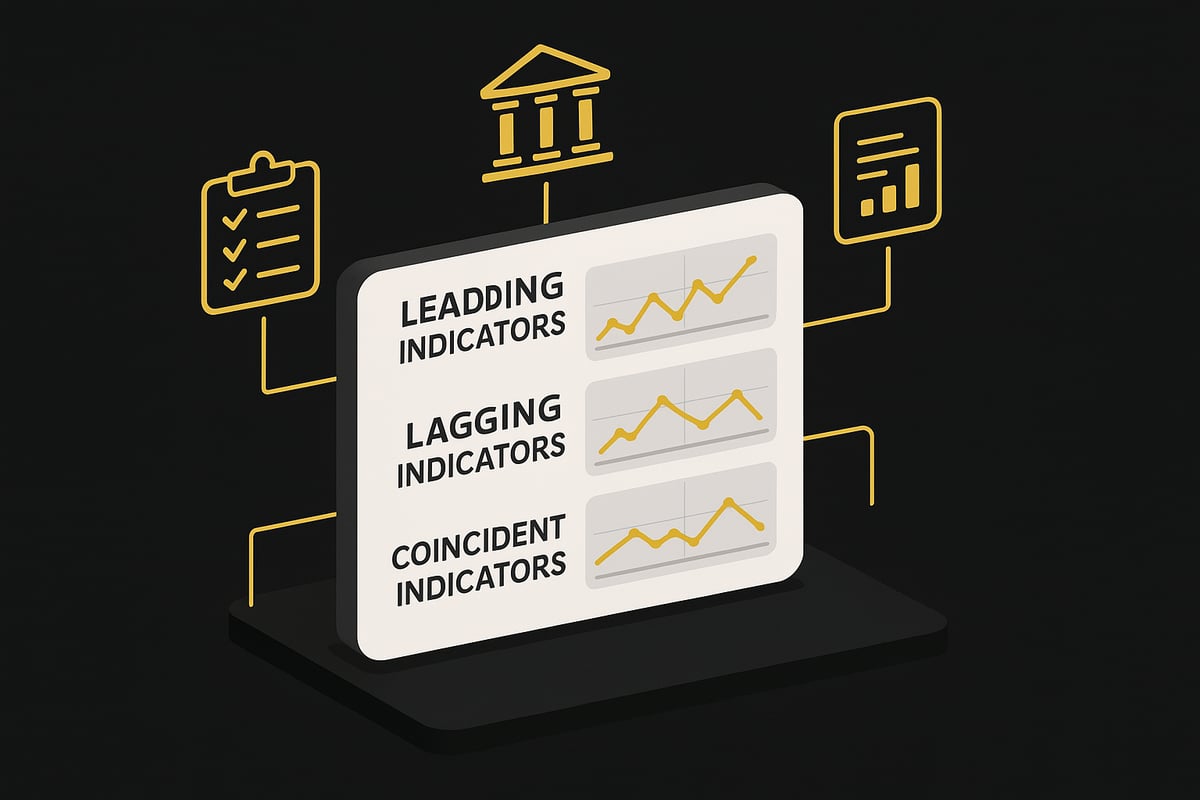
There are three primary categories:
- Leading indicators: These shift before the economy as a whole changes. They are used to forecast future trends.
- Lagging indicators: These confirm trends that have already started, validating forecasts and performance.
- Coincident indicators: These move in tandem with the current state of the economy, reflecting real-time conditions.
The combination of these types provides a comprehensive perspective. For instance, while a leading indicator like the Purchasing Managers' Index (PMI) might signal upcoming expansion, a lagging indicator such as the unemployment rate confirms whether that expansion materialized.
To better understand how these indicators work together, consider the following table:
| Type | Timing | Example | Use Case |
|---|---|---|---|
| Leading | Before trend | PMI, housing starts | Forecasting |
| Lagging | After trend | Unemployment rate | Performance validation |
| Coincident | With trend | GDP, industrial output | Real-time assessment |
If you want a deeper dive into how these indicators interact and impact economic analysis, the State of the Economy: Leading, Lagging, and Coincident Indicators report provides an excellent overview with current examples.
Ultimately, using lagging and leading indicators in tandem allows organizations to see the full economic picture, avoid blind spots, and build strategies that stand the test of time.
Leading Indicators: Anticipating Future Trends for Proactive Growth
In the fast-paced world of economic strategy, having a firm grasp on lagging and leading indicators can help organizations stay ahead of the curve. Leading indicators, in particular, serve as early signals of potential shifts in the business environment, giving business leaders a critical advantage. By focusing on these forward-looking measures, you can position your company or investments to anticipate and capitalize on change before it becomes mainstream.
What Are Leading Indicators and Why Do They Matter?
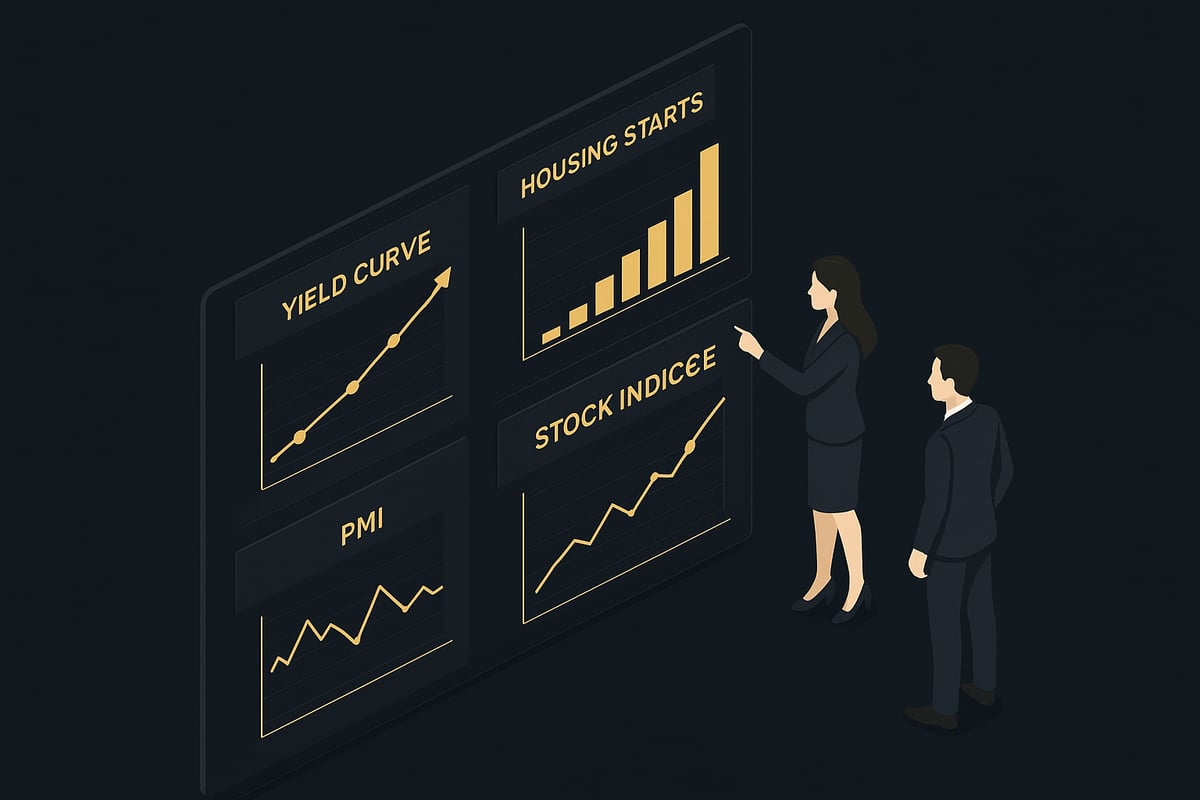
Leading indicators are statistics that tend to change before the overall economy or markets shift. They are essential for forecasting future trends, allowing you to make informed decisions ahead of the competition. Unlike lagging indicators, which confirm patterns after they have occurred, leading indicators offer a window into what may unfold next.
The value of lagging and leading indicators lies in their ability to shape business and investment strategy. For example, an inverted yield curve has historically preceded economic recessions, providing a timely warning for decision-makers. By monitoring such signals, you can adjust your strategy to minimize risk and seize opportunities before the broader market reacts.
Consider the role of lagging and leading indicators as an early warning system. These metrics help organizations anticipate economic upturns or downturns, facilitating proactive planning. This approach is particularly valuable in volatile markets, where rapid shifts can impact profitability and growth.
In summary, mastering lagging and leading indicators empowers you to act with confidence, using data to drive decisions rather than relying solely on intuition or hindsight.
Key Leading Indicators to Watch in 2026
As you look ahead to 2026, several leading indicators stand out as critical tools for anticipating economic shifts. Each indicator provides unique insights, and when combined, they offer a comprehensive view of potential market directions.
Table: Key Leading Indicators for 2026
| Indicator | What It Signals | Example |
|---|---|---|
| Yield Curve | Economic expansion or contraction | Inversion before recessions |
| Housing Starts | Builder confidence | Rise signals optimism |
| Purchasing Managers’ Index (PMI) | Manufacturing/service health | Score above 50 = growth |
| Money Supply | Liquidity and expansion | Growth precedes booms |
| Consumer Confidence | Spending trends | High confidence = growth |
| Stock Market Indices | Investor sentiment | Rises before recovery |
The yield curve is a widely watched signal. When short-term interest rates rise above long-term rates, it often points to a potential downturn. Housing starts are another useful indicator, as increases generally reflect optimism among builders and consumers alike. PMI readings, especially those above 50, suggest expansion in manufacturing and services.
Money supply growth aligns with increased economic activity, while contractions can warn of slowdowns. The Consumer Confidence Index provides a glimpse into future spending habits, and stock market indices often move in anticipation of broader economic trends.
For a deeper dive into how these indicators function in trading and investment, you can explore the Best Trading Indicators Explained for practical applications and further examples.
By tracking a combination of these measures, you leverage the strengths of lagging and leading indicators to form a robust market outlook.
Limitations and Reliability of Leading Indicators
No single indicator is infallible, which is why a balanced approach to lagging and leading indicators is essential. While leading indicators can provide early signals, they are not guarantees. Sometimes, even historically reliable signals such as an inverted yield curve may result in false alarms, as not every inversion leads to recession.
Experts often disagree on the reliability of specific indicators, and economic data can be revised after initial release. These revisions may affect your interpretation, so always use up-to-date information. Additionally, data lags and external factors, such as geopolitical events, can influence outcomes beyond what indicators might predict.
To reduce risk, best practice is to corroborate signals from multiple sources. Historical analysis of lagging and leading indicators can reveal patterns, but always consider the broader economic context. Avoid relying exclusively on one metric, and remember that economic forecasting is as much about managing uncertainty as it is about predicting outcomes.
In closing, integrating lagging and leading indicators with a thorough understanding of their strengths and weaknesses will position you for proactive, informed decision-making in 2026.
Lagging Indicators: Confirming Trends and Assessing Performance
Understanding lagging indicators is essential for anyone seeking to validate economic trends and assess performance with confidence. Unlike their forward-looking counterparts, lagging indicators follow shifts in the economy, confirming patterns that are already in motion. This retrospective view is crucial for organizations that need to measure the impact of past decisions and adjust their strategies accordingly.
Lagging indicators offer a sense of certainty when navigating volatile markets. They serve as vital benchmarks for evaluating economic health, company performance, and policy outcomes. By integrating lagging and leading indicators, business leaders and investors can build a more comprehensive understanding of the economic landscape.
What Are Lagging Indicators and Their Strategic Value?
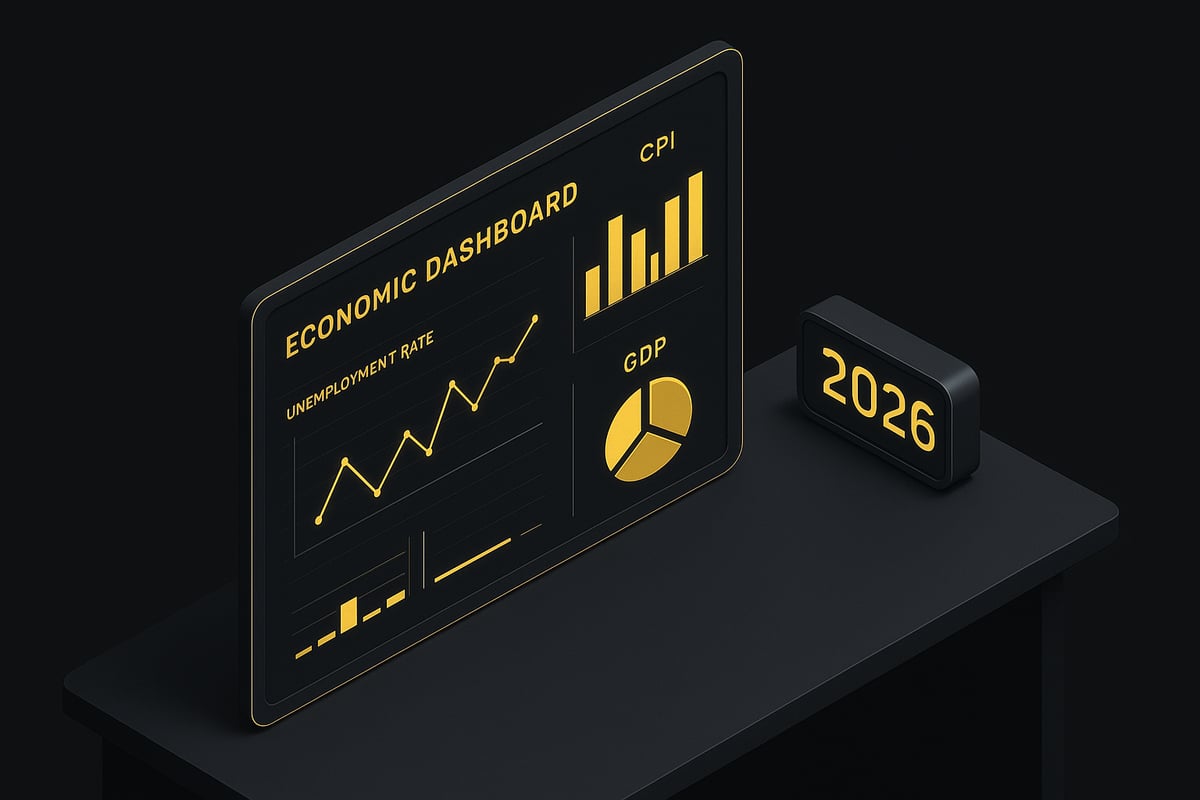
Lagging indicators are economic metrics that reflect changes only after broader trends have taken hold. They provide confirmation that a shift—such as a recession or recovery—has occurred. This makes them invaluable for assessing the effectiveness of past policies, investments, and strategic moves.
The strategic value of lagging indicators lies in their reliability. While leading indicators forecast potential changes, lagging indicators validate those predictions by showing what has actually happened. For example, the unemployment rate is a classic lagging indicator. After an economic downturn, unemployment typically rises, confirming what other data may have suggested weeks or months earlier.
Organizations that master lagging and leading indicators are better equipped to understand both the trajectory and the outcomes of economic cycles. By using lagging indicators to measure performance, companies can identify which strategies succeeded and which need adjustment.
Another key benefit is risk management. By monitoring lagging indicators, decision-makers can confirm that corrective actions are working or spot when further intervention is needed. Lagging and leading indicators together create a data-driven feedback loop, strengthening strategic planning.
Common Lagging Indicators for 2026 Analysis
Several lagging indicators will be particularly important for analyzing economic performance in 2026. Each provides a unique perspective on how the economy has responded to recent challenges and opportunities. Below is a summary of the most widely used lagging indicators:
| Indicator | What It Measures | Why It Matters for 2026 |
|---|---|---|
| Unemployment Rate | Joblessness after economic shifts | Confirms recessions or recoveries |
| Consumer Price Index (CPI) | Inflation after price changes | Reveals real-world cost pressures |
| Corporate Profits | Earnings reported after the fact | Validates business cycle predictions |
| Interest Rates | Adjustments responding to events | Reflects central bank reactions |
| GDP Growth Rates | Past economic output | Confirms overall economic performance |
| Balance of Trade | Export/import status after trends | Shows international competitiveness |
For example, during the 2020 recession, a spike in the unemployment rate confirmed that the downturn was already well underway. In 2026, close attention to these indicators will help analysts and leaders confirm whether anticipated trends have materialized.
In trading and investment, lagging and leading indicators are often used together for comprehensive analysis. For those interested in practical applications, the Technical Indicators for Day Trading guide offers insights into integrating economic data with technical tools to validate market moves.
Insights and Limitations of Lagging Indicators
Lagging indicators excel at confirming trends and providing benchmarks for performance analysis. They are especially valuable for historical evaluation and post-event reporting. Organizations that rely on lagging and leading indicators in tandem can adapt more effectively as they move from prediction to validation.
However, there are limitations to consider. Lagging indicators are not designed for forecasting. Relying solely on them can delay strategic adjustments, potentially causing missed opportunities or late responses to market changes. They also may be affected by data revisions, and sometimes, methodological changes can alter their interpretation.
To get the most value, combine lagging and leading indicators for a balanced approach. This ensures you are not just reacting to the past but also preparing for the future. Companies that regularly review both types of indicators are more agile and resilient, positioning themselves for sustained success in 2026 and beyond.
Integrating Leading and Lagging Indicators for 2026 Success
In today’s volatile markets, relying on a single metric rarely provides the clarity needed for strategic success. Instead, integrating lagging and leading indicators gives organizations a multidimensional view of economic shifts. This approach enables leaders to anticipate changes, confirm trends, and make more confident decisions. Let’s explore how to build a holistic strategy, apply these indicators in practice, leverage advanced tools, and see how AI trading solutions like PipTrend can strengthen your indicator-based approach.
Building a Holistic Strategy with Indicators
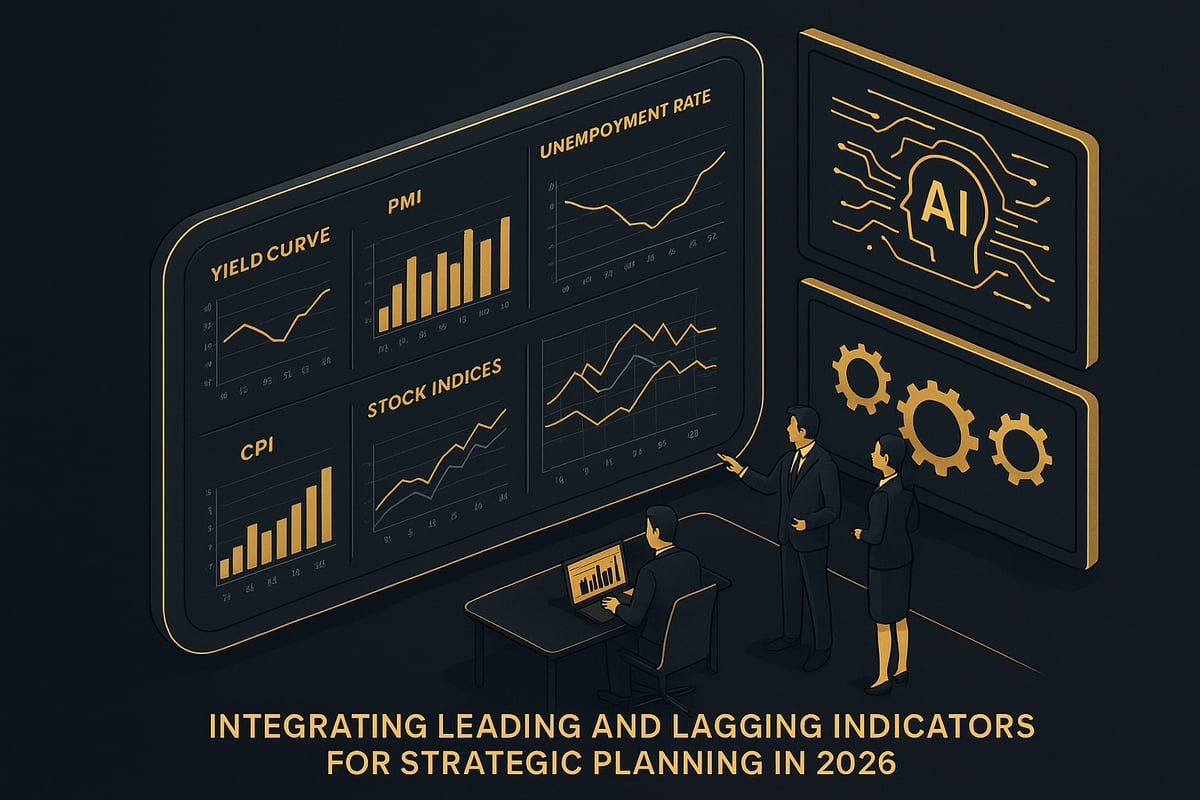
A robust strategy in 2026 demands more than tracking isolated data points. By combining lagging and leading indicators, you can achieve both foresight and validation. This dual approach helps you not only predict potential economic turns but also confirm their impact as events unfold.
For example, imagine using the Purchasing Managers’ Index (PMI) as a leading indicator to anticipate industry momentum. Pairing this with the unemployment rate as a lagging indicator allows you to time market entry or exit with greater precision. This synergy strengthens scenario planning and risk management.
A recent study highlights the value of integrating macroeconomic and technical indicators for more accurate stock market forecasting. By combining diverse data, organizations can reduce blind spots and build resilience against sudden market shocks. The key is to treat lagging and leading indicators as complementary, not competing, sources of insight.
Step-by-Step Guide to Applying Indicators in Business and Investment
Applying lagging and leading indicators effectively starts with a systematic process. Here’s a step-by-step guide to embed indicator-driven thinking into your operations:
- Identify Relevant Indicators: Start by selecting lagging and leading indicators that align with your industry and strategic priorities.
- Establish Monitoring Routines: Set up dashboards or automated alerts for real-time tracking.
- Analyze Historical Relationships: Study how indicator movements have historically aligned with business outcomes or market shifts.
- Develop Scenario Models: Use indicator trends to build best-case, base-case, and worst-case scenarios.
- Adjust Strategies Proactively: As leading indicators shift, prepare to pivot, then validate decisions as lagging indicators confirm trends.
- Review and Refine: Annually reassess your indicator set for relevance, accuracy, and impact.
Consider the following table for an at-a-glance view:
| Step | Focus | Example Indicator |
|---|---|---|
| 1 | Selection | PMI, Unemployment Rate |
| 2 | Monitoring | Automated Dashboards |
| 3 | Historical Analysis | Correlation Studies |
| 4 | Scenario Modeling | Growth, Stagnation, Recession |
| 5 | Proactive Adjustment | Inventory, Marketing, Hiring |
| 6 | Review & Refine | Annual KPI Assessment |
By following this workflow, you ensure lagging and leading indicators are woven into every strategic decision.
Tools and Technologies for Indicator Analysis
Modern technology has revolutionized how organizations interact with lagging and leading indicators. Digital platforms, AI-powered analytics, and customizable dashboards now enable real-time tracking and deeper insights without manual effort.
AI tools can scan massive datasets, detect subtle patterns, and send instant alerts when indicator thresholds are crossed. Automation reduces the risk of human error and accelerates response times. For instance, traders and executives can use platforms that aggregate PMI, yield curves, and CPI data, providing a comprehensive view at a glance.
Look for features such as:
- Multi-source integration for both lagging and leading indicators
- Customizable visualizations for scenario analysis
- Automated alerts for rapid strategy shifts
These technologies empower teams to act swiftly, leveraging both predictive and confirmatory data. As economic environments evolve, the ability to synthesize multiple indicators will be a defining competitive edge.
How AI Trading Indicators Like PipTrend Enhance Market Analysis
AI trading solutions like PipTrend are transforming how investors and analysts use lagging and leading indicators. PipTrend leverages artificial intelligence to deliver real-time buy and sell signals, drawing from multi-timeframe analysis and smart money concepts.
By combining instant alerts with traditional economic data, PipTrend enables users to respond quickly to both early signals and confirmed trends. For example, a trader might use a rising PMI to spot a potential uptrend, then rely on PipTrend’s signals and lagging indicators to fine-tune entry and exit points in forex or stock markets.
The platform’s integration of AI reduces guesswork and simplifies decision-making. Users can confidently align their strategies with the most relevant lagging and leading indicators, maximizing opportunities while minimizing risk. PipTrend demonstrates how next-generation tools make it possible to translate economic signals into actionable, profitable moves.
Common Mistakes and Misinterpretations When Using Indicators
Navigating the world of lagging and leading indicators can be rewarding, but it is also full of traps that can trip up even experienced professionals. Understanding these common mistakes is crucial for anyone aiming to make informed decisions in 2026.
Pitfalls in Relying on Indicators
One of the most frequent mistakes is overreliance on a single indicator or data source. Many professionals assume that one strong signal from lagging and leading indicators can dictate strategy, but this often results in missed warning signs or false confidence. For example, treating a temporary dip in the Purchasing Managers’ Index as a long-term downturn can lead to hasty decisions.
Another pitfall is confusing correlation with causation. Just because two lagging and leading indicators move together does not mean one causes the other. Ignoring this can produce flawed assumptions and costly errors. Additionally, some individuals overlook the broader economic context or unique market conditions, interpreting indicators in isolation.
Failing to update indicator sets as the economy evolves is also a significant issue. Economic landscapes shift, and what was once a reliable signal may become obsolete. This is why understanding the methodology behind indicators is essential. For those interested in advanced approaches to economic forecasting, consider reviewing Methodological Insights into Structural Causal Modelling and Uncertainty-Aware Forecasting for Economic Indicators, which highlights the importance of robust analysis.
Common pitfalls include:
- Relying solely on one lagging and leading indicators report.
- Misinterpreting short-term changes as long-term trends.
- Overlooking external shocks or policy changes.
- Using outdated or irrelevant metrics.
Recognizing these errors is the first step toward mastering lagging and leading indicators for reliable decision-making.
How to Avoid Costly Errors
To steer clear of these pitfalls, it is vital to always corroborate signals with multiple lagging and leading indicators. Relying on a balanced set of data points increases confidence and reduces the risk of acting on false alarms. Regularly reviewing the methodology behind each indicator can also help you spot potential weaknesses or changes in data collection.
Staying updated on revisions and methodological shifts is key, as data sources can change over time. Maintain flexibility in your approach and be ready to adjust strategies as new information emerges. This agile mindset allows organizations to respond quickly to both risks and opportunities.
Seeking expert analysis or leveraging advanced tools can provide deeper insights into lagging and leading indicators. For those beginning to explore these concepts, the Trading for Beginners Guide offers foundational knowledge to build a solid base for analysis.
Consider this table summarizing common mistakes and how to address them:
| Mistake | How to Avoid |
|---|---|
| Overreliance on one indicator | Use a diverse set of lagging and leading indicators |
| Misreading correlations | Analyze causal relationships, not just trends |
| Ignoring context | Factor in economic environment and policy changes |
| Outdated indicator sets | Update regularly and review methodology |
Organizations that have mastered lagging and leading indicators consistently outperform those who rely on guesswork or outdated habits. By maintaining vigilance, using diverse data, and continuously educating your team, you can turn indicators into a strategic advantage.
Actionable Steps to Leverage Indicators for 2026 Success
Creating an Indicator-Driven Action Plan
Building a robust strategy with lagging and leading indicators starts by defining clear business or investment goals for 2026. Next, select a balanced set of indicators tailored to your objectives. Consider both industry-specific and macroeconomic measures to ensure a comprehensive perspective.
Establish key performance indicators (KPIs) and thresholds for decision-making. This approach turns lagging and leading indicators into actionable triggers rather than static data points. For instance, a sudden shift in consumer confidence or a notable change in unemployment could signal the need for immediate strategy adjustments.
Integrate indicator monitoring into regular meetings and reports. Automate data collection where possible using AI tools. Platforms highlighted in resources like AI Trading and Indicator Insights can help streamline this process, providing real-time analysis and reducing manual errors.
Train your team to interpret and act on these insights effectively. Encourage ongoing education on how lagging and leading indicators impact your market and operations. Finally, review outcomes regularly, refining your approach to stay ahead of economic shifts.
Sample Action Plan Table:
| Step | Action | Example Indicator |
|---|---|---|
| Goal Setting | Define 2026 objectives | Revenue, market share |
| Indicator Mix | Select leading and lagging indicators | PMI, unemployment rate |
| KPIs | Set thresholds for action | PMI < 50, CPI > 3% |
| Monitoring | Schedule regular reviews | Monthly dashboard |
| Training | Upskill teams | Workshops, briefings |
| Refinement | Adjust plan based on results | Quarterly reviews |
Maximizing Competitive Advantage Through Indicator Mastery
Organizations that master lagging and leading indicators consistently outperform their peers, especially during periods of volatility. Proactive use of these indicators opens doors to early opportunities and sharpens risk management.
Leadership plays a crucial role in fostering a data-driven culture. Encourage decision-makers to act swiftly in response to indicator signals, rather than waiting for trends to fully unfold. For example, companies that responded quickly to a dip in the Leading Economic Index during 2024 were able to adjust strategies and mitigate losses, as reported in Leading Economic Index Fell 1.3% Over 2nd Half of 2024.
Build agility by integrating indicator analysis into every level of planning. Use scenario modeling to anticipate how shifts in lagging and leading indicators could impact your business. This approach helps teams align marketing, production, and finance with real-time economic signals.
Remember, continuous learning is essential. As the economy evolves, so should your indicator set and response strategies. Organizations that prioritize mastery of lagging and leading indicators will be best positioned to seize growth opportunities and weather uncertainty in 2026.
As you’ve seen, combining lagging and leading indicators is essential for navigating the fast-changing markets of 2026 with confidence. If you’re ready to put these insights into action and want a clear edge in your trading decisions, PipTrend’s AI-powered platform gives you real-time buy and sell signals across forex, crypto, stocks, and indices. It’s all about making your strategy more informed and less stressful, so you can focus on what matters—consistent results. You deserve smarter trading tools that work as hard as you do. See Your Trading Improve With PipTrend