On this page
AI Trading Isn’t One Thing, and That’s the Problem
Ask ten traders what “AI trading” means and you’ll get ten answers. One is pasting chart screenshots into ChatGPT. Another is running a neural network on five years of tick data. A third bought a Telegram bot that promises 94% win rates.
All three call it AI trading. None of them are doing the same thing.
That confusion is expensive. A language model summarising an earnings call and a reinforcement learning agent sizing positions in real time share almost nothing in common: different inputs, different failure modes, different ways of losing your money. Lumping them together makes it impossible to judge risk.
This guide fixes that. You’ll learn the five distinct technologies hiding behind the label, how a real AI trading pipeline moves from raw data to a placed order, why a system that predicts direction correctly 68% of the time can still bleed capital, and a staged testing process you can run on any tool before it touches real money.
One position stated upfront, because everything else follows from it: AI is excellent at generating and filtering ideas. It is not a substitute for validation, risk management, or your final decision. The best setups in 2026 are human-in-the-loop trading systems, where the machine narrows the field and the trader still pulls the trigger with a defined stop.
What People Mean by AI Trading
“AI trading” is an umbrella term stretched over at least five separate technologies. They have wildly different risk profiles, and mistaking one for another is how people end up handing account credentials to a script they don’t understand.
Before splitting them apart, one common question deserves a direct answer: is AI trading the same as algorithmic trading?
No. They overlap, but neither contains the other.
Algorithmic trading means trades are executed by code following rules. Those rules can be embarrassingly simple: buy when the 50-day moving average crosses above the 200-day. That’s algorithmic. There’s no machine learning anywhere in it. Institutional execution algorithms that slice a large order into small pieces to reduce market impact are algorithmic too, and most contain zero AI.
Meanwhile, plenty of AI tools never place an order at all. A model that scores sentiment across 4,000 news headlines and hands you a ranked watchlist is AI. It’s not automated trading. You still have to decide, size, and execute.
Algorithmic trading describes who executes. AI describes how the decision is made. A tool can be one, both, or neither.
AI Assistants and Prediction Models
AI assistants are large language models applied to market work: summarising a 60-page 10-K, explaining why copper moved, drafting a trade thesis, or converting your strategy description into testable code. They run on natural language processing and they’re genuinely useful for research speed.
Their weakness is structural. A language model has no live price feed unless one is wired in, no concept of your account size, and a well-documented tendency to produce confident, fluent, completely fabricated numbers. Treat their output as a research draft, never as a signal.
Prediction models are a different animal. These are supervised machine learning systems, often gradient-boosted trees or deep learning networks, trained on historical data to forecast something specific: the probability that price closes higher in four hours, or that volatility expands tomorrow.
They output probabilities, not certainties. A well-built model might say “62% chance of an upward close.” That’s a genuine edge if your risk-reward ratio supports it, and worthless if it doesn’t. More on that later, because it’s where most retail AI systems quietly fail.
Signal Systems and Autonomous Agents
Signal systems sit between the two. They combine technical indicators, pattern recognition, and sometimes a machine learning layer to flag setups: an entry zone, a stop level, a target. The output is a suggestion on your chart, and you approve or reject it.
This is the most practical category for most retail traders, because the reasoning is inspectable. If a signal fires at a marked support level with a stated invalidation point, you can evaluate it on its merits.
The fifth category is autonomous agents: bots with API access that analyse, decide, size, and execute without asking. Some use reinforcement learning, where the agent learns a policy by being rewarded for profitable sequences of actions rather than by predicting a single label.
Autonomy is where risk concentrates. An agent that misreads a low-liquidity session can open twelve correlated positions before you finish your coffee. Any autonomous system needs hard external limits: maximum position sizing, daily loss caps, and a kill switch you can hit from your phone.
How AI Trading Systems Actually Work
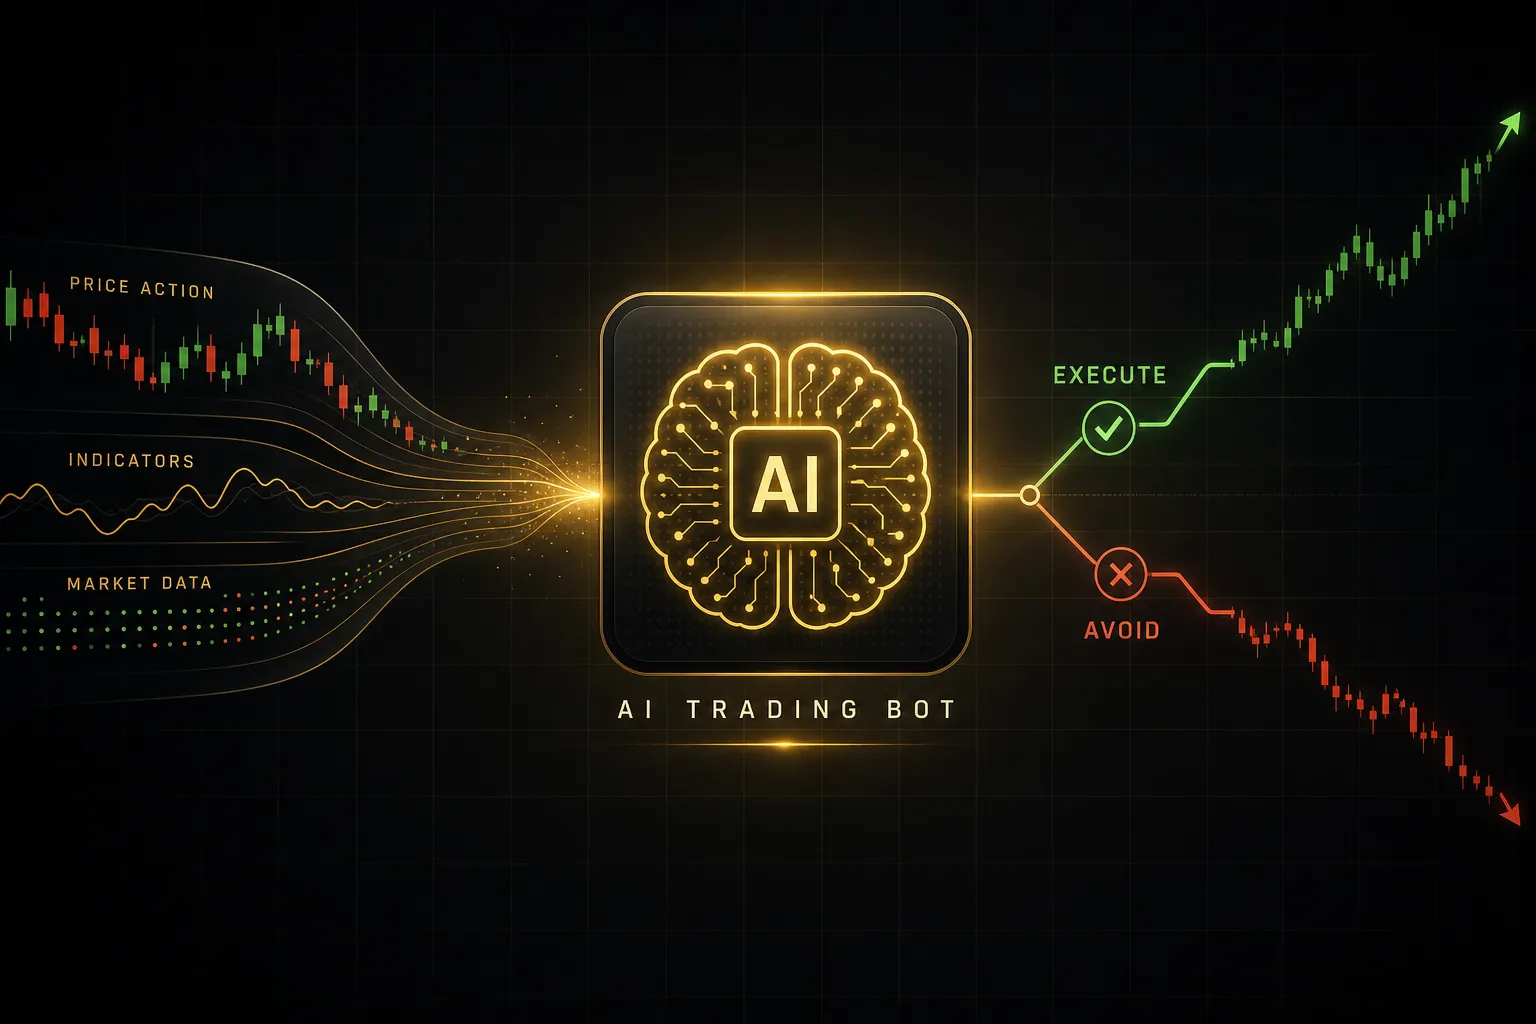
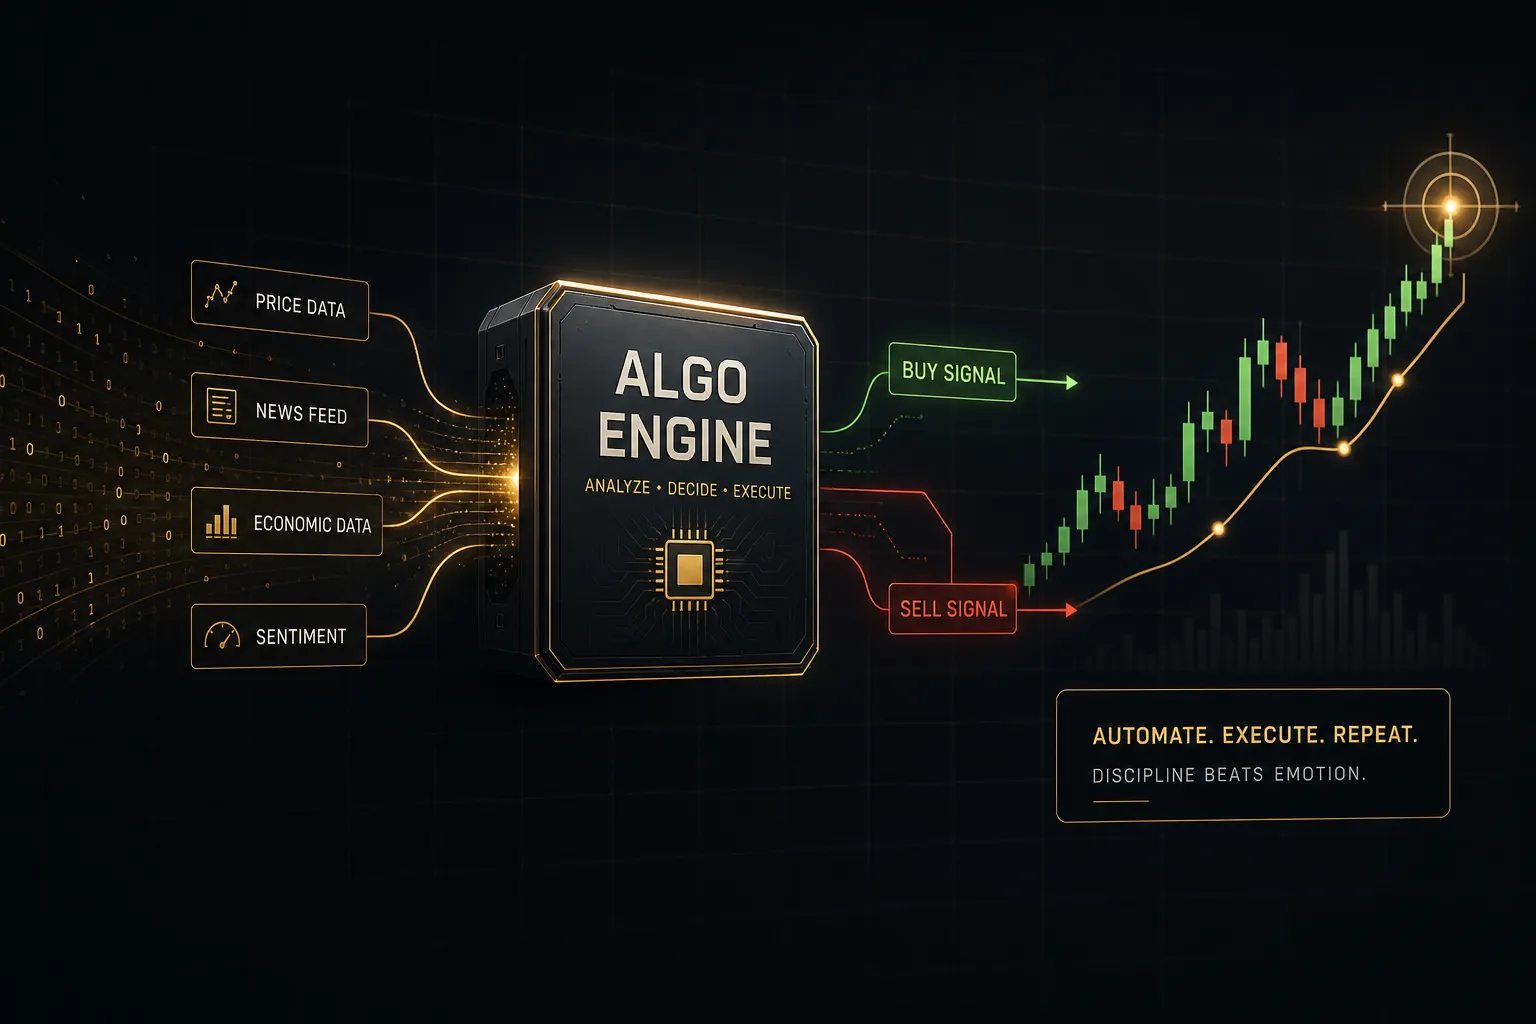
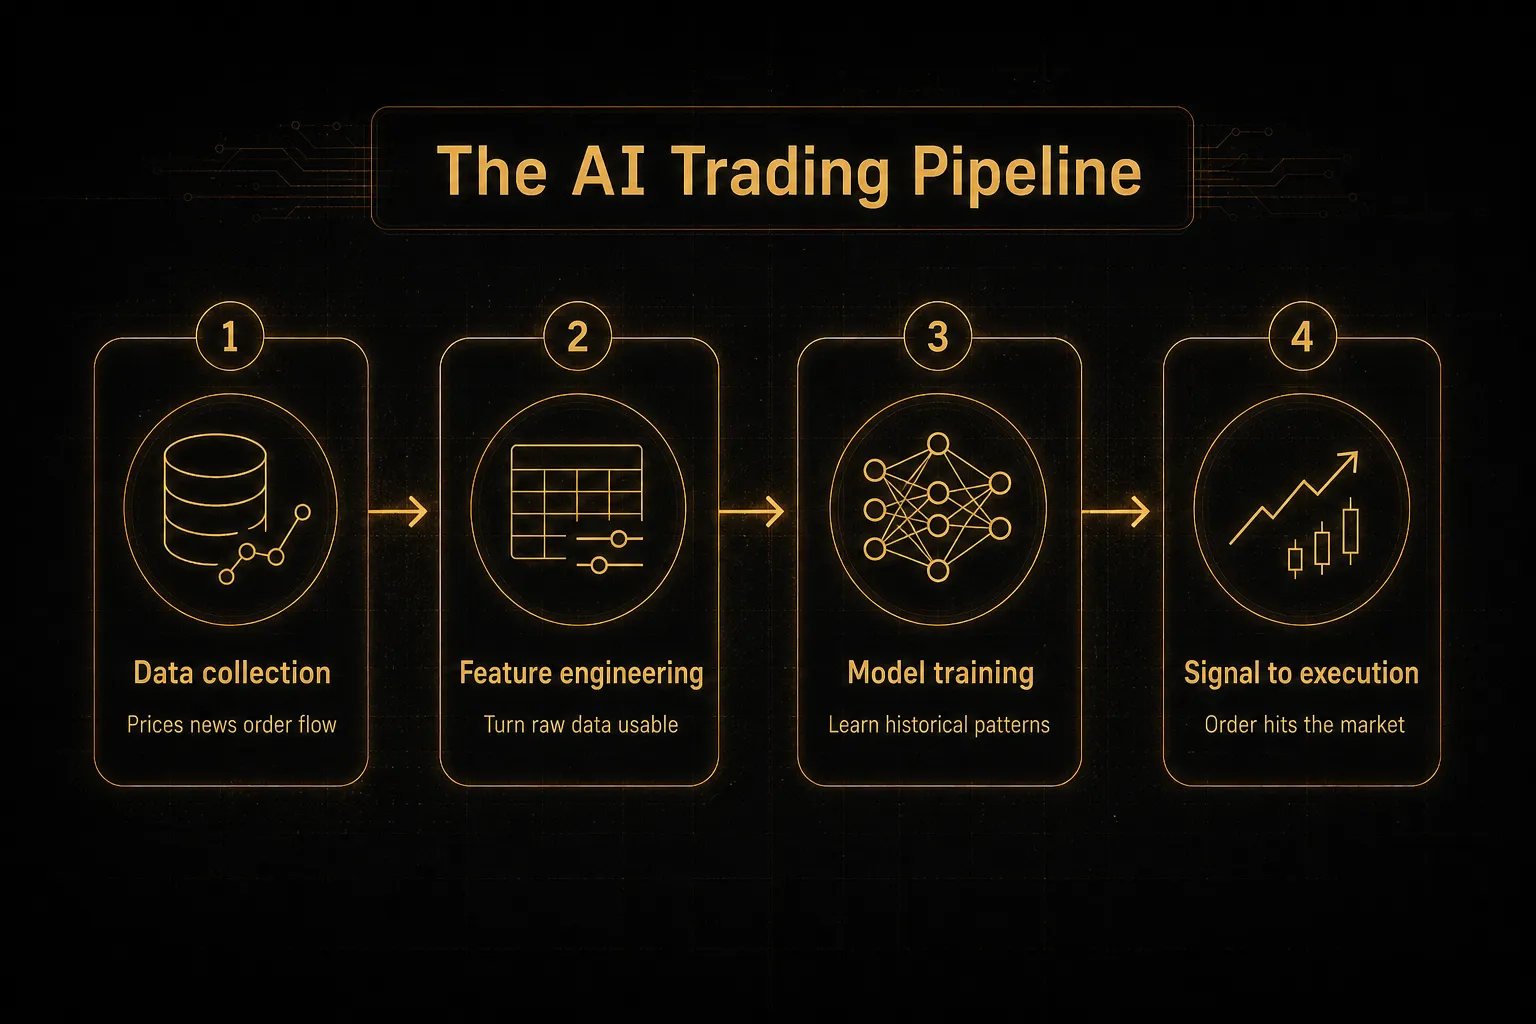
Every legitimate AI trading system, from a hedge fund’s execution stack to a $49-per-month signal service, follows the same four-stage pipeline: data in, features built, model trained, signal executed.
Learn the pipeline and you gain a diagnostic tool. When a vendor can’t tell you what data trained their model or how often it retrains, you’ve learned something important about the product.
The Data It Learns From
Price and volume are the foundation: open, high, low, close, and traded volume across whatever timeframe the model targets. Institutional systems add order book depth, bid-ask spread history, and tick-level trade prints.
Beyond price sits alternative data. News sentiment scored by NLP. Central bank statement tone. Options positioning and implied volatility surfaces. Macro releases like CPI and payrolls. For equities, earnings transcripts, insider filings, and analyst revisions.
Raw data alone teaches a model very little. Feature engineering is the step where humans convert it into something learnable: a 14-period RSI, distance from the 200-day average in ATR units, relative volume versus the 20-day mean, hours until the next scheduled data release.
Feature quality separates working models from expensive noise generators. Give a model 400 loosely related inputs and 3,000 rows of data, and it will find patterns that exist only in that specific sample. Which brings us to the training stage.
Training and Retraining the Model
Training means showing the model historical examples with known outcomes, letting it adjust internal parameters to reduce prediction error, and then checking performance on data it has never seen. That last part is out-of-sample testing, and it’s non-negotiable.
Two failures dominate this stage. The first is model overfitting: the system memorises historical noise instead of learning a repeatable relationship. Symptoms are unmistakable. Spectacular in-sample results, mediocre or negative out-of-sample results.
The second is data leakage, and it’s subtler because it produces results that look legitimate. Leakage happens when information from the future contaminates the training set. Normalising an entire dataset before splitting it leaks future volatility into past rows. Using a revised economic figure that wasn’t published until three weeks after the trade date leaks the actual outcome.
Leakage is the single most common reason a “validated” model collapses in live trading. It doesn’t announce itself. It just quietly inflates every metric you rely on.
The defence is walk-forward analysis. Train on January through June, test on July. Roll forward: train through July, test on August. Repeat across years. You end up with a chain of honest out-of-sample results that reflects how the model would actually have been used, including periodic retraining as new data arrived.
From Signal to Execution
A model output is not a trade. Signal generation converts a raw probability into an actionable instruction through a layer of rules: a confidence threshold, a direction, an entry trigger, a stop-loss, and a target.
Then comes sizing, and this is where the money is actually made or lost. Position size is a function of account equity, stop distance, and per-trade risk tolerance. Fixed sizing on a variable-volatility instrument is how accounts blow up during regime shifts.
Finally, execution. The order routes to a broker or exchange, and reality applies a tax. Between decision and fill you face latency, spread, and slippage. On a liquid pair in London hours that tax is small. On a thin altcoin during a news spike it can exceed the entire expected edge of the trade.
Why Accurate Predictions Can Still Lose Money
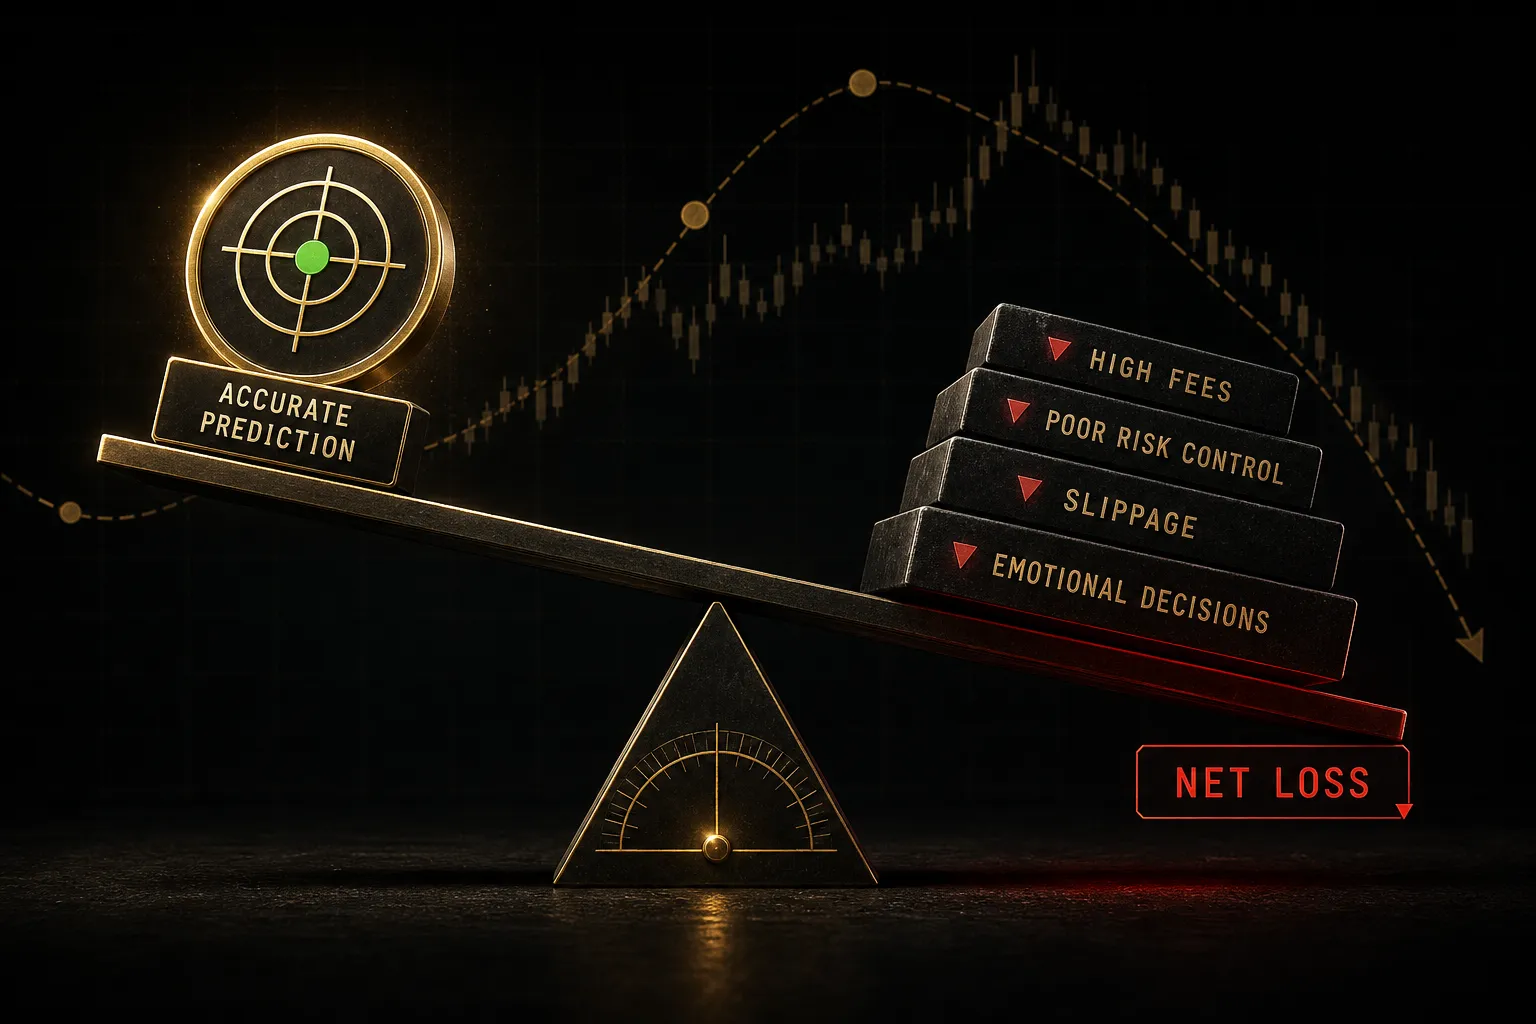
Here’s the number that should reset your expectations: a system that predicts market direction correctly 70% of the time can lose money consistently. Not occasionally. Structurally.
Accuracy is not profitability. The bridge between them is expectancy:
Expectancy = (Win rate × Average win) − (Loss rate × Average loss)
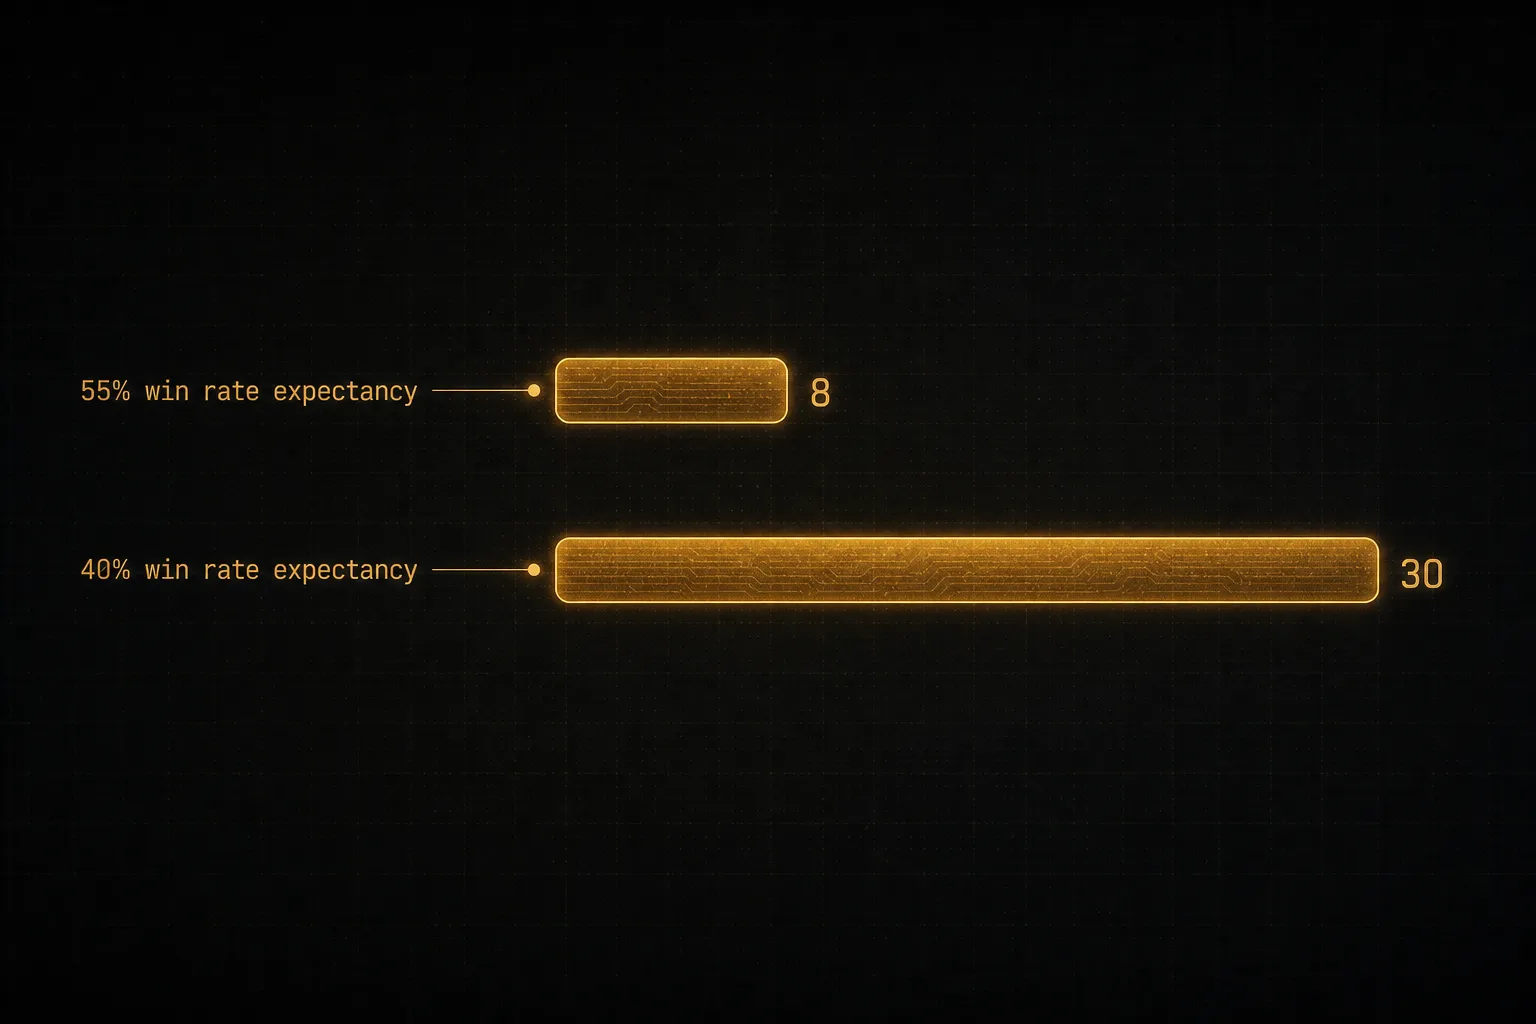
Run a 70% accurate system where wins average $50 and losses average $130. Expectancy is (0.70 × 50) − (0.30 × 130) = 35 − 39 = negative $4 per trade. Over 500 trades that’s a $2,000 loss from a system that was right seven times out of ten.
The mechanism is simple and it’s everywhere in retail AI products. Tight targets and wide stops manufacture high win rates. The equity curve climbs pleasantly, then a handful of full-stop losses erase two months of gains.
Now flip it. A 40% win rate with wins averaging $150 and losses averaging $50 gives (0.40 × 150) − (0.60 × 50) = 60 − 30 = positive $30 per trade.
Lower accuracy, profitable system. This is why profit factor (gross profit divided by gross loss), maximum drawdown, and Sharpe ratio tell you far more than any win-rate headline.
The Real Cost of Every Trade
Vendor backtests are usually run on a frictionless market that does not exist. Real trading has four separate costs, and together they turn marginal edges into losses.
- Spread. The gap between bid and ask, paid on entry and exit. A 1.2-pip spread on EUR/USD is negligible for a swing trade and fatal for a scalper targeting 4 pips.
- Commission. Per-lot or per-share fees. Small individually, brutal at 40 trades per day.
- Slippage. The difference between expected and actual fill price. Widens sharply around economic releases, market opens, and in thin liquidity. This is the cost backtests most often ignore entirely.
- Swap and financing. Overnight interest on leveraged positions. A carry cost that can quietly consume 100% of a small edge on multi-day holds.
- Execution latency. The milliseconds between signal and fill. Irrelevant for daily strategies, decisive for anything intraday and fast.
Take a strategy showing an average gross gain of 9 pips per trade. Subtract a 1.5-pip spread, 0.8 pips of average slippage, and commission worth 0.7 pips. Net edge: 6 pips. Still viable. Now subtract those same 3 pips from a strategy averaging 4 pips gross and you have a losing system with an attractive backtest.
The Backtest Illusion
A backtest is a hypothesis, not evidence. And it’s trivially easy to make a bad strategy look brilliant on historical data.
Run this checklist against any AI trading result before you believe it:
- Was there genuine out-of-sample data? If the strategy was tuned on the same period it was tested on, the result means nothing. Demand walk-forward results across at least three years.
- Are costs included? Look for explicitly stated spread, commission, and slippage assumptions. “Excluding fees” is a red flag, not a footnote.
- How many trades? Below roughly 100 trades, results are noise. A 30-trade backtest with a 2.4 profit factor proves nothing.
- How many parameters were optimised? Every tuned variable increases overfitting risk. Six or more optimised parameters on a few thousand data points should trigger scepticism.
- What was the maximum drawdown and its duration? A 34% drawdown lasting seven months is unlivable for most traders regardless of the final return.
- Does the equity curve look too smooth? Real strategies have flat and ugly stretches. A near-straight line usually means leakage or curve-fitting.
- Were entries and exits realistic? Fills at the exact low of a bar, or exits at the precise high, indicate a simulation using information it couldn’t have had in real time.
When Markets Change: Model Drift
Even an honestly validated model degrades. Markets aren’t stationary. The relationships a model learned from 2019 through 2022 were shaped by a specific volatility regime, a specific interest rate environment, and a specific set of dominant participants.
Model drift is the gradual decay of predictive power as those conditions shift. A mean-reversion model trained in a low-volatility range gets destroyed by a trending, high-volatility regime. It hasn’t broken. The world simply changed underneath it.
Watch for drift the way you’d watch a warning light: rolling 50-trade win rate falling below its backtested range, average win shrinking while average loss holds steady, or a drawdown exceeding the historical maximum by more than 30%. Any of those three means pause and re-validate, not add capital.
A Safer Way to Test AI Trading Signals
The process below works on anything: an ML model, a Telegram signal group, an indicator suite, an LLM-generated strategy. It’s deliberately slow. Slow is the point, because the cost of being wrong at stage four is far higher than the cost of a few extra weeks at stage two.
From Backtest to Live: A Staged Process
- Define the rules in writing first. Entry condition, stop placement, target, maximum risk per trade, and what invalidates the setup. If a tool’s logic can’t be written down in five lines, you cannot test it, and you cannot know why it fails.
- Run a cost-inclusive backtest. Minimum 100 trades across at least two different market regimes, with your broker’s real spread and a conservative slippage assumption. Record expectancy, profit factor, maximum drawdown, and longest losing streak.
- Walk it forward. Train or optimise on one window, test on the next untouched window, roll, repeat. If performance halves out-of-sample, you found overfitting, not a strategy.
- Paper trade for 30 to 60 days. Paper trading catches what backtests can’t: ambiguous signals, timezone errors, missed alerts, and your own hesitation. Log every trade including the ones you skipped.
- Go live at 25% of intended size. Real money changes behaviour and reveals true slippage. Run a minimum of 40 trades at reduced size before touching the allocation.
- Scale only on evidence. Increase size only if live expectancy sits within roughly 70% of the paper-traded figure. If it doesn’t, the gap is your real edge estimate.
- Review monthly against a kill rule. Set the abandonment condition before you start: for example, stop if drawdown exceeds 1.5× the backtested maximum. Decide this while you’re calm.
Most people skip stages four and five. Those are precisely the stages that convert a plausible backtest into a validated system.
Confirm AI Signals With Market Structure
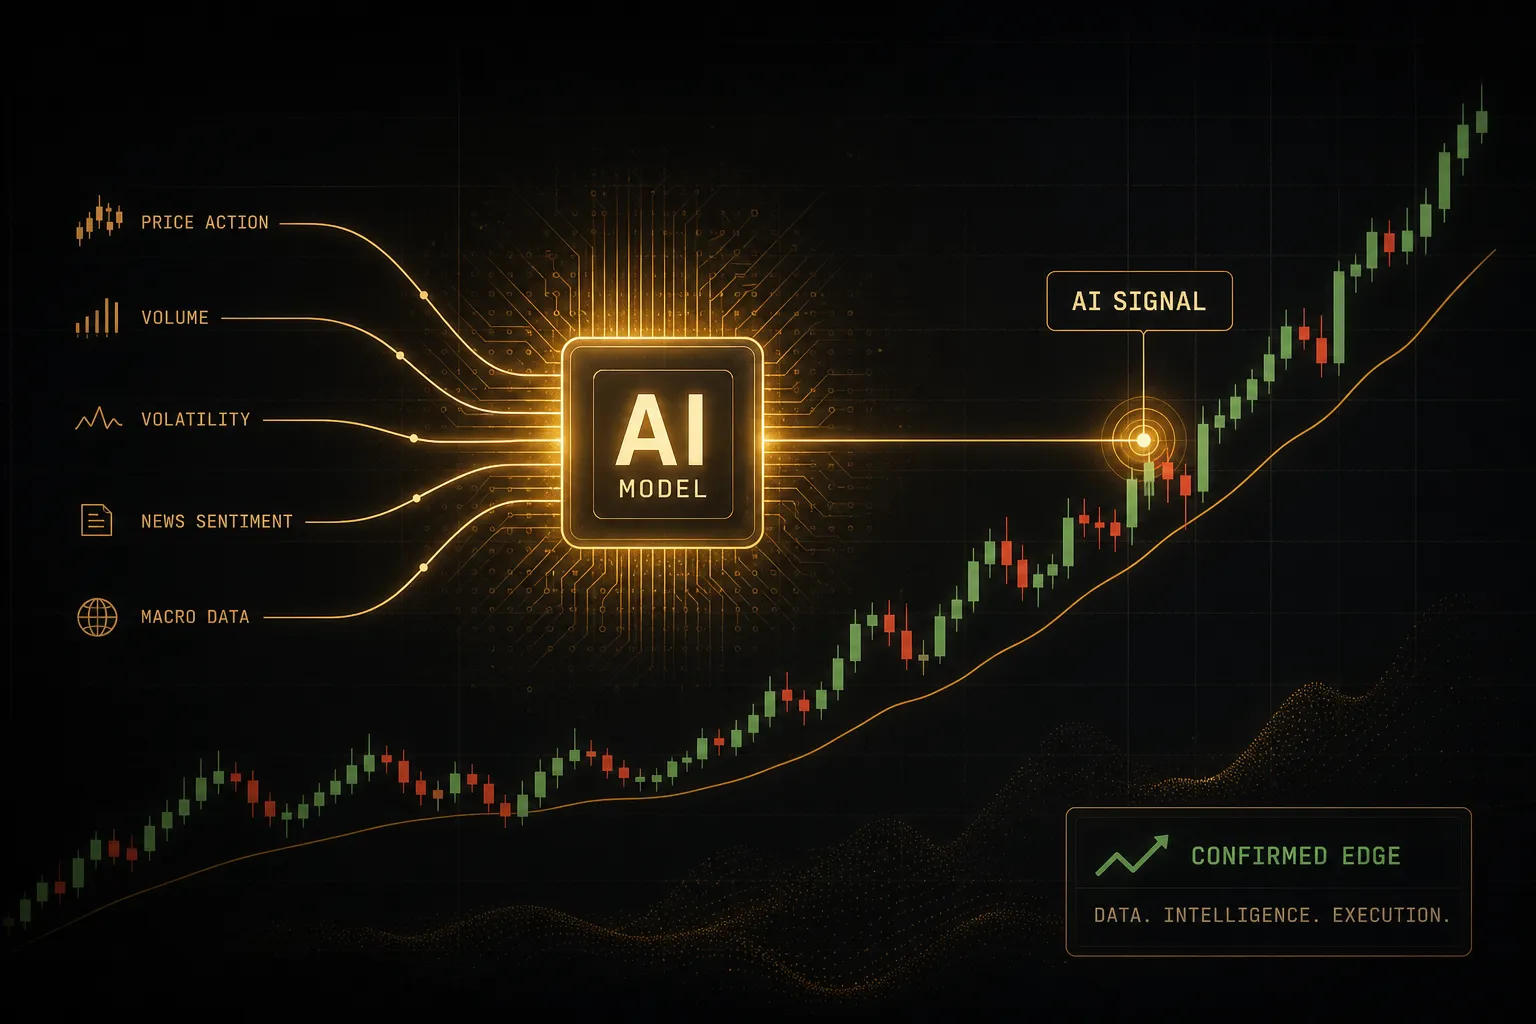
An AI signal gains enormous value when it agrees with something visible on the chart, and loses most of it when it doesn’t.
Market structure means the readable skeleton of price: swing highs and lows, tested support and resistance, trend direction on the higher timeframe, liquidity zones, and session ranges. It’s the context an isolated probability score has no access to.
A practical filter, three questions per signal:
- Is there a nearby level that invalidates it? A long signal directly beneath a resistance zone tested three times has poor odds regardless of model confidence. A long above reclaimed support has a defined risk point.
- Does the higher timeframe agree? A 15-minute buy signal inside a clean daily downtrend is a counter-trend trade. Take it if you want, but size it as one.
- Where does the stop go, and does the maths still work? Place the stop where the idea is objectively wrong, measure the distance, then check whether the target still delivers acceptable risk-reward. If the stop must sit 90 pips away for a 40-pip target, the signal fails before you enter.
The strongest use of AI in 2026 isn’t replacing chart reading. It’s scanning 500 instruments in seconds to find the 6 worth reading.
Red Flags of a Fake AI Platform
The AI label sells, so plenty of products wear it without earning it. These signs reliably separate marketing from technology.
| Red Flag | What It Usually Means | What Legitimate Looks Like |
|---|---|---|
| ”94% win rate” headline | Wide stops, tight targets, or cherry-picked results | Win rate published alongside expectancy, profit factor, and maximum drawdown |
| ”Guaranteed” or “risk-free” returns | Marketing that ignores how markets work; often a regulatory violation | Explicit risk disclosure and stated drawdown expectations |
| No explanation of the model or data | Rebranded moving-average crossover, or nothing at all | Stated approach, input data types, and retraining frequency |
| Screenshot-only track record | Unverifiable, trivially edited demo results | Third-party verified statements or timestamped published trades |
| Requires deposit through their own link | Affiliate-driven revenue, not performance-driven | Broker-agnostic, works with your existing account |
| Urgency pressure and closing-soon countdowns | Funnel tactics aimed at bypassing due diligence | Free trial or demo access with no time pressure |
| No stop-loss in the signal output | No risk framework, therefore no testable system | Every signal ships with entry stop and target |
One more test, and it’s the fastest. Ask support a specific technical question: what data trains the model, how often does it retrain, and what were the out-of-sample results. A real team answers in a paragraph. A fake one sends a testimonial.
AI Trading FAQ
Is AI trading really profitable?
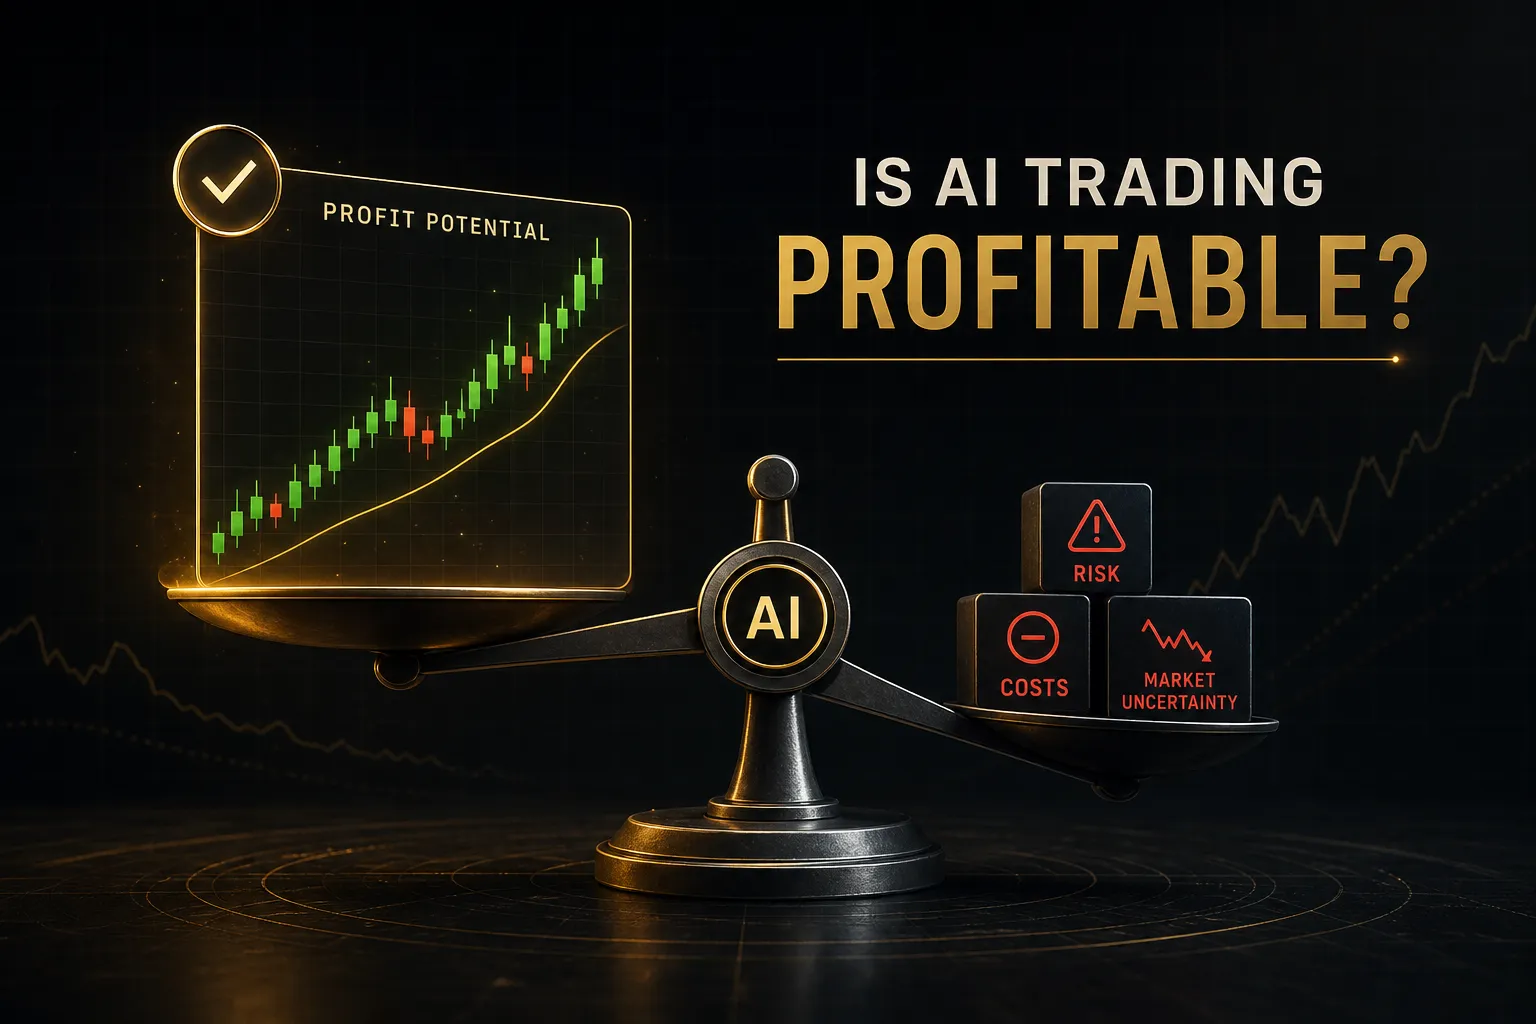
It can be, but profitability comes from expectancy and risk management, not from the AI itself. As shown earlier, a 70% accurate system with a poor risk-reward ratio loses money while a 40% accurate system with favourable asymmetry makes it. AI improves the speed and breadth of your analysis. Position sizing, cost control, and discipline determine the result.
Can AI predict the stock market?
AI can estimate probabilities, not predict outcomes. A good model might identify a 60-65% chance of directional movement over a specific horizon, which is a real edge when paired with correct sizing. What no model handles well is the unscheduled shock: a surprise policy decision, a geopolitical event, or a liquidity crisis. Anything claiming reliable prediction is selling certainty that doesn’t exist.
What is the best AI for trading?
There is no single best tool, because the categories serve different jobs. Language models are strongest for research, summarising filings, and drafting or debugging strategy code. Machine learning prediction models suit systematic traders with clean data and validation capability. Indicator-based signal platforms with published, verifiable results suit discretionary traders who want AI-assisted setups they can still inspect and confirm against market structure.
Are AI trading bots safe?
Bots are only as safe as the limits wrapped around them. The core risks are unsupervised execution, over-leveraged sizing, API keys with withdrawal permission enabled, and model drift after a regime change. Minimum precautions: trade-only API keys, a hard daily loss cap, capped maximum position size, and an accessible kill switch. Never run an autonomous system on capital you cannot afford to lose entirely.
How do I start AI trading?
Start with one tool and the staged testing process, not with capital. Pick a single AI assistant, model, or signal platform. Write its rules down, backtest with realistic costs across 100+ trades, walk it forward, then paper trade for 30 to 60 days. Go live at a quarter of your intended size and scale only if live results track your paper results.
Can I use ChatGPT for trading?
Yes, for research and analysis, but not as a signal source. It’s genuinely strong at summarising earnings reports, explaining indicator mechanics, writing backtest scripts, and stress-testing your thesis. It lacks reliable live price data, has no awareness of your account or risk limits, and will produce fabricated figures with total confidence. Verify every number it gives you against a primary source.
What are the disadvantages of AI trading?
The main disadvantages are overfitting, model drift, opacity, and misplaced trust. Overfit models look excellent historically and fail live. Drift degrades even well-built models as market regimes change. Deep learning systems often can’t explain their reasoning, which makes diagnosing failure nearly impossible. And automation encourages traders to stop checking, which is exactly when a small technical fault becomes a large loss.
Is AI trading legal?
AI and algorithmic trading are legal in every major regulated market as of 2026. What’s regulated is conduct, not technology: market manipulation, spoofing, and trading on non-public information remain illegal whether a human or a model does it. Managing other people’s money with an AI system usually requires licensing, and some brokers restrict automated access or high-frequency order flow. Check your broker’s terms and your local rules before deploying.
The Decision Still Belongs to You
If you take one thing from this guide, take this: use AI to generate and filter ideas, then refuse to act until you have one of three things in hand. A transparent rule you could write on an index card. A marked price level that defines where the idea is wrong. Or a documented, verifiable track record.
No rule, no level, no record? Then it isn’t a signal. It’s a guess with better branding.
So pick one tool. Just one, whether it’s an AI model or an indicator-based platform. Write down its logic, backtest it with real spreads and slippage, walk it forward, paper trade it for a month, then go live small. The process takes weeks. Skipping it has cost traders a great deal more than time.
And hold every provider to the same standard: verified, published outcomes, the way PipTrend publishes its trade results. Demand the receipts before you risk the capital.
Risk Disclaimer: Trading involves risk. Past performance doesn't guarantee future results. Only trade with money you can afford to lose. PipTrend is a tool to assist your trading decisions, not financial advice.