
Are you making decisions based on yesterday’s data or tomorrow’s potential? In today’s competitive environment, understanding lagging leading indicators can be the difference between reacting to change and driving it.
This guide is designed to demystify lagging leading indicators, offering a forward-looking analysis for professionals who want to optimize performance and strategic outcomes in 2026 and beyond.
We will break down clear definitions, key differences, and real-world examples. You’ll see how to apply indicator strategies across sectors, and learn best practices for integrating both types into your analytics approach.
Ready to boost your business intelligence and make smarter, data-driven decisions? Let’s unlock the power of indicators together.
Understanding Indicators: Definitions and Core Concepts
Grasping the concept of lagging leading indicators is essential for anyone aiming to make data-driven decisions. Indicators act as the compass of business analysis, guiding leaders through past results, present realities, and future possibilities. By understanding each type, organizations can turn raw data into actionable insight.
What Are Indicators?
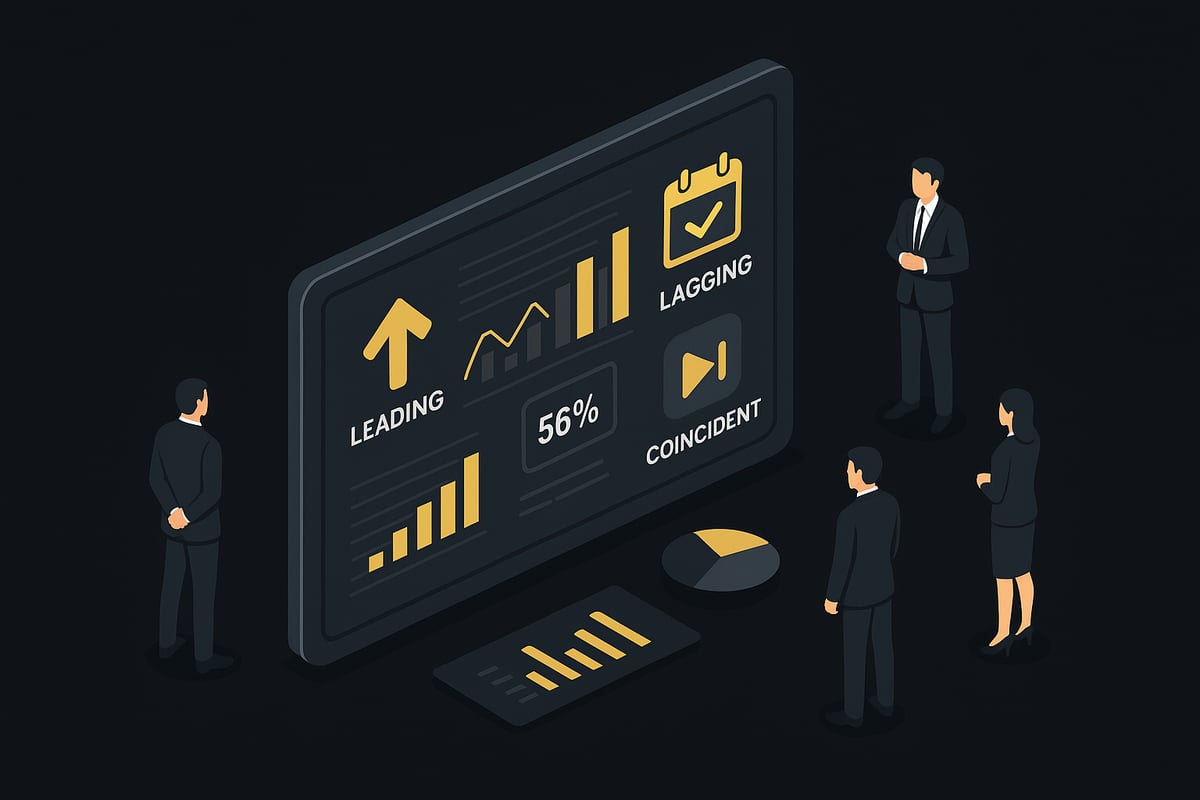
Indicators are statistical tools that measure various aspects of business performance. They help leaders assess progress, diagnose issues, and forecast trends. There are three main types: leading, lagging, and coincident indicators.
| Indicator Type | Timing | Example |
|---|---|---|
| Leading | Predictive | Customer sign-ups |
| Lagging | Retrospective | Revenue, profit |
| Coincident | Real-time | Resolved service desk tickets |
In business, IT, and economics, indicators offer context for critical decisions. For instance, an increase in resolved service desk tickets serves as a coincident indicator, reflecting current operational health. To explore detailed comparisons, see the Leading vs. Lagging Indicators Guide.
Leading Indicators: Predicting the Future
Leading indicators are metrics that forecast upcoming trends or outcomes. They act as inputs, signaling changes before they fully materialize. By tracking these, businesses can anticipate shifts and adjust strategies proactively.
Common examples include customer sign-ups, product engagement rates, and early contract renewals. Lagging leading indicators are often harder to define, as they require a deep understanding of what truly drives future performance. However, their predictive power makes them invaluable for proactive management.
Lagging Indicators: Measuring the Past
Lagging indicators measure what has already happened, reflecting outcomes rather than causes. These metrics are outputs, confirming the results of previous actions or strategies.
Typical lagging leading indicators include revenue, profit margins, churn rate, and system uptime. While they are easy to quantify and widely used in financial reporting and KPI dashboards, they only provide insights after the fact. This means organizations must look beyond lagging data to drive meaningful change.
Coincident Indicators: The Present Context
Coincident indicators capture the current state of a business or economy. They provide a snapshot of present conditions, offering valuable context to both leading and lagging leading indicators.
Examples include GDP, inflation rate, cash flow, and production levels. These indicators help organizations make real-time operational decisions and understand external factors influencing their environment. By integrating all three types, businesses gain a comprehensive perspective for smarter decision-making.
Key Differences Between Lagging and Leading Indicators
Understanding the distinction between lagging leading indicators is essential for any organization aiming to make informed, agile decisions. By comparing timing, practical application, data challenges, and the risks of one-sided focus, we can see why both indicator types are critical for business success.
 Lagging and Leading Indicators" />
Timing and Predictive Power
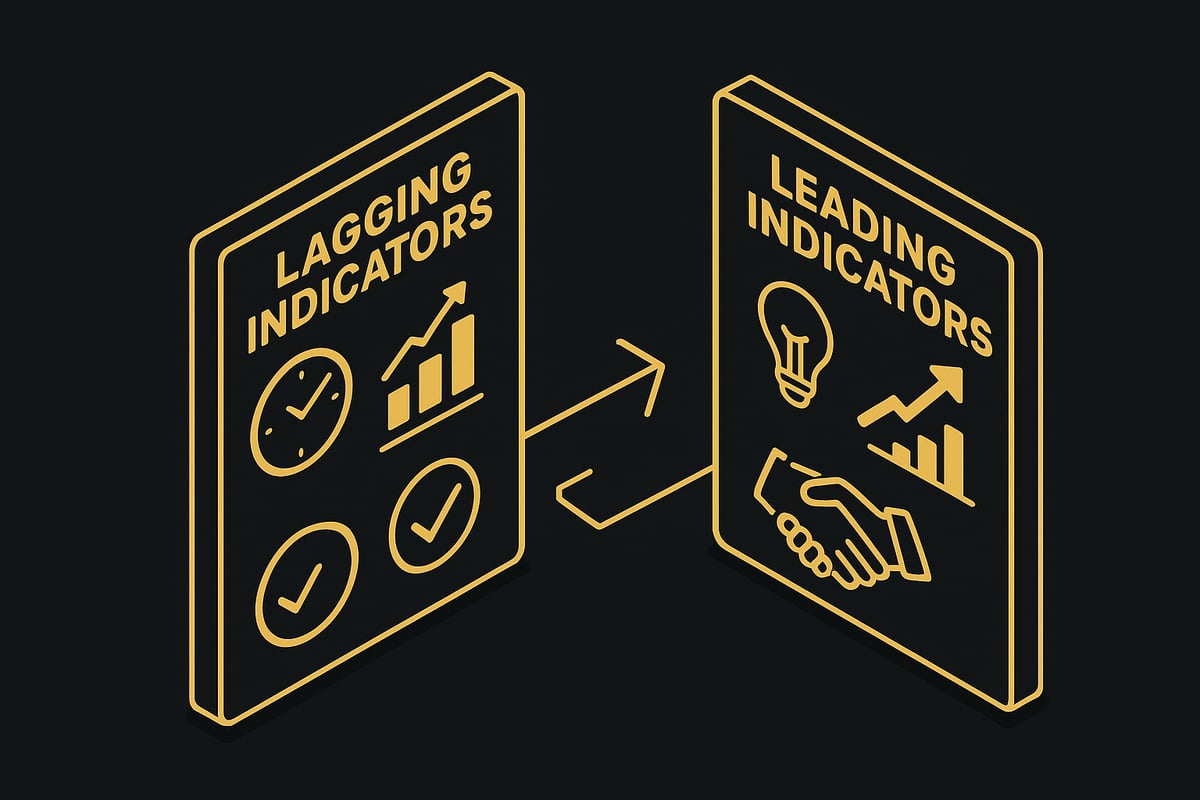
The core difference between lagging leading indicators lies in their relationship to time and prediction. Leading indicators act as early signals, hinting at future results before they manifest. In contrast, lagging indicators confirm what has already happened, offering clear feedback on completed events.
Here is a simple comparison table:
| Feature | Leading Indicators | Lagging Indicators |
|---|---|---|
| Timing | Predict future outcomes | Reflect past performance |
| Predictive Power | High (if chosen well) | None (retrospective) |
| Example | App engagement | Monthly recurring revenue |
Businesses use lagging leading indicators to balance foresight with confirmation. For a foundational understanding of these indicator types and their role in technical analysis, see the Technical Indicators Overview.
Application in Business Decision-Making
Lagging leading indicators shape business decisions in distinct ways. Leading indicators empower proactive management by highlighting trends that could impact future performance. For example, an uptick in customer inquiries might signal rising demand, prompting capacity adjustments before sales surge.
Lagging indicators, on the other hand, confirm the outcomes of past strategies. Metrics like churn rate or revenue show whether prior actions were effective. Successful organizations integrate lagging leading indicators into their KPI frameworks, ensuring that goals are both forward-looking and grounded in measurable results.
Using both types allows teams to set informed targets, track progress accurately, and course-correct as needed. This dual approach fosters agility and reduces the risk of reactive, last-minute decision-making.
Data Collection and Measurement Challenges
Collecting and interpreting data for lagging leading indicators involves different complexities. Leading indicators can be elusive, often requiring advanced analytics or indirect measurement. For instance, tracking shifts in customer sentiment demands continuous monitoring and sophisticated tools.
Lagging indicators are typically easier to gather since they rely on finalized data like sales figures or closed tickets. However, their simplicity makes them less actionable for immediate change. Ensuring data quality and timeliness is critical for both types, as outdated or inaccurate information undermines decision-making.
Organizations must invest in robust data systems to capture, validate, and analyze both lagging leading indicators effectively. This commitment to data integrity supports more reliable forecasting and performance evaluation.
Risks of Focusing Exclusively on One Type
Relying solely on lagging leading indicators introduces significant risks. Overemphasis on lagging indicators can leave teams unaware of emerging problems, as these metrics only reveal issues after the fact. Conversely, focusing only on leading indicators may cause organizations to chase trends without confirmation, resulting in wasted resources.
A balanced approach is vital. For instance, combining Net Promoter Score (a leading indicator) with retention rates (a lagging indicator) offers a complete view of customer experience. By integrating both lagging leading indicators, companies can detect early warning signs and validate outcomes, supporting sustainable growth and resilience in changing markets.
Real-World Examples: Lagging and Leading Indicators in Action
Understanding lagging leading indicators in real business environments brings theory to life. Let’s examine how organizations across sectors deploy these metrics for smarter decision-making, risk management, and growth.
Leading Indicator Examples Across Industries
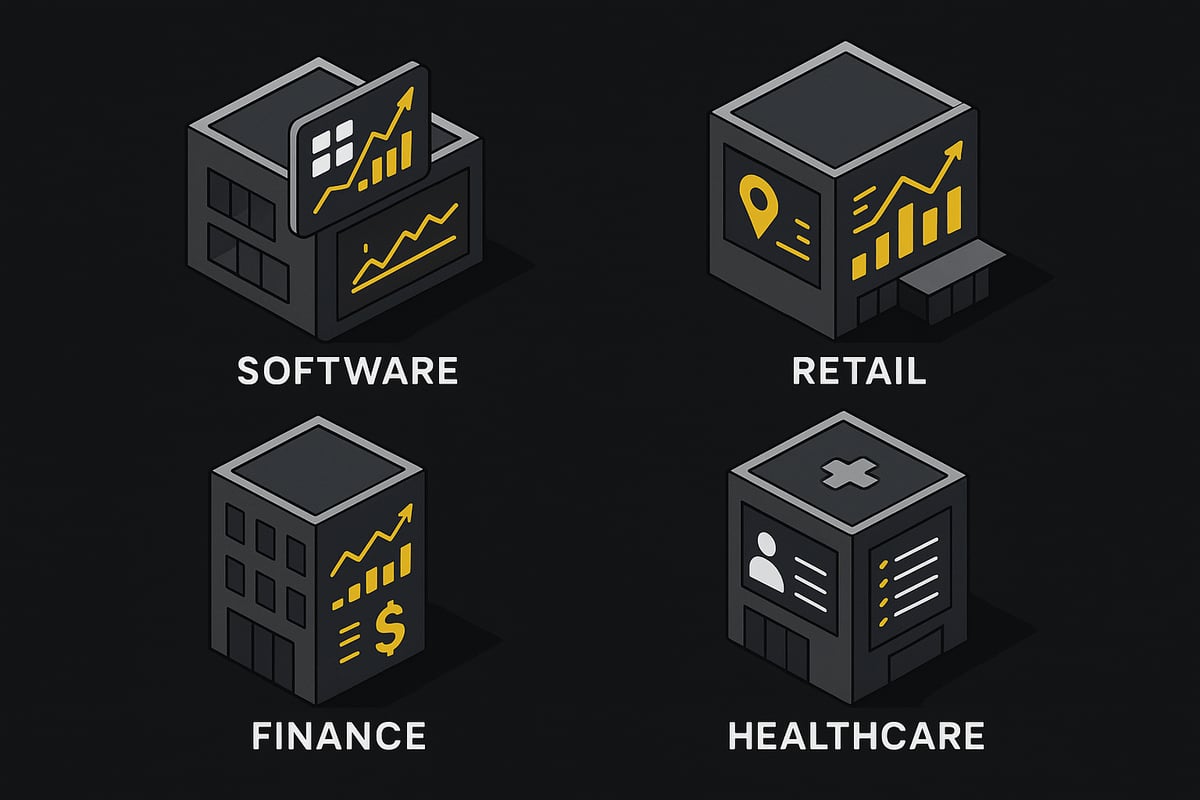
Leading indicators act as early signals, helping organizations see around the corner. Across industries, their proactive nature is key for anticipating trends and shaping strategy.
- Software: Companies often track the percentage of customers moving to multi-year contracts, early renewals, and add-on purchases. These lagging leading indicators suggest future retention and revenue.
- Retail: Website engagement, cart additions, and foot traffic are monitored closely. A sudden dip in cart additions can warn of upcoming sales challenges.
- Finance: Loan application volumes and real-time stock market trends serve as leading indicators, highlighting shifts in consumer demand or market sentiment.
- Healthcare: Appointment bookings and patient inquiries are strong predictors of future service utilization.
A high number of support calls is a classic example of lagging leading indicators in software and IT. This can foreshadow increased churn or satisfaction drops. By acting early, companies can address issues before they impact bottom-line results.
Early detection of these trends empowers teams to intervene, optimize resources, and pivot strategies. In fast-moving markets, those who master lagging leading indicators gain competitive agility.
Lagging Indicator Examples Across Industries
Lagging indicators provide a retrospective look, confirming what has already transpired. They are crucial for evaluating performance, setting benchmarks, and validating strategic choices.
- Software: Revenue, churn rate, renewal rates, and mean time to resolution are standard lagging indicators. These help teams measure the effectiveness of previous initiatives.
- Manufacturing: Units produced, defect rates, and historical downtime reflect completed cycles and support long-term planning.
- Finance: Profit margins, total expenses, and realized returns offer a clear picture of financial health after all activities have occurred.
- IT: Uptime and incident resolution times reveal how well systems have been maintained and supported.
Revenue and profit are classic lagging leading indicators, representing the outcomes of months or even years of collective effort. These metrics are essential for evaluating progress toward goals and guiding future investments.
While lagging leading indicators are easy to measure, they only tell part of the story. Organizations must use them in tandem with leading signals for a well-rounded view.
Case Study: Product Analytics and User Retention
A SaaS company wanted to improve user retention and revenue. They tracked daily active users as a leading indicator and monthly recurring revenue as a lagging indicator.
When engagement dropped, the lagging leading indicators signaled a need for rapid intervention. The product team released new features and improved onboarding flows, quickly reversing the trend.
This feedback loop between leading and lagging leading indicators enabled the company to boost retention and grow revenue. Proactive monitoring helped prevent long-term losses and fostered a culture of continuous improvement.
Case Study: Economic Indicators and Business Strategy
A national retail chain needed to stay resilient in a volatile economy. The team monitored inflation rates as a coincident indicator, consumer confidence as a leading indicator, and quarterly sales as a lagging indicator.
By analyzing these lagging leading indicators together, managers adjusted pricing and inventory in response to predictive signals. For example, when consumer confidence dropped, inventory orders were reduced ahead of declining sales.
Integrating all three types of indicators improved business agility and resilience. The company also referenced data from the Conference Board Leading Economic Index to benchmark their forecasts against broader economic trends.
This holistic approach to lagging leading indicators ensured the organization could adapt quickly to market shifts and maintain profitability.
Choosing the Right Indicators for Your Organization
Selecting the right lagging leading indicators is essential for aligning your measurement strategy with business objectives. When organizations choose indicators that directly support their strategic vision, they create a clear path from daily actions to long-term results. For example, a company focused on growth may prioritize new customer sign-ups as a leading indicator, while an organization targeting operational efficiency might track cost reduction as a lagging indicator.
A thoughtful approach ensures that indicators are not only relevant but also actionable, providing clarity and direction for teams across the organization. The key is to ensure that each chosen indicator maps directly to a specific business goal, taking into account industry, product maturity, and market dynamics.
Aligning Indicators with Strategic Goals
Every organization is unique, so the process of aligning lagging leading indicators with goals should be tailored. Start by identifying your top priorities: Are you aiming for market expansion, customer satisfaction, or operational excellence?
- For growth, leading indicators such as website conversions or demo requests are vital.
- For efficiency, lagging indicators like average resolution time or cost per transaction are key.
- For innovation, track early product adoption (leading) and patent filings (lagging).
This alignment ensures that each indicator reflects a meaningful aspect of your strategy, empowering teams to focus on what truly drives progress. Regularly reviewing this alignment is crucial, especially as business conditions evolve.
Criteria for Effective Indicator Selection
To maximize the value of lagging leading indicators, apply strict criteria during selection. The most effective indicators are:
| Criteria | Description |
|---|---|
| Relevance | Directly connected to your strategic objectives |
| Measurability | Quantifiable, with reliable data sources |
| Timeliness | Available in a timeframe that enables action |
| Actionability | Capable of influencing decisions and behaviors |
Avoid vanity metrics that look impressive but do not drive outcomes. For more detailed guidance, the Choosing Good Performance Indicators presentation highlights how both types of indicators can be selected to improve monitoring and performance, even in highly specialized sectors.
Balancing Leading and Lagging Indicators
A robust analytics framework balances both lagging leading indicators for a comprehensive view. Leading indicators act as early warning signals, helping you anticipate shifts and adapt quickly. Lagging indicators validate your efforts, confirming whether strategies have delivered the desired results.
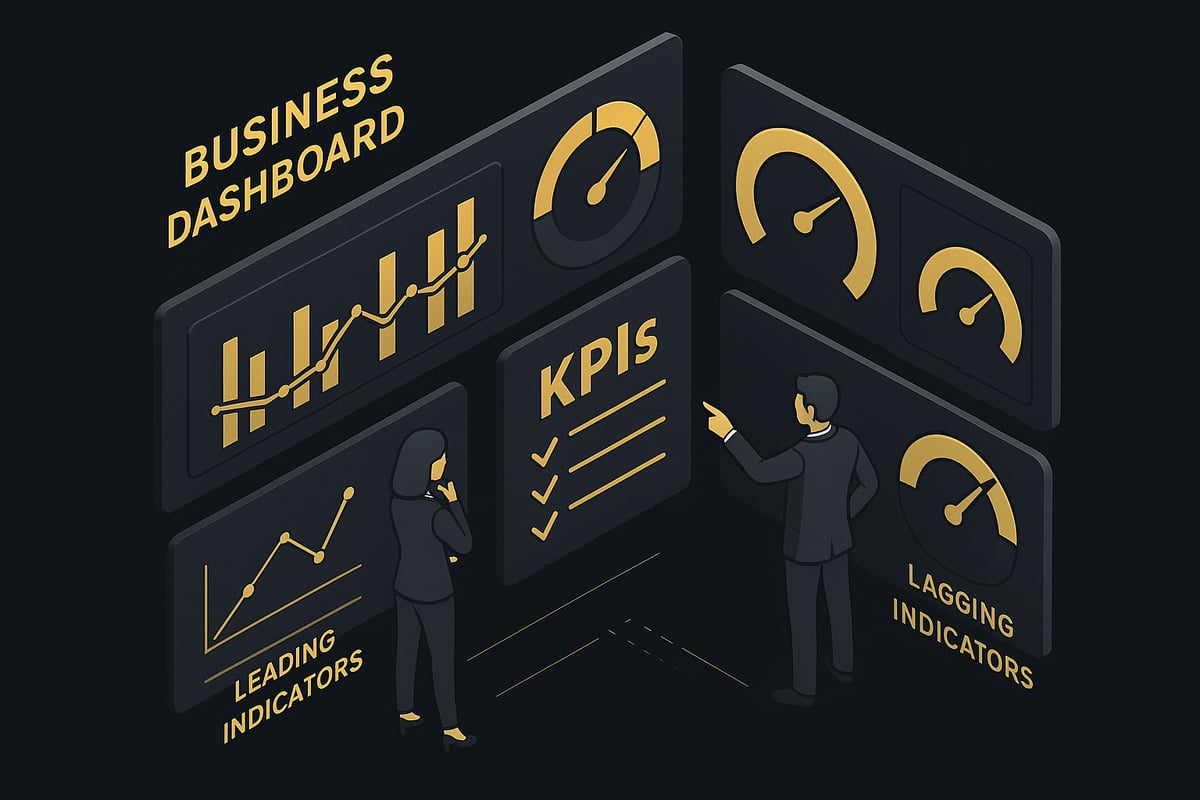
For example, combining customer referrals (leading) with renewal rates (lagging) provides a full spectrum view of customer loyalty. Using dashboards and balanced scorecards, organizations can monitor both categories side by side, ensuring that no critical signals are missed.
Common Pitfalls and How to Avoid Them
Organizations often stumble by focusing exclusively on one type of lagging leading indicators or by failing to update their metrics as the business landscape changes. Other pitfalls include ignoring external factors and overcomplicating measurement systems.
- Avoid outdated KPIs that no longer reflect current realities.
- Regularly review and update your indicator set.
- Involve stakeholders across departments to ensure buy-in and relevance.
By keeping your indicators current and well balanced, you position your organization for sustained success and resilience.
Best Practices for Integrating Lagging and Leading Indicators
Effectively integrating lagging leading indicators into your business strategy requires a deliberate approach. By following best practices, organizations can turn data into actionable insight and sustain a competitive edge. Let us explore how to build a culture, systems, and processes that make the most of lagging leading indicators.
Building a Data-Driven Culture
A data-driven culture is the cornerstone for successful use of lagging leading indicators. Encourage every team to participate in selecting and reviewing KPIs. When product, marketing, and finance teams share ownership, they align on common goals and understand the story behind the numbers.
Promote data literacy through training and open discussions. This ensures that employees can interpret both lagging leading indicators and act on insights. Foster an environment where questioning metrics leads to better strategies.
Make data accessibility a priority. When teams can easily access and visualize lagging leading indicators, they are empowered to make timely decisions. This collective focus transforms raw data into a powerful tool for performance improvement.
Designing Effective Dashboards and Reports
Dashboards are essential for visualizing lagging leading indicators side by side. Use real-time data to highlight leading indicators, while presenting historical trends for lagging ones. This dual view helps teams quickly identify issues and opportunities.
Effective dashboards prioritize clarity, not clutter. Choose visualizations that make trends and anomalies stand out. For deeper understanding, include filters and drill-downs that let users explore underlying data.
Incorporating best practices from trading and analytics platforms, such as those discussed in Best Trading Indicators Explained, can help you select the right mix of indicators for your dashboard. Well-designed reports drive faster and more accurate decision-making across the organization.
Leveraging Technology and Automation
Modern technology streamlines the collection and analysis of lagging leading indicators. Business intelligence platforms automate data aggregation, freeing teams from manual work. Automated alerts notify stakeholders when a leading indicator dips, prompting swift action before lagging results are affected.
Integration with analytics suites allows for seamless tracking of both indicator types. Customizable tools adapt to evolving business needs, ensuring that lagging leading indicators remain relevant as strategies shift.
Adopt platforms that support collaboration and data sharing. This encourages teams to work together, improving the interpretation and response to changes in key metrics. Technology, when used wisely, is a catalyst for operational agility.
Continuous Improvement Through Indicator Analysis
Lagging leading indicators should not be static. Regularly review your KPIs to ensure they reflect current business realities. An iterative approach encourages teams to refine or replace indicators based on performance and feedback.
Leverage theoretical insights, such as those found in Unravelling the Gordian knot of leading indicators, to deepen your understanding of indicator relationships. This helps uncover new predictive metrics and avoid overreliance on outdated measures.
Encourage teams to document lessons learned from each KPI review cycle. Over time, this process transforms lagging leading indicators into a dynamic feedback loop, driving continuous growth and innovation.
Cross-Industry Lessons and Sector-Specific Insights
Best practices for lagging leading indicators vary by sector, but some principles apply universally. For example, healthcare organizations track early symptom reports (leading) and patient recovery rates (lagging) for comprehensive care. In finance, loan application volume (leading) and realized returns (lagging) guide risk management.
| Sector | Leading Indicator | Lagging Indicator |
|---|---|---|
| Healthcare | Early symptom reporting | Recovery rates |
| Finance | Application volume | Realized returns |
| Retail | Foot traffic | Sales revenue |
| Software | Feature engagement | Churn rate |
Learning from other industries can reveal new indicator combinations and inspire innovation. Sharing best practices accelerates progress and enhances the overall value of lagging leading indicators.
Future Trends: Indicators in 2026 and Beyond
The future of lagging leading indicators is shaped by AI, machine learning, and real-time analytics. Predictive models are becoming more sophisticated, enabling organizations to identify patterns and forecast outcomes with greater precision.
Integration with IoT devices will provide granular, real-time data streams. This allows for more nuanced lagging leading indicators that capture subtle shifts in performance and customer behavior. Advanced analytics platforms will refine indicator selection, improving accuracy and relevance.
Organizations that invest in these technologies will unlock new strategic advantages. Embracing innovation ensures that lagging leading indicators remain a foundation for superior decision-making in 2026 and beyond.
How to Use Lagging and Leading Indicators for Superior Business Performance
Effectively leveraging lagging leading indicators is vital for organizations seeking a performance edge in 2026. Understanding how to set, monitor, and integrate these indicators transforms raw data into actionable business insights. The following strategies demonstrate how to use lagging leading indicators to drive business objectives, anticipate trends, and build organizational resilience.
Setting Actionable KPIs and OKRs
To maximize the impact of lagging leading indicators, organizations must translate them into clear KPIs and OKRs. Begin by identifying which indicators align directly with your strategic objectives. For example, if reducing churn is a priority, tie a lagging indicator like churn rate to a leading indicator such as onboarding completion rates.
Break down each objective into measurable targets. Use tables to map out which lagging leading indicators best reflect progress toward each goal. This ensures every department understands how daily actions influence long-term outcomes. When indicators are actionable, teams remain focused and accountable.
Monitoring and Responding to Indicator Trends
Continuous monitoring of lagging leading indicators allows organizations to adapt quickly. Establish routines for reviewing both real-time leading signals and historical lagging results. Weekly check-ins help teams spot emerging trends and make timely adjustments.
Leveraging technology is essential. For instance, using advanced dashboards like those discussed in Tradingview Indicators for Analysis enables real-time tracking and visualization of key metrics. Automated alerts for shifts in leading indicators empower proactive decision-making, minimizing the risk of negative lagging outcomes.
Linking Indicators to Business Outcomes
The true value of lagging leading indicators emerges when linked directly to business results. Demonstrate how improvements in leading indicators, such as customer satisfaction scores, translate into positive lagging metrics like renewal rates or revenue growth.
Share data stories that connect actions to outcomes. Presenting clear correlations between indicator trends and ROI helps secure stakeholder buy-in. This approach ensures investment in indicator-driven initiatives is justified, fostering a culture of accountability and continuous improvement throughout the organization.
Building Resilience Through Indicator Integration
Integrating lagging leading indicators across functions strengthens organizational resilience. Use these indicators to anticipate market shifts, identify risks, and seize opportunities before competitors react.
For example, by combining early warning signals from leading indicators with confirmation from lagging metrics, companies can pivot strategies with confidence. This balanced approach enables businesses to adapt to volatility and maintain steady growth, regardless of external disruptions. Organizations that master indicator integration consistently outperform less agile peers.
Now that you understand how the right mix of lagging and leading indicators can transform your business strategy, imagine applying the same clarity and precision to your trading decisions. You no longer need to second-guess when to enter or exit the market or worry about missing key signals. With PipTrend, you gain instant insight into market direction, high-probability setups, and multi-timeframe alignment—everything you need to trade with confidence. If you’re ready to stop letting confusion hold you back and want to see measurable results, See Your Trading Improve With PipTrend.