Leading vs Lagging Indicators: Which Wins for Traders?
On this page
Introduction
The debate over leading vs lagging indicators has been running for decades, and most articles about it end in a shrug.
Here’s the honest version.
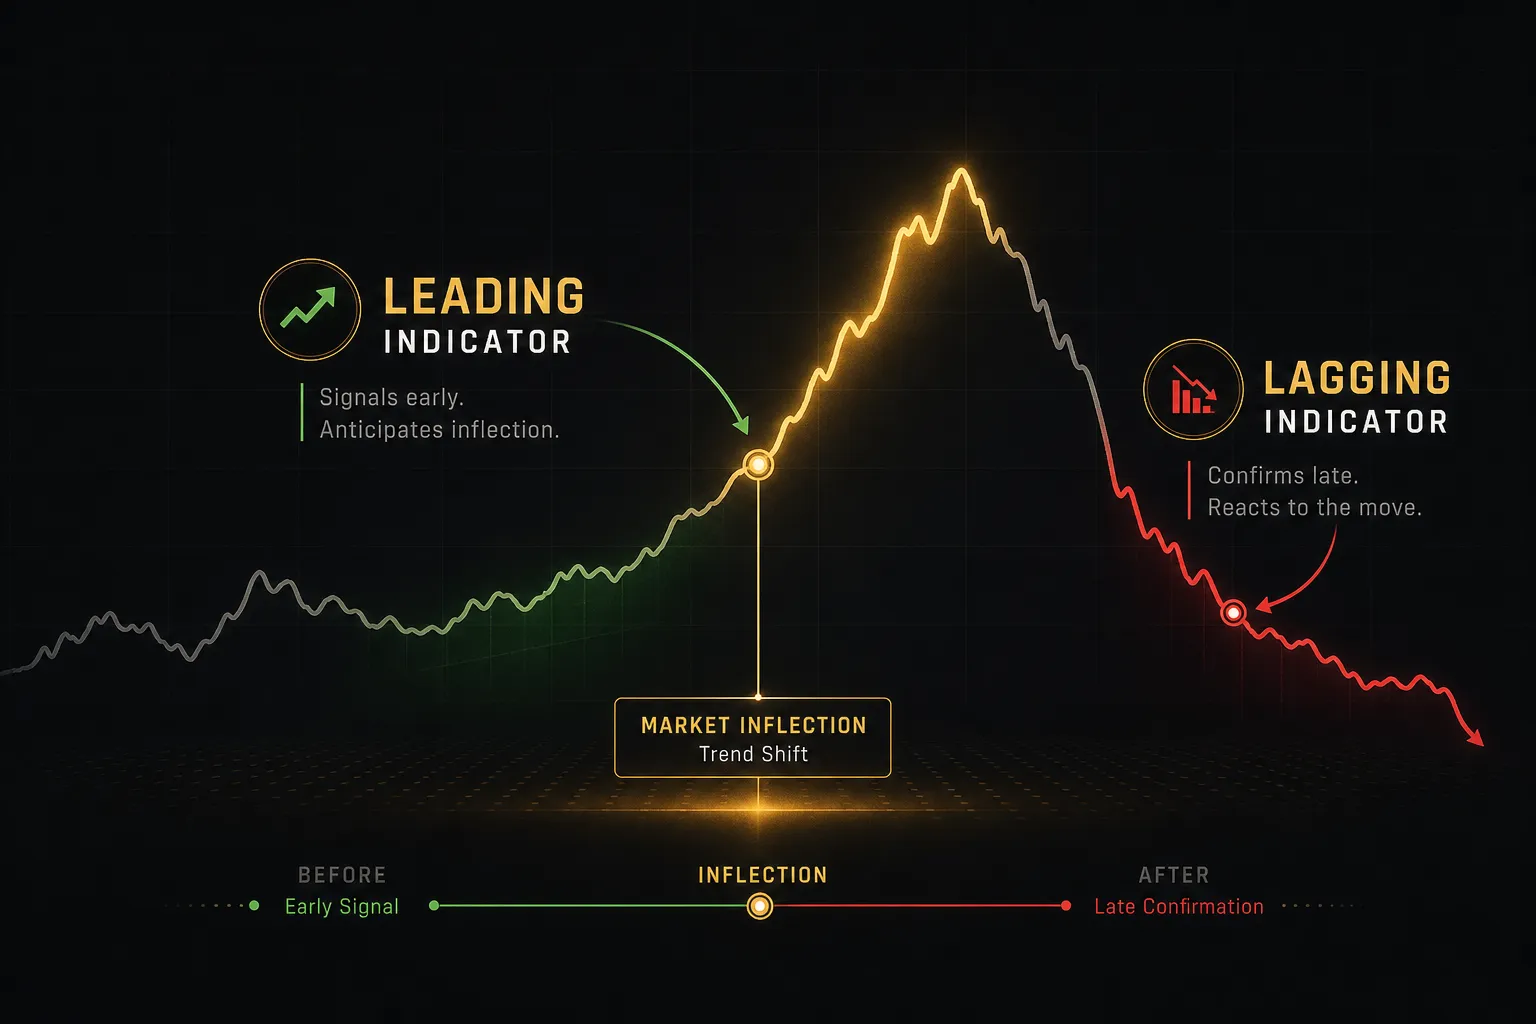
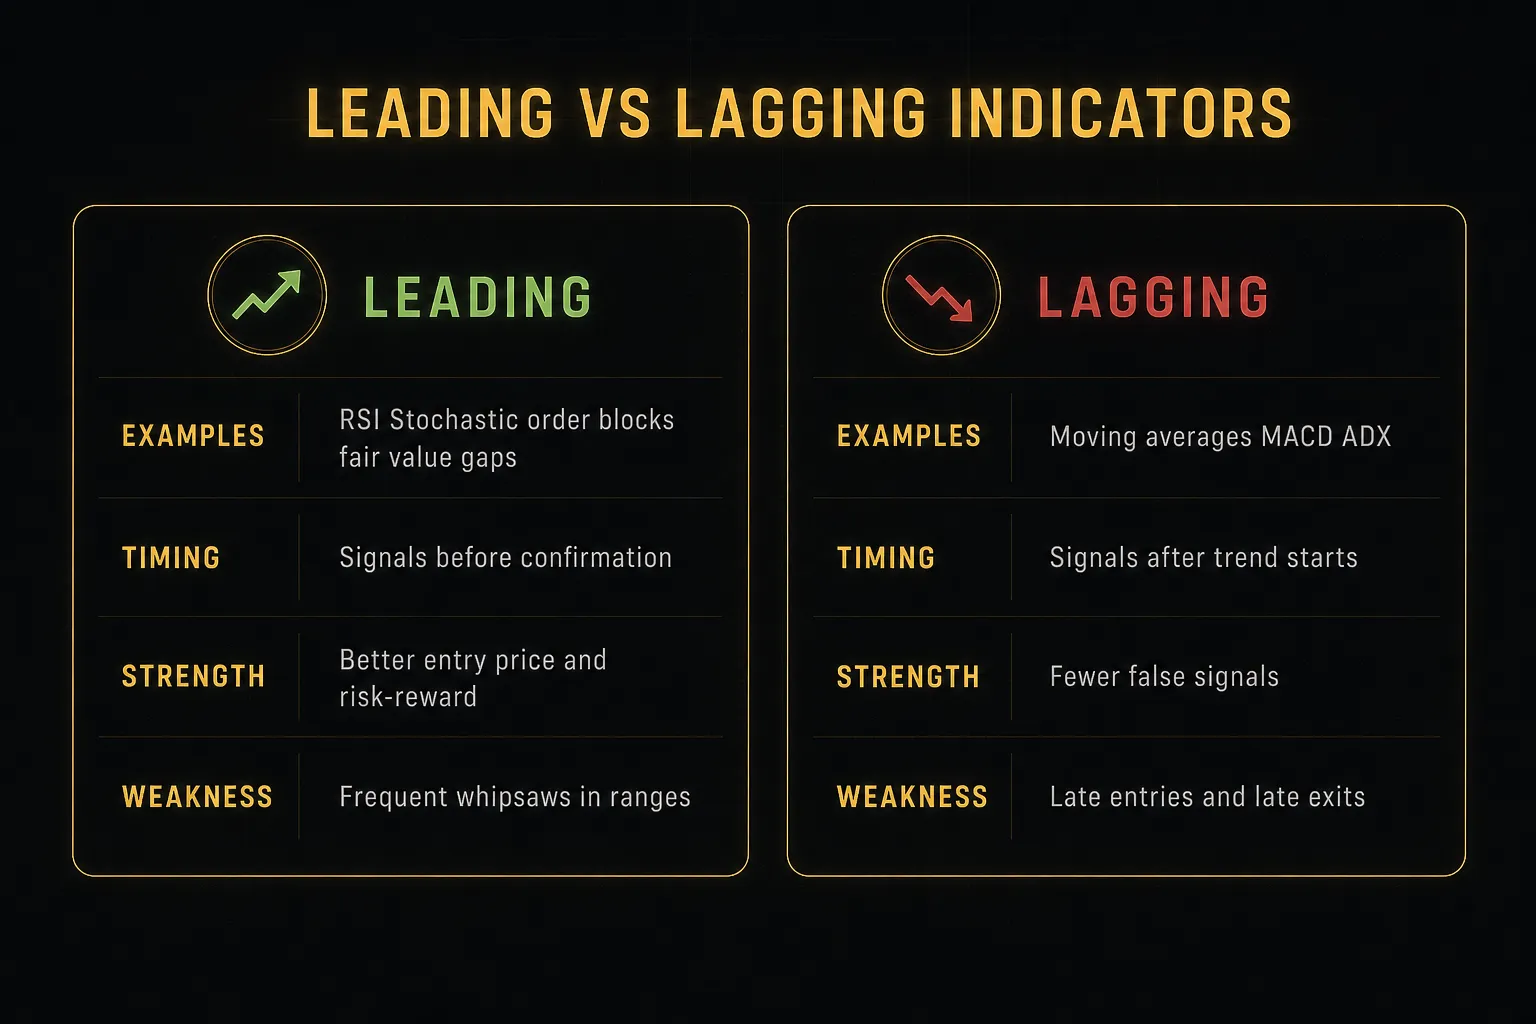
Leading indicators (RSI, Stochastic, price-action structures like order blocks and fair value gaps) fire early. You get in before the crowd, and sometimes you get in before a move that never happens.
That’s the trade-off: speed for accuracy.
Lagging indicators (moving averages, MACD crossovers, ADX) do the opposite. They wait until the trend is proven, filter out most false signals, and hand you an entry twenty pips after the good price has gone.
So which wins?
Neither, on its own.
The traders who compound accounts consistently don’t pick a camp. They pair early trend detection with confirmed multi-timeframe direction, then act on a marked price level rather than a color change.
That’s why our top recommendation for 2026 is PipTrend. It’s the only TradingView system in this comparison that structurally separates the signal (direction) from the entry (price level), then layers a 12-timeframe confirmation table on top of both. You get the early-entry edge of a leading tool with the false-signal filtering of a lagging one, inside one workflow.
Below we cover the concept differences properly first: what actually makes an indicator leading or lagging, why RSI and MACD sit on opposite sides of that line, and when each type genuinely outperforms.
Then we compare how seven real TradingView indicator systems handle the trade-off: PipTrend, LuxAlgo, Flux Charts, ChartPrime, Zeiierman, Market Cipher, and AlgoXpert. Pricing, entry precision, repaint risk, and whether anyone actually publishes live results.
Quick Comparison Table
Seven platforms, one question: how does each one handle the leading/lagging trade-off, and can you verify that it works? Pricing is current as of 2026 and reflects the lowest advertised tier.
| Platform | Leading/Lagging Approach | Entry Precision | Multi-Timeframe Confirmation | Public Trade Transparency | Starting Price | Best For |
|---|---|---|---|---|---|---|
| PipTrend | Both: gray candles mark forming trends (leading), green/red confirm momentum, MTF table confirms (lagging) | High: session highs/lows, VWAP, supply and demand zones with mitigation tracking, fair value gaps, Confidence Band | Yes: 12 timeframes, 1-minute to Monthly, BUY/SELL/NEUTRAL | Yes: public results page with verified cTrader statements, losses and break-evens included | $40/mo billed annually ($479.99/yr); $59.99 monthly | Best overall value and the only system with published live outcomes |
| LuxAlgo | Both: confirmation + contrarian signals, trend/volatility/volume plus machine-learning classification | Medium-high: order blocks, liquidity, FVGs, premium/discount zones, but no enforced signal/entry split | Yes: multi-timeframe dashboards | No public live trade log | Free plan; Premium ~$39.99/mo, Ultimate ~$59.99/mo | Advanced traders building their own confluence rules |
| Flux Charts | Mostly lagging/structure: BOS, CHoCH, liquidity grabs, order blocks, plus SFX trend and momentum | Medium: MTF supply and demand zones, session levels, prior highs/lows | Partial: MTF zones and screeners | Backtesters and screenshots, no published live log | $59.99/mo or $719.88/yr (Pro) | ICT and smart-money-concept traders |
| ChartPrime | Mostly lagging/structure: Market Dynamics structure and liquidity, Market Oracle signals with reversal warnings | Medium: TP levels, trailing-stop zones, order blocks, reaction zones | Partial: Prime Screener across assets | No public verified statements | Pro $67/mo or $489/yr; Plus $117/mo | Traders who want education and live weekly sessions |
| Market Cipher | Purely lagging: momentum waves, EMA ribbon, RSI, money flow, divergence | Medium: SR tool and VWAP focus, no forming-trend layer | No unified MTF table | Community screenshots only | $600 promo (12 months, listed $1,000); $1,500 lifetime promo | Crypto divergence and oscillator purists |
| AlgoXpert | Lagging confirmation via order flow, auction theory, value areas; 35-check entry orb | High but M5-only: VWAP deviation bands, POC, low-volume zones | No: tuned and locked to M5 | No public verified statements | $58/mo yearly ($696), $66/mo quarterly, $79/mo | Mechanical single-timeframe session scalpers |
| Zeiierman | Both, spread across 80+ separate indicators and 9 buy/sell algorithms | Varies by tool, no unified direction-to-entry workflow | Depends on which indicator you load | No public verified statements | ~$37.99/mo annually; ~$49/mo monthly | Traders who want the largest indicator library |
The pattern is hard to miss.
Most suites are strong on one side of the leading/lagging line and thin on the other. Only two combine both meaningfully, and only one publishes verified outcomes.
Leading vs Lagging Indicators: The Real Difference
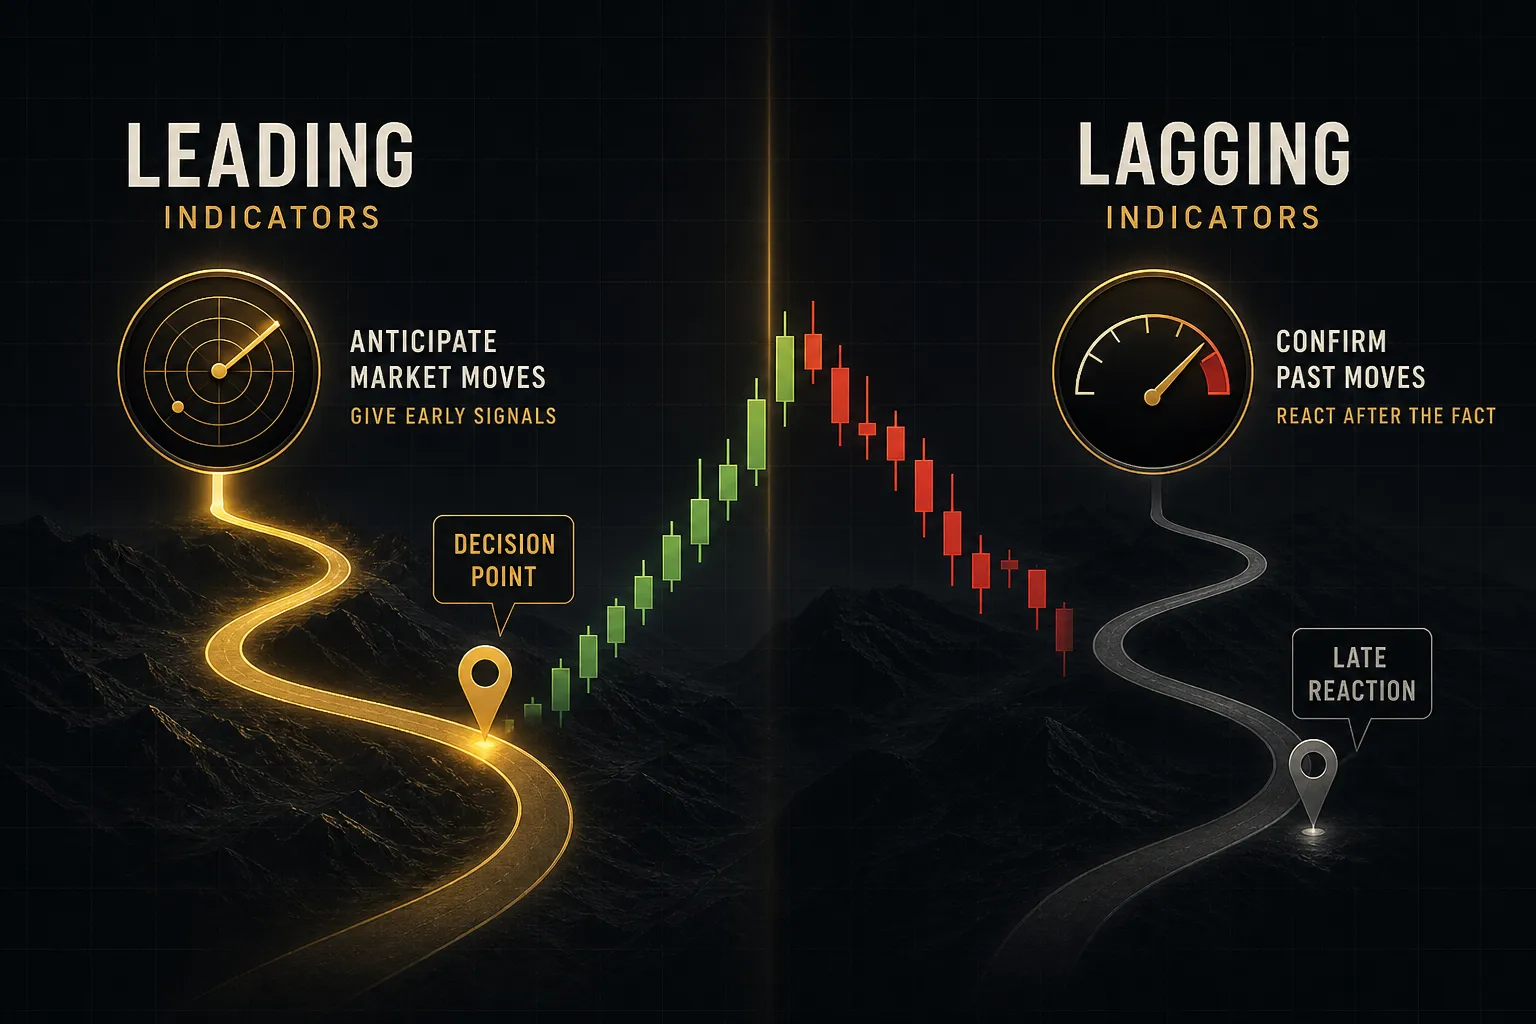
Every technical indicator is a transformation of past price data. What separates leading from lagging is how much past data it needs before it says something useful.
Leading Indicators: Early Signals, More Noise
Leading technical indicators attempt to predict a move before it’s confirmed. They read momentum exhaustion, structural imbalance, or position in a range, and they fire while price is still deciding.
The classic examples are oscillators.
RSI flags overbought and oversold conditions. Stochastic measures where price sits inside its recent range. Both generate reversal signals ahead of the turn.
Price-action structures belong here too. Order blocks, fair value gaps, and supply and demand zones are all attempts to mark where price should react, before it does.
The upside is obvious. Earlier entries mean better average entry price, tighter stops relative to target, and a superior risk-reward profile on the trades that work.
The downside is equally obvious. Leading indicators produce false signals in bulk. In choppy or low-liquidity conditions, RSI can sit above 70 for a week while price grinds higher, stopping out every reversal trade along the way.
Trading a leading signal without a filter is how accounts bleed out slowly.
Not through one disaster, but through forty small losses.
Lagging Indicators: Confirmed Trends, Later Entries
Lagging technical indicators confirm a trend after it’s already underway. They smooth price data over a lookback period, which by definition means they report the past.
Moving averages are the purest form.
A 50-period EMA crossing a 200-period EMA tells you a trend changed, usually well after the change happened. ADX confirms trend strength only once strength exists.
And here’s the one that trips people up constantly: MACD is a lagging indicator.
It’s marketed as a signal tool, and it does generate crossovers, but it’s built from two exponential moving averages.
Anything derived from a moving average inherits that lag.
Full stop.
What you get in exchange is reliability. Trend-following indicators keep you out of most of the noise that eats leading-indicator traders alive. Fewer trades, higher hit rate on the ones you take.
What you pay is entry price. By the time a MACD crossover prints on the daily chart, the first 30% of the move often belongs to someone else. In fast markets, lagging exits give back a meaningful chunk of open profit.
Why Most Profitable Traders Use Both Together
Neither type wins outright, and any article claiming otherwise is selling something. The honest answer is that performance depends on market condition, not indicator type.
Leading indicators outperform in ranging, mean-reverting, reversal-prone markets. Lagging indicators outperform in strong, sustained trends.
Since you don’t know which regime you’re in until it’s over, betting your entire method on one philosophy is a structural mistake.
The combined approach fixes most of it.
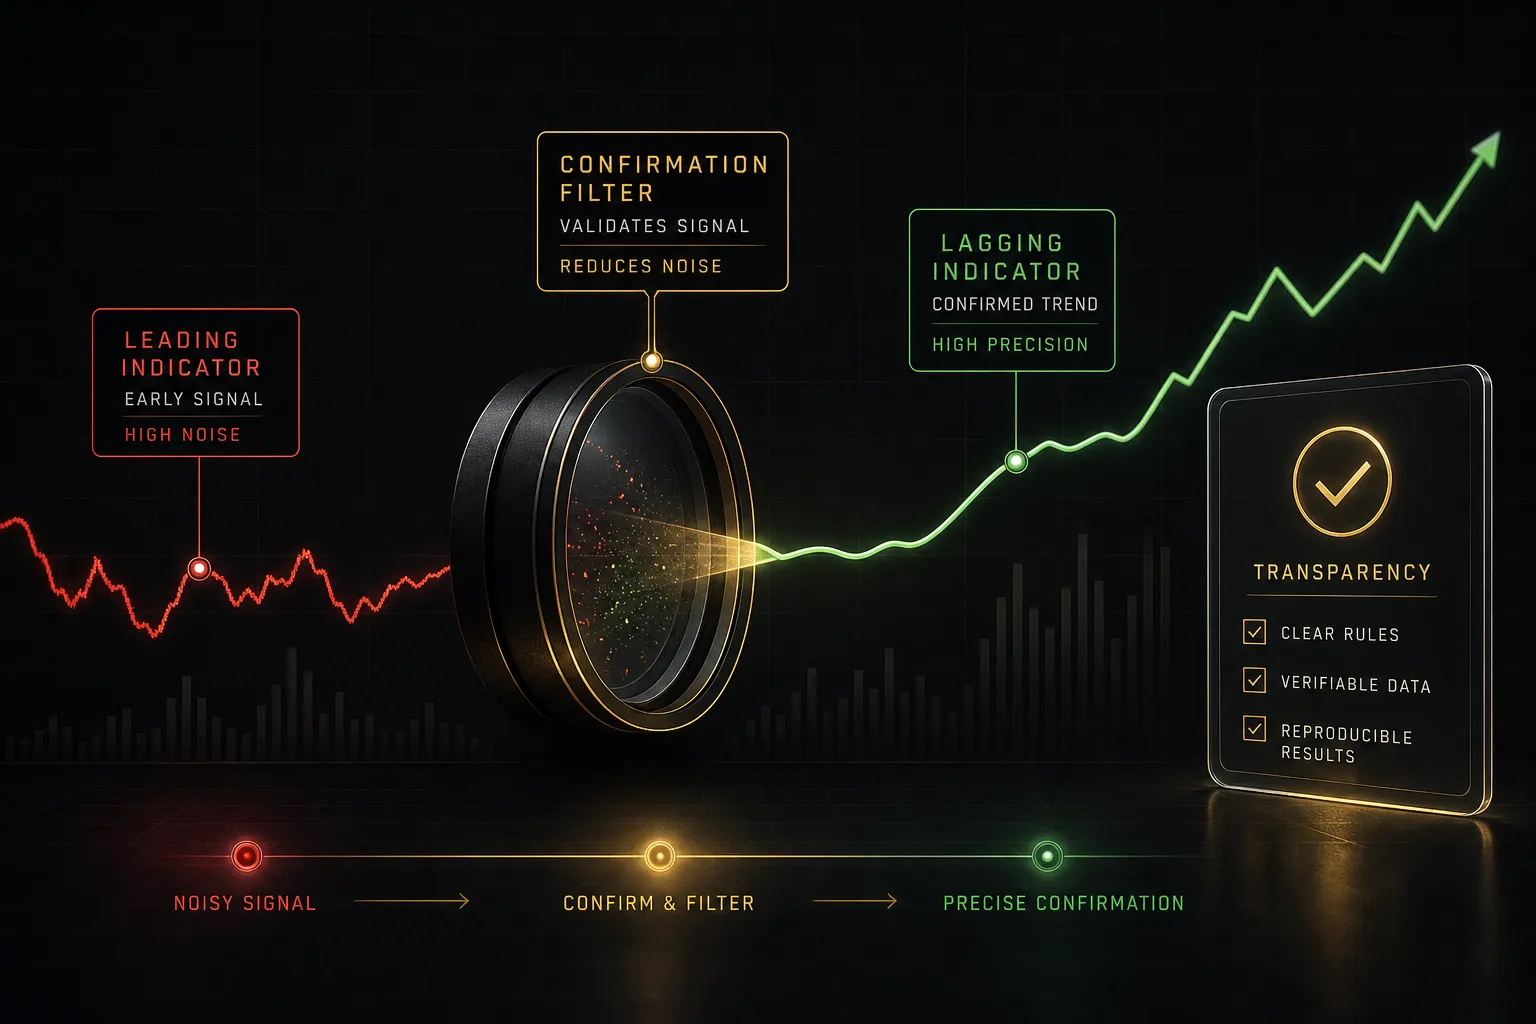
A leading tool identifies a forming setup. A lagging or confirmation layer validates direction before you commit capital. You sacrifice a little of the early-entry edge and remove a large share of the false starts.
But there’s a gap almost every roundup on this topic skips, and it matters more than the leading/lagging question itself.
A signal is not an entry level.
A color change, a crossover, an arrow on the chart: none of those tell you what price to buy at. Traders who act the instant a signal appears are buying tops and selling bottoms, regardless of which indicator type produced it.
You need a marked price.
A session high, a session low, VWAP, a supply and demand zone, a fair value gap. Something concrete to place a limit order against, with a stop that makes structural sense.
That’s the piece that turns either indicator type into a process. Direction from the signal, price from the level, confirmation from multi-timeframe analysis.
Three separate jobs, three separate tools.
PipTrend: One System, Both Signal Types
PipTrend is our top pick because it’s built around exactly that three-part structure, rather than asking you to pick a side in the leading versus lagging debate.
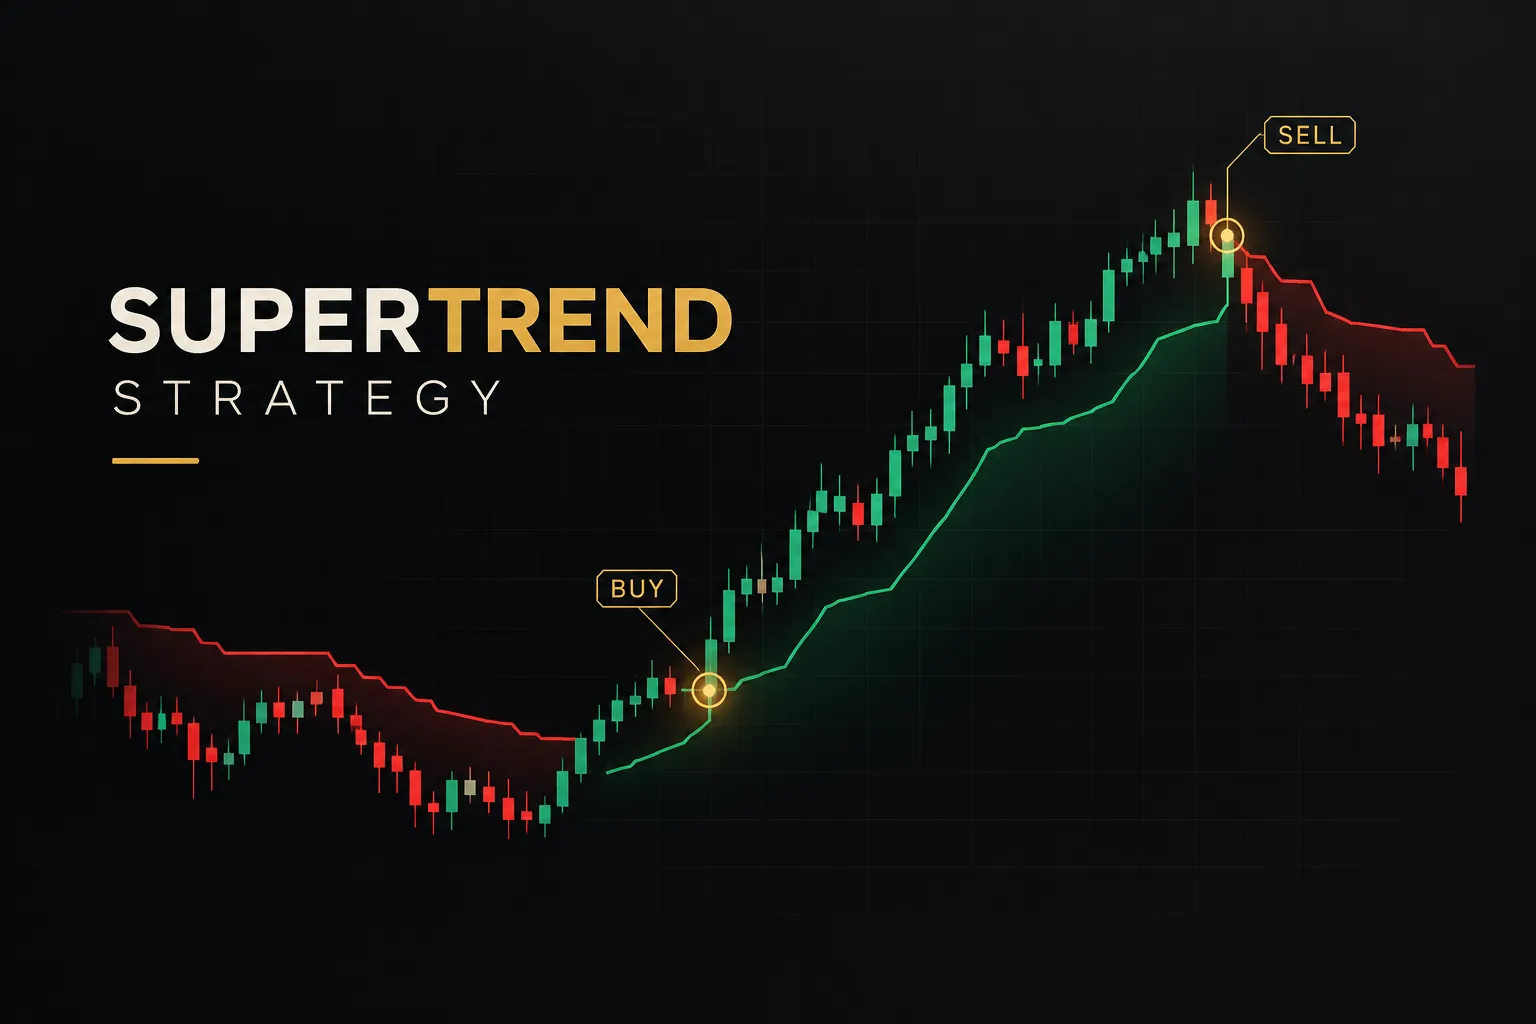
The color-coded candles are the leading layer. Green marks confirmed bullish momentum, red marks bearish pressure, and gray specifically marks the forming phase of a trend, before it’s confirmed and crowded.
That gray phase is the early-entry edge lagging-only tools structurally cannot give you. You see a trend building, wait for a pullback to a marked level, and get positioned before the moving-average crowd gets its crossover.
The 12-timeframe confirmation table is the lagging layer.
One dashboard, BUY/SELL/NEUTRAL status from the 1-minute chart all the way up to Monthly. Before you commit, you can see whether the higher timeframes agree with the setup in front of you.
That’s what cuts the false-reversal risk pure leading tools carry.
A gray-to-green shift on the 5-minute chart while the H4 and Daily both read SELL is not a trade. The table tells you that in one glance.
Then the entry levels do the third job.
Session highs and lows, previous day high and low, VWAP, supply and demand zones with mitigation tracking, and fair value gap detection, all painted on the chart. Plus the Confidence Band, a dynamic zone that acts as support in uptrends and resistance in downtrends, showing where to look for pullback entries.
The design principle is enforced, not suggested: the signal gives direction only, the level says where. Most competitors leave that discipline entirely up to you.
Two practical details worth flagging.
Signals confirm on candle close and do not repaint afterwards, which is something most indicator roundups never actually test. And a whipsaw filter keeps you out of low-probability chop, which is the exact condition where leading indicators fall apart.
Coverage spans Forex, Crypto, Indices, Commodities, and Stocks.
Pricing starts at $40/mo on the annual plan ($479.99 once), $45/mo quarterly, or $59.99 billed monthly, with a 3-day free trial and a 30-day money-back guarantee. Eighteen companion calculators and tools (position size, pip value, risk-reward, expectancy, currency strength meter, correlation matrix, economic calendar) are bundled in at no extra cost.
The honest limitation: this is a rules-based system with a learning curve, particularly around reading the MTF table correctly. If you want a single one-click arrow to follow blindly, PipTrend will feel like more work than you signed up for.
It rewards traders willing to follow a repeatable process.
PipTrend is the only system in this comparison that publishes trade ideas taken with the indicator on a public results page, with verified cTrader statements attached, losses and break-evens included. Not a highlight reel.
Signal Precision, Confirmation, and Transparency
Marketing pages all sound the same.
What separates these platforms is measurable: does the system separate signal from entry, does it repaint, can you confirm across timeframes, and can you verify any of it against real outcomes?
| Platform | Signal/Entry Separation | Repaint Risk | Multi-Timeframe Table | Public Trade Log / Verified Statements | Chart Clutter | Winner |
|---|---|---|---|---|---|---|
| PipTrend | Explicit and enforced: signal = direction, entry = marked level (VWAP, session highs/lows, S&D zones, FVGs) | Low: signals confirm on candle close and do not change afterwards | Yes: 12 timeframes, 1m to Monthly, in one dashboard | Yes: public results page, verified cTrader statements, losses and break-evens shown | Low: each tool has one job, toggled as needed | Overall winner |
| LuxAlgo | Not enforced: signals and zones coexist, confluence rules are user-built | Documented per-toolkit; confirmation vs contrarian modes differ | Yes: MTF dashboards | No public live trade log | Medium-high if multiple toolkits are stacked | Customization, screeners, backtesting depth |
| Flux Charts | Partial: structure zones exist, but no enforced separation from SFX signals | Structure tools redraw as new BOS/CHoCH forms | Partial: MTF supply and demand zones plus screeners | No: backtesters and screenshots | Medium-high: dense ICT overlays | ICT/SMC structure detection |
| ChartPrime | Partial: Market Oracle prints signals with TP levels attached | Reversal warnings and trailing zones update dynamically | Partial: Prime Screener rather than a unified table | No verified statements published | Medium: polished but layered visuals | Education and live weekly sessions |
| Market Cipher | Weak: oscillator dots are the signal and often treated as the entry | Wave/divergence readings evolve with the developing candle | No unified MTF table | No: community screenshots | Medium: separate A, B, SR, DBSI panels | Crypto divergence and momentum analysis |
| AlgoXpert | Strong within M5: 35-check confirmed entry orb tied to value areas and VWAP bands | Low: candle-close confirmation, non-repainting entry orb | No: tuned and locked to M5 only | No verified statements published | Medium: 61 modules in one slot, heavily gated | Mechanical M5 session workflow |
| Zeiierman | No unified workflow: 80+ separate indicators, user assembles the process | Advertised as non-repainting in documentation | Varies by indicator loaded | No verified statements published | High if multiple scripts are combined | Sheer indicator variety (80+ tools) |
PipTrend takes the overall win on the combination that matters: explicit signal/entry separation, a genuine 12-timeframe confirmation dashboard, candle-close signals that don’t repaint, and published live outcomes you can audit.
No other platform here does all four.
LuxAlgo wins on raw customization.
If you want to build your own confluence rules, run screeners across dozens of assets, and backtest variations, its Premium and Ultimate tiers give you more control than PipTrend does. Machine-learning classification and natural-language strategy building on Ultimate are genuinely useful for advanced users.
What you won’t find is a public live trade log to verify real performance.
Flux Charts and ChartPrime win on price-action structure detection.
If you’re already fluent in smart-money concepts, Flux Charts’ automated BOS, CHoCH, liquidity grabs, breaker blocks, and volume imbalances save serious chart time. ChartPrime’s Market Dynamics and Quantum Bands are cleanly executed, and five live strategy sessions a week on the Pro plan is real value.
Both rely on backtests and screenshots rather than published outcomes, and at $59.99 to $117/mo they sit above PipTrend’s annual rate.
Market Cipher wins for divergence purists.
The B oscillator’s wave, money flow, and Green Dot signals have a loyal crypto following for good reason, and the SR tool’s VWAP focus works well on lower timeframes. But it’s a purely lagging toolkit with no forming-trend layer, no unified multi-timeframe table, and the highest price in this comparison at $600 promotional for 12 months or $1,500 lifetime.
That’s over a year of PipTrend for the annual plan alone.
AlgoXpert wins for locked mechanical workflows.
Its 35-check confirmed entry orb, auction map, value areas, and non-repainting candle-close logic are well engineered, and the discipline is enforced by the software.
The cost is flexibility: it’s tuned and locked to the M5 timeframe, so swing traders and multi-asset traders are out of scope.
And the loss worth acknowledging: PipTrend has far fewer total indicators than Zeiierman’s 80+ library.
If your priority is tool variety, nine buy/sell algorithms, strategy bots, and invite-only scripts to experiment with, Zeiierman offers more raw material for roughly $37.99/mo annually.
PipTrend is deliberately narrower, because a unified workflow and a sprawling toolbox are different products.
Which Trading Style Fits Which System
Indicator choice should follow your timeframe and your temperament, not the other way round. Here’s how the seven systems map to real trading styles.
- Day traders (1m to 15m charts): PipTrend. Session killzones for Asian, London, New York AM and New York PM, automatically adjusted to your timezone, plus VWAP and liquidity-level entries. Intraday precision comes from knowing which level to trade, which is where lagging-only oscillator tools like Market Cipher leave you guessing.
- Swing traders: PipTrend. Read direction from the H8 and Daily color-coded candles, then use the MTF table to confirm alignment before entry. If structure and ICT concepts are your primary strategy rather than trend-following, LuxAlgo or Flux Charts are reasonable alternatives with deeper order-block and premium/discount tooling.
- Long-term investors: PipTrend’s Weekly and Monthly candles. Gray-to-green on a Monthly chart is a major trend-timing signal. Lagging-only moving-average systems work fine for this horizon, but they confirm later and can cost you a meaningful chunk of entry price on multi-year positions.
- Prop-firm challenge traders: PipTrend. The fixed three-step process (signal for direction, liquidity level for entry, MTF table for exits) is exactly the kind of repeatable rule set that keeps you inside drawdown limits. Large discretionary toolkits like Zeiierman or LuxAlgo Ultimate give you more freedom, and freedom is what fails most challenges.
- Scalpers wanting a rigid single-timeframe mechanical system: AlgoXpert. The M5-only workflow with its 35-check entry orb is purpose-built for exactly this, and for that narrow use case it may outperform a multi-timeframe system. Starts at $58/mo on the yearly plan with a seven-day free trial.
- Traders prioritizing indicator variety and DIY strategy building: LuxAlgo or Zeiierman. If you enjoy assembling your own confluence, running your own indicator backtesting, and tweaking parameters, a guided workflow will feel restrictive. LuxAlgo’s free tier is a sensible place to start; Zeiierman’s 80+ library at ~$37.99/mo annually gives you the most to play with.
- Crypto traders focused on divergence: Market Cipher. If your edge is reading momentum waves and hidden divergence on lower timeframes, it’s a recognized workflow with an established community. Budget accordingly: $600 promotional for 12 months.
- Traders who learn best from live teaching: ChartPrime Pro ($67/mo or $489/yr). Five live strategy sessions weekly plus daily market insights make it the most education-forward option here.
FAQ
What is the difference between leading and lagging indicators?
Leading indicators predict moves before they’re confirmed; lagging indicators confirm moves after they’ve started. Leading tools trade speed for accuracy, lagging tools trade accuracy for speed.
Leading examples include RSI, Stochastic, order blocks, and fair value gaps. Lagging examples include moving averages, MACD, and ADX.
The practical consequence: leading indicators give you better entry prices with more false signals, lagging indicators give you fewer false signals with worse entry prices.
Is RSI a leading or lagging indicator?
RSI is a leading indicator. It’s a momentum oscillator that measures the speed and magnitude of recent price changes to anticipate overbought and oversold reversals before they appear in price structure.
Because it leads, it also whipsaws. RSI can hold above 70 through an entire sustained uptrend, which is why using it alone as a reversal trigger in trending markets is a common and expensive mistake.
Is MACD leading or lagging?
MACD is technically a lagging indicator, despite being marketed and used as a signal-crossover tool. It’s calculated from two exponential moving averages, and anything derived from a moving average inherits that lag by construction.
The histogram and signal-line crossovers feel responsive on a chart, which is why the confusion persists.
But the underlying data is smoothed past price, so MACD confirms trend rather than predicting it.
Which is better, leading or lagging indicators?
Neither is universally better; performance depends on market condition rather than indicator type.
Leading indicators outperform in ranging and reversal-prone conditions. Lagging indicators outperform in strong, sustained trends.
Since nobody knows which regime is active until after the fact, relying on one type exclusively means accepting long stretches of underperformance.
That’s the case for combining them.
Can you use leading and lagging indicators together?
Yes, and combining both is standard professional practice. The workflow is straightforward: a leading tool flags a forming setup, then a lagging confirmation layer validates direction before you enter.
PipTrend’s structure is a working example.
Gray candles mark the forming trend phase (leading), and the 12-timeframe BUY/SELL/NEUTRAL table confirms whether higher timeframes agree (lagging) before you place the order. A whipsaw filter handles the choppy conditions where leading signals fail most often.
What are the best leading and lagging indicators for trading?
The best practical combination for most traders is a leading trend and momentum layer with a whipsaw filter, precise entry levels, and multi-timeframe confirmation. Not three unrelated indicators, three components that each do one job.
Concretely: color-coded trend detection or an oscillator for early direction, VWAP plus session highs and lows plus supply and demand zones for the entry price, and a multi-timeframe table or higher-timeframe moving-average bias for confirmation.
Add candle-close confirmation so signals don’t repaint, and position sizing rules so a false signal costs you a fixed, survivable amount.
That’s the structure PipTrend is built around, which is why it’s our recommendation for 2026. At $40/mo on the annual plan, with a 3-day free trial, a 30-day money-back guarantee, and a public results page showing verified cTrader statements including losses, it’s the most testable and lowest-risk way to run a combined leading-plus-lagging process without assembling one yourself.
Sources
Risk Disclaimer: Trading involves risk. Past performance doesn't guarantee future results. Only trade with money you can afford to lose. PipTrend is a tool to assist your trading decisions, not financial advice.