
TradingView has become the platform of choice for millions of traders worldwide, and for those focused on Indian markets, mastering tradingview nifty analysis is essential. The Nifty 50 Index represents India's top companies and serves as the primary benchmark for market sentiment, liquidity, and directional bias. Whether you're a day trader scalping intraday moves or a swing trader capturing multi-day trends, understanding how to leverage TradingView's powerful features for Nifty analysis can transform your trading performance and decision-making clarity.
Understanding TradingView Nifty Setup and Navigation
TradingView offers comprehensive coverage of Indian markets, with the Nifty 50 Index available through multiple tickers and derivative instruments. Traders can access spot index data, futures contracts, and ETF variations that track the benchmark index.
The platform's interface provides real-time streaming data for tradingview nifty charts, allowing you to monitor price action as it unfolds during market hours. Navigation starts with the symbol search function, where entering "NIFTY" reveals various options including NSE:NIFTY50, futures contracts for different expiries, and related instruments.
Key Chart Types for Nifty Analysis
TradingView supports multiple chart styles that serve different analytical purposes:
- Candlestick charts reveal price action psychology through open, high, low, and close data
- Heikin Ashi candles smooth out noise and highlight trend strength
- Renko charts filter time-based volatility to focus purely on price movement
- Line charts simplify analysis when viewing multiple timeframes simultaneously
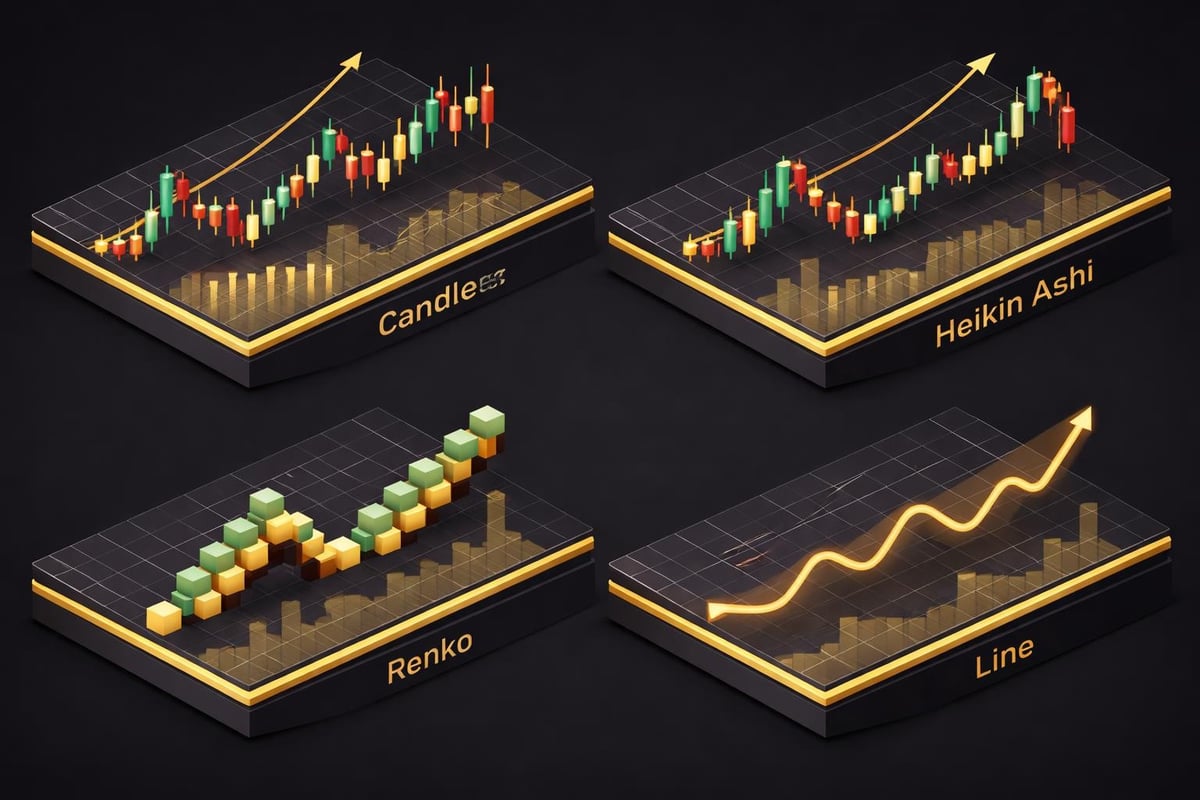
Most professional Nifty traders default to candlestick charts for their balance of detail and readability. The platform allows customization of timeframes from one-second intervals to monthly bars, giving you complete flexibility in how you analyze market structure.
Essential Technical Indicators for TradingView Nifty Trading
The technical analysis overview provided by TradingView summarizes multiple indicator categories, helping traders quickly assess market conditions. However, understanding which indicators to apply and when to trust their signals separates profitable traders from those who chase every crossover.
Trend Identification Indicators
Moving averages form the foundation of trend analysis on tradingview nifty charts. The most widely used configurations include:
| Indicator | Settings | Purpose |
|---|---|---|
| 20 EMA | Exponential, Close | Short-term trend and dynamic support/resistance |
| 50 SMA | Simple, Close | Intermediate trend confirmation |
| 200 SMA | Simple, Close | Long-term trend and major institutional levels |
When the 20 EMA sits above the 50 SMA, which in turn trades above the 200 SMA, you're observing a bullish alignment that indicates strong upward momentum. This hierarchy reverses in downtrends, creating clear visual confirmation of market direction.
The Supertrend indicator has gained massive popularity among Indian traders for its simplicity and effectiveness. Applied to Nifty charts, it plots dynamic stop-loss levels that adapt to volatility, providing both entry signals and risk management guidance in a single visual tool.
Momentum and Oscillator Applications
Momentum indicators help identify overbought and oversold conditions, warning traders when trends may be losing steam:
- RSI (Relative Strength Index) at 14 periods identifies divergences and extreme readings
- MACD (Moving Average Convergence Divergence) shows momentum shifts through histogram changes
- Stochastic Oscillator pinpoints short-term reversal opportunities in ranging markets
The challenge with oscillators on tradingview nifty analysis comes during strong trending periods. RSI can remain overbought for weeks during bull runs, generating premature exit signals that force traders out of profitable positions. This is where multi-timeframe analysis becomes critical.
Multi-Timeframe Analysis Strategy for Nifty
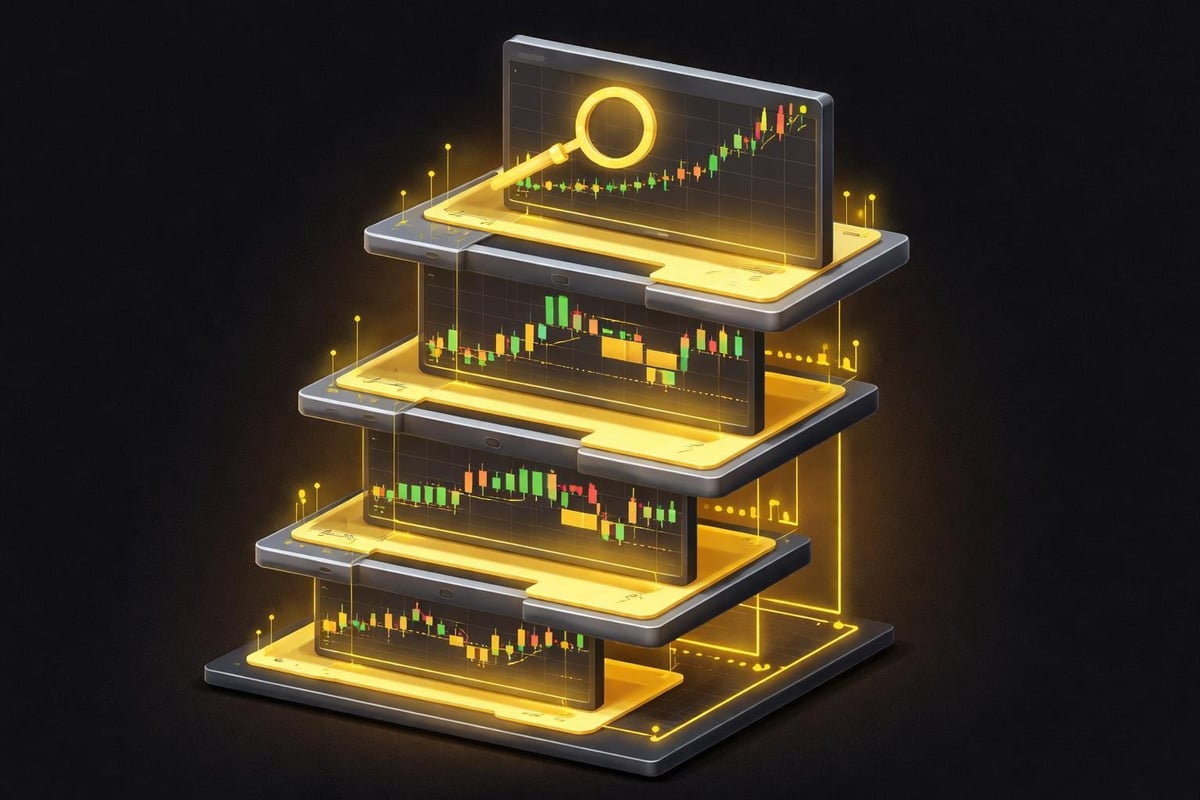
Professional traders never rely on a single timeframe when analyzing tradingview nifty movements. The platform's layout system allows you to display multiple timeframes simultaneously, creating a complete picture of market structure from macro to micro perspectives.
A typical multi-timeframe setup includes:
- Daily chart for overall trend direction and key support/resistance zones
- 4-hour chart for intermediate swing structure and pattern development
- 1-hour chart for entry timing and stop-loss placement
- 15-minute chart for precise execution and intraday momentum shifts
The principle is straightforward: you want alignment across timeframes before committing capital. If the daily chart shows a bullish trend, the 4-hour chart displays higher highs and higher lows, and the 1-hour chart breaks above a consolidation pattern, you've identified a high-probability setup with multiple confirmations.
Support and Resistance Mapping
TradingView's drawing tools enable precise mapping of key levels that Nifty respects repeatedly. Recent technical trend reports highlight how institutional traders focus on specific support and resistance zones, creating self-fulfilling prophecies as retail traders also monitor these levels.
Horizontal line tools should mark:
- Previous day's high and low for intraday trading
- Weekly and monthly pivots for swing positions
- Major psychological levels (round numbers ending in 00 or 500)
- Historical swing points where significant reversals occurred
Fibonacci retracement tools add another layer by identifying potential pullback levels during trends. When Nifty rallies strongly, the 38.2%, 50%, and 61.8% retracement levels often provide low-risk entry opportunities for continuation trades.
Volume Analysis and Liquidity Zones
Volume confirms price movement validity. On tradingview nifty charts, volume bars display at the bottom of your screen, showing the number of contracts or shares traded during each period. High volume during breakouts suggests institutional participation and increases the probability of sustained moves.
The Volume Profile indicator reveals where the most trading activity occurred across a price range, identifying fair value zones where supply and demand reached equilibrium. These zones often act as magnets, pulling price back when it extends too far in either direction.
Session-Based Analysis for Nifty
Indian markets operate during specific hours, but global events and overnight developments impact opening prices. TradingView allows you to overlay session markers, highlighting:
- Pre-market activity and gap scenarios
- Opening range breakouts in the first 30 minutes
- Mid-day consolidation patterns between 11:30 AM and 2:00 PM
- Power hour moves in the final 60 minutes before close
Traders who understand session dynamics gain an edge by knowing when volatility expands and when range-bound conditions typically dominate. The first and last hours generally offer the best liquidity and movement for active traders.
Alert Systems and Automation Features
One of TradingView's most powerful capabilities is its alert system, allowing traders to monitor tradingview nifty movements without staring at screens constantly. You can create alerts based on:
| Alert Type | Use Case | Example |
|---|---|---|
| Price crossing | Breakout notifications | Alert when Nifty crosses above 22,500 |
| Indicator conditions | Signal confirmations | Alert when RSI drops below 30 on daily chart |
| Drawing tool interactions | Support/resistance tests | Alert when price touches trendline |
| Custom scripts | Complex strategy rules | Alert when three conditions align simultaneously |
Alerts deliver notifications through the platform, email, or mobile app, ensuring you never miss critical setups. This automation reduces emotional decision-making by removing the temptation to force trades when conditions don't meet your criteria.
For traders seeking to enhance their edge beyond standard indicators, exploring advanced AI-driven solutions can provide the filtered, high-probability signals that separate consistent winners from those drowning in market noise.
Chart Pattern Recognition on Nifty
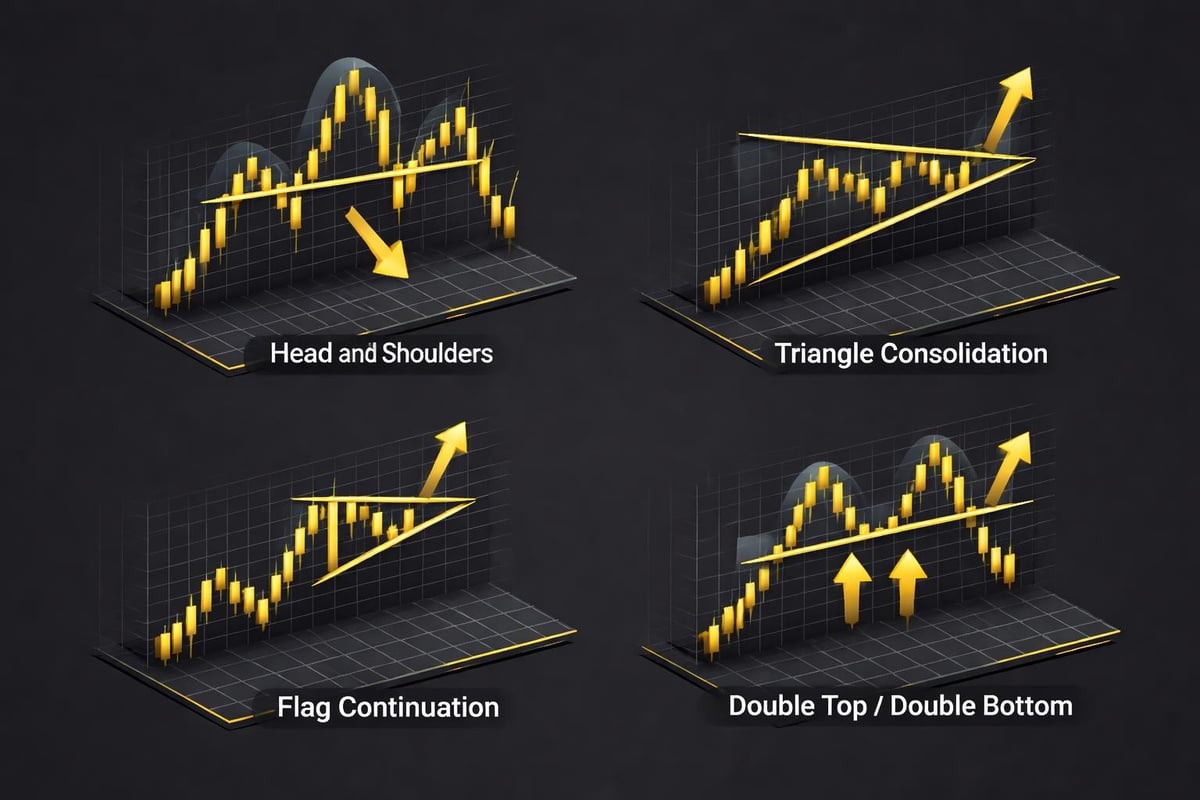
Technical patterns repeat because they reflect human psychology and institutional order flow. TradingView's pattern recognition tools can automatically detect formations on tradingview nifty charts, though experienced traders develop the skill to spot them manually.
Reversal Patterns
These formations signal potential trend changes:
- Head and Shoulders appears after extended uptrends, warning of bearish reversals
- Double Tops and Bottoms indicate exhaustion and shift in control between buyers and sellers
- Rising and Falling Wedges show momentum loss despite continued price movement
Confirmation comes when price breaks the pattern's neckline or support/resistance with increased volume. False breakouts occur frequently, which is why professional traders wait for a close beyond the level rather than reacting to intraday spikes.
Continuation Patterns
These patterns suggest trends will resume after brief pauses:
- Flags and Pennants represent short consolidations during strong trends
- Triangles (ascending, descending, symmetrical) show equilibrium before expansion
- Rectangles display range-bound conditions before breakout direction becomes clear
The measured move principle helps project price targets by measuring the initial leg and projecting that distance from the breakout point. This provides objective profit targets rather than arbitrary exits.
Pine Script Customization for Nifty Strategies
TradingView's Pine Script programming language enables traders to code custom indicators and strategies specifically for tradingview nifty analysis. Even without programming experience, tutorials and guides walk you through building basic scripts that can evolve into sophisticated trading systems.
Common Pine Script applications include:
- Backtesting strategies across historical Nifty data to validate edge
- Creating custom screeners that scan for specific setup criteria
- Building hybrid indicators that combine multiple data sources
- Developing automated strategy entries and exits based on defined rules
The platform's community shares thousands of public scripts, allowing you to study proven approaches and modify them for your specific trading style. However, blindly copying strategies without understanding their logic often leads to misapplication and losses.
Risk Management Integration with TradingView Tools
Every successful trader prioritizes risk management over profit chasing. TradingView provides tools that enforce discipline and protect capital during inevitable losing streaks.
The position size calculator helps determine appropriate trade sizes based on account equity and risk percentage. If you risk 1% per trade on a ₹500,000 account, your maximum loss per trade should not exceed ₹5,000. By measuring the distance from entry to stop-loss, you calculate the exact position size that adheres to this rule.
Stop-Loss and Take-Profit Placement
Drawing tools mark your risk parameters directly on tradingview nifty charts:
- Identify your entry price based on your strategy signal
- Place stop-loss below recent swing low (for longs) or above swing high (for shorts)
- Measure the risk (distance from entry to stop)
- Calculate position size to limit loss to your risk percentage
- Set take-profit at 2:1 or 3:1 reward-to-risk ratio minimum
This systematic approach removes emotional decisions during active trades. When you define your exit points before entering, you avoid the common trap of moving stops farther away when trades go against you.
Comparing TradingView with Alternative Platforms
While several platforms offer tradingview nifty charting capabilities, TradingView's combination of features, community, and cross-device synchronization creates advantages that matter for serious traders.
| Feature | TradingView | Traditional Broker Platforms |
|---|---|---|
| Chart quality | Professional-grade | Varies widely |
| Indicator library | 100+ built-in, thousands public | Limited selection |
| Mobile experience | Full functionality | Often restricted |
| Community insights | Active social features | Minimal interaction |
| Multi-asset coverage | Global markets | Primarily domestic |
The comprehensive charting and news coverage available on TradingView surpasses most broker-provided platforms, especially for traders who monitor multiple markets and asset classes beyond just Indian equities.
The platform's pricing tiers accommodate different needs, from free basic access to premium subscriptions that unlock advanced features like multiple chart layouts, more indicators per chart, and extended historical data.
Common Mistakes When Analyzing TradingView Nifty
Even experienced traders fall into predictable traps that undermine their analysis quality and trading results. Awareness of these mistakes helps you avoid repeating them.
Overloading charts with indicators creates confusion rather than clarity. When ten different indicators contradict each other, decision-making becomes paralyzed. Focus on three to five complementary tools that measure different aspects (trend, momentum, volume).
Ignoring timeframe context leads to conflicting signals. A bullish setup on the 15-minute chart means little when the daily chart shows a strong downtrend approaching major resistance. Always assess higher timeframes first.
Chasing breakouts without confirmation results in buying the high or selling the low. Wait for candles to close beyond key levels with supporting volume before committing capital.
Neglecting to mark key levels in advance forces reactive rather than proactive trading. Spend time each day or week identifying important support, resistance, and trigger levels so you're prepared when price reaches them.
Integrating News and Fundamental Analysis
Technical analysis on tradingview nifty charts provides the "when" and "where" of trading opportunities. Fundamental analysis and news monitoring explain the "why" behind moves and help filter trades that align with broader market narratives.
TradingView includes an integrated news feed that displays relevant headlines directly on your charts. Market-moving events like:
- Reserve Bank of India policy decisions and interest rate changes
- Corporate earnings reports from Nifty constituent companies
- Global risk events affecting emerging market sentiment
- Government policy announcements impacting specific sectors
These catalysts often trigger the breakouts and breakdowns that technical patterns forecast. Combining both approaches creates a more complete trading framework than relying solely on price action.
Building a Personalized TradingView Workspace
Efficiency matters when markets move quickly. Organizing your TradingView environment for tradingview nifty trading reduces decision time and mental friction.
Create multiple chart layouts for different purposes:
- Scanning layout: Multiple watchlists with mini charts to spot opportunities across sectors
- Analysis layout: Single large chart with full indicator suite for deep dive research
- Execution layout: Entry timeframe with order panel and position monitoring
- Multi-timeframe layout: Four charts showing daily, 4H, 1H, and 15-minute perspectives
Save these layouts so you can switch between them instantly based on your current task. This organization prevents the common problem of constantly rearranging your workspace instead of focusing on the market.
Watchlists should group instruments logically. Create separate lists for Nifty itself, Bank Nifty, sector indices, and individual stocks you frequently trade. This structure allows rapid navigation without searching repeatedly for the same symbols.
Advanced Order Types and Execution Strategies
While TradingView primarily serves as a charting and analysis platform, integration with select brokers enables direct trading through the interface. Understanding advanced order types helps translate your analysis into precise executions.
Limit orders allow you to specify exact entry and exit prices, ensuring you don't chase moves or accept unfavorable fills. When your tradingview nifty analysis identifies support at 22,450, place a limit buy order at that level rather than market buying at 22,480.
Stop-limit orders combine stop triggers with limit executions, protecting against slippage during volatile conditions. If Nifty trades at 22,500 and you want to enter longs on a breakout above 22,550 but not above 22,560, a stop-limit order handles this automatically.
Bracket orders attach profit targets and stop-losses simultaneously, implementing your complete risk management plan in a single order. This reduces the risk of forgetting to place protective stops after entering positions.
Mastering tradingview nifty analysis requires understanding the platform's tools, applying proven technical principles, and maintaining disciplined risk management across all market conditions. The combination of real-time data, customizable indicators, and multi-timeframe capabilities gives you the foundation for informed trading decisions. When you're ready to eliminate conflicting signals and trade with genuine conviction backed by filtered, high-probability setups, PipTrend delivers the clarity that transforms analysis into consistent results. Your next winning trade starts with seeing what others miss.