Fibonacci Retracement Explained: A Trader's Practical Guide
On this page
Why Traders Reach for Fibonacci Levels
Price rarely moves in a straight line. It pushes, stalls, pulls back, then either continues or fails.
The question every trader wants answered is where that pullback stops.
Fibonacci retracement is a tool for mapping the likely pause points inside a pullback. It does not tell you where price will reverse.
It tells you where a reversal is more plausible than elsewhere, which is a very different claim.
That distinction matters more than anything else in this guide.
A 61.8% level is a zone worth watching, not a buy button. Traders who treat it as a guarantee end up catching falling knives with tight stops and wondering why the win rate collapsed.
A Fibonacci level is a place to start looking for evidence. It is never the evidence itself.
What follows covers the whole process as one connected system: the math behind the ratios, exact anchoring rules for uptrends and downtrends, how to rank confluence factors, what confirmation actually looks like, where invalidation sits, and how stop placement and position sizing tie back to the swing you anchored from.
One more thing to accept upfront.
These levels are probability zones, not exact prices.
Spread widens during news.
Liquidity thins in the Asian session.
Volatility stretches wicks past levels and back within seconds.
Any framework that requires price to respect a line to the pip will fail in live markets. Build for zones and you build something that survives real conditions.
What Fibonacci Retracement Actually Measures
The ratios come from a number sequence written down in 1202 by Leonardo of Pisa, known as Fibonacci. Each number is the sum of the two before it: 0, 1, 1, 2, 3, 5, 8, 13, 21, 34, 55, 89, 144, and onward.
The Ratios and Where They Come From
Divide any number in the Fibonacci sequence by the number immediately after it and the result converges on 0.618. That is the golden ratio inverse, and it is the source of the 61.8% level.
The rest follow the same pattern. Divide a number by the one two places ahead and you get 0.382. Three places ahead gives 0.236.
The 78.6% level is simply the square root of 0.618.
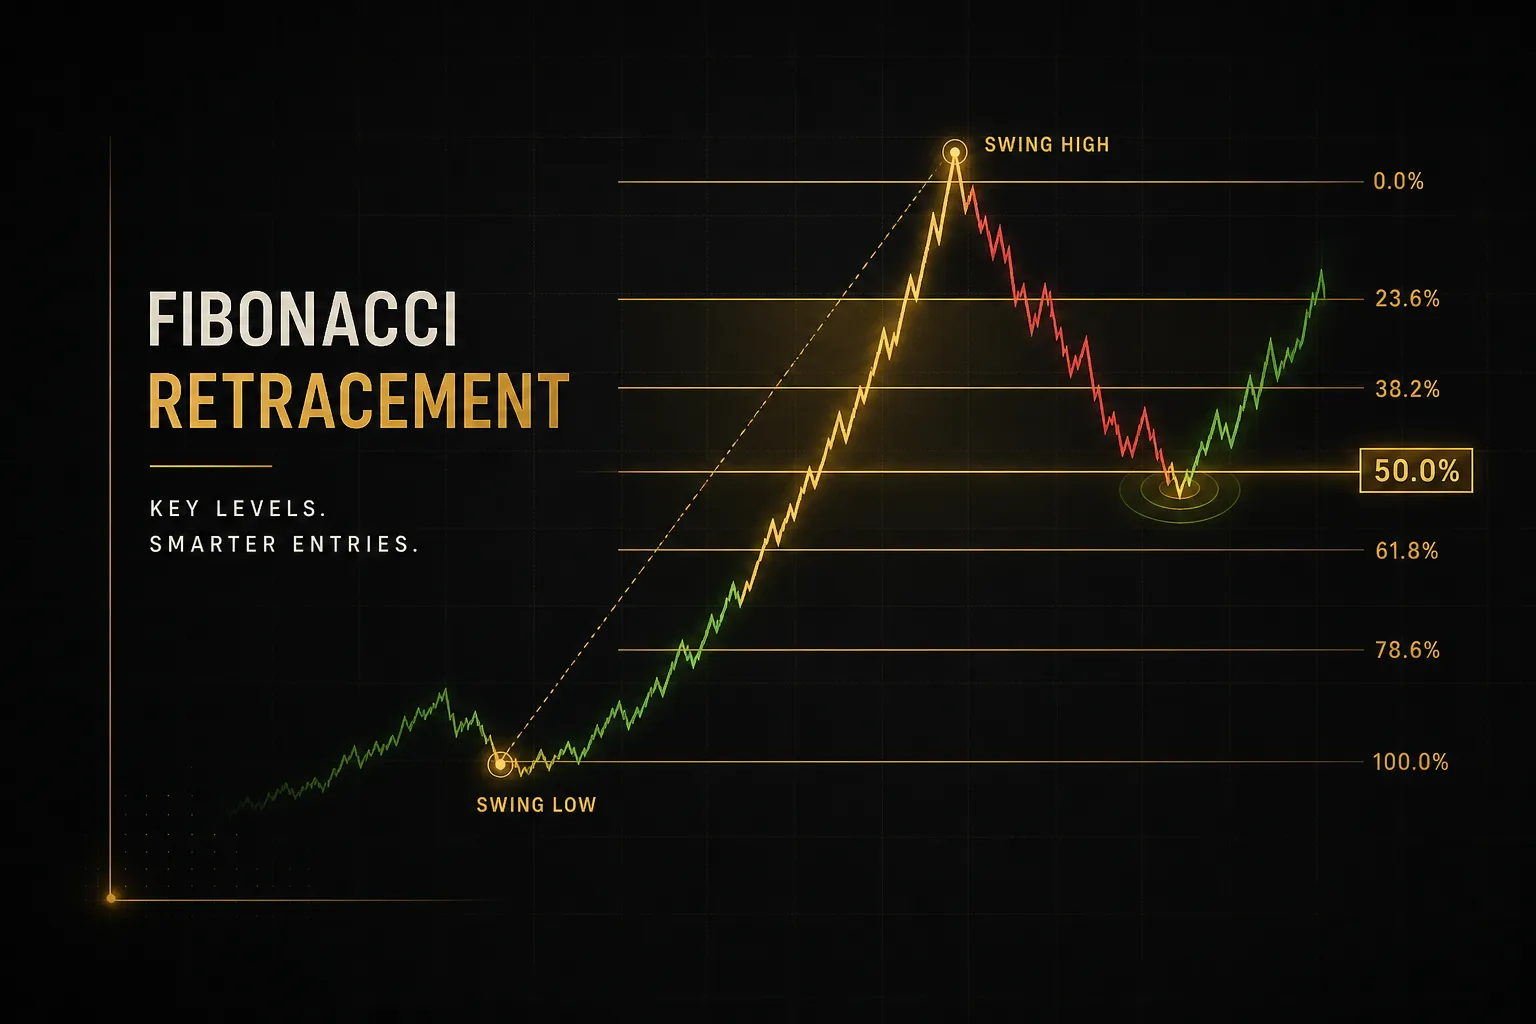
Charting platforms plot these as horizontal lines between two anchor points, dividing the vertical distance of a price move into proportional slices.
That is the entire mechanic.
The tool measures percentage retracement of a completed move, nothing more.
| Level | Mathematical Origin | Common Interpretation | Typical Context |
|---|---|---|---|
| 23.6% | Ratio of a number to the one three places ahead | Very shallow pullback; strong momentum intact | Aggressive trend continuation, often in the first leg after a breakout |
| 38.2% | Ratio of a number to the one two places ahead | Shallow to moderate pullback; trend still healthy | Common in strong trending markets and index futures |
| 50% | Not a Fibonacci ratio; Dow Theory observation | Balanced retracement; neither side dominant | Frequently watched on forex majors and equities |
| 61.8% | Golden ratio inverse; the sequence limit | Deep retracement; most widely watched zone | Classic swing entry area when structure holds |
| 78.6% | Square root of 0.618 | Near-failure retracement; last defence of the trend | Higher risk, tighter stop, lower win rate historically |
| 100% | Full retracement of the measured leg | Move fully unwound; original thesis invalidated | Treated as structure break rather than an entry zone |
Why 50% Isn’t a True Fibonacci Ratio
The 50% line appears on every Fibonacci tool ever built, and it has nothing to do with Fibonacci. It comes from Dow Theory, which observed that secondary corrections in a primary trend often retrace between one third and two thirds of the prior move.
Half is simply the midpoint of that range. Traders kept it because it works often enough to be useful, and because a huge number of market participants watch it.
That is worth being honest about.
Part of the reason 50% and 61.8% matter is that enough people place orders there to create real order flow.
The math is elegant.
The behaviour is what actually moves price.
Zones, Not Exact Prices
Price pierces levels constantly.
A stop-hunt wick through 61.8% followed by a close back above it is a completely normal event, not a failure of the tool.
Three things cause routine overshoot.
Spread widens around economic releases, so your broker’s quoted price can trade several pips beyond the level without any real transaction occurring there. Liquidity thins during session transitions, letting modest order size push price further than usual. And news volatility produces candle ranges two or three times the recent average.
The practical fix is to treat the region between 61.8% and 78.6% as a single support and resistance zone rather than two lines. Then judge the outcome on closing prices, not wicks.
A body close beyond the zone means something.
A wick through it usually means nothing at all.
Drawing the Tool Without Guesswork
Most Fibonacci mistakes are anchoring mistakes.
Get the two endpoints right and the levels do their job. Get them wrong and you are drawing lines on noise.
Anchoring an Uptrend
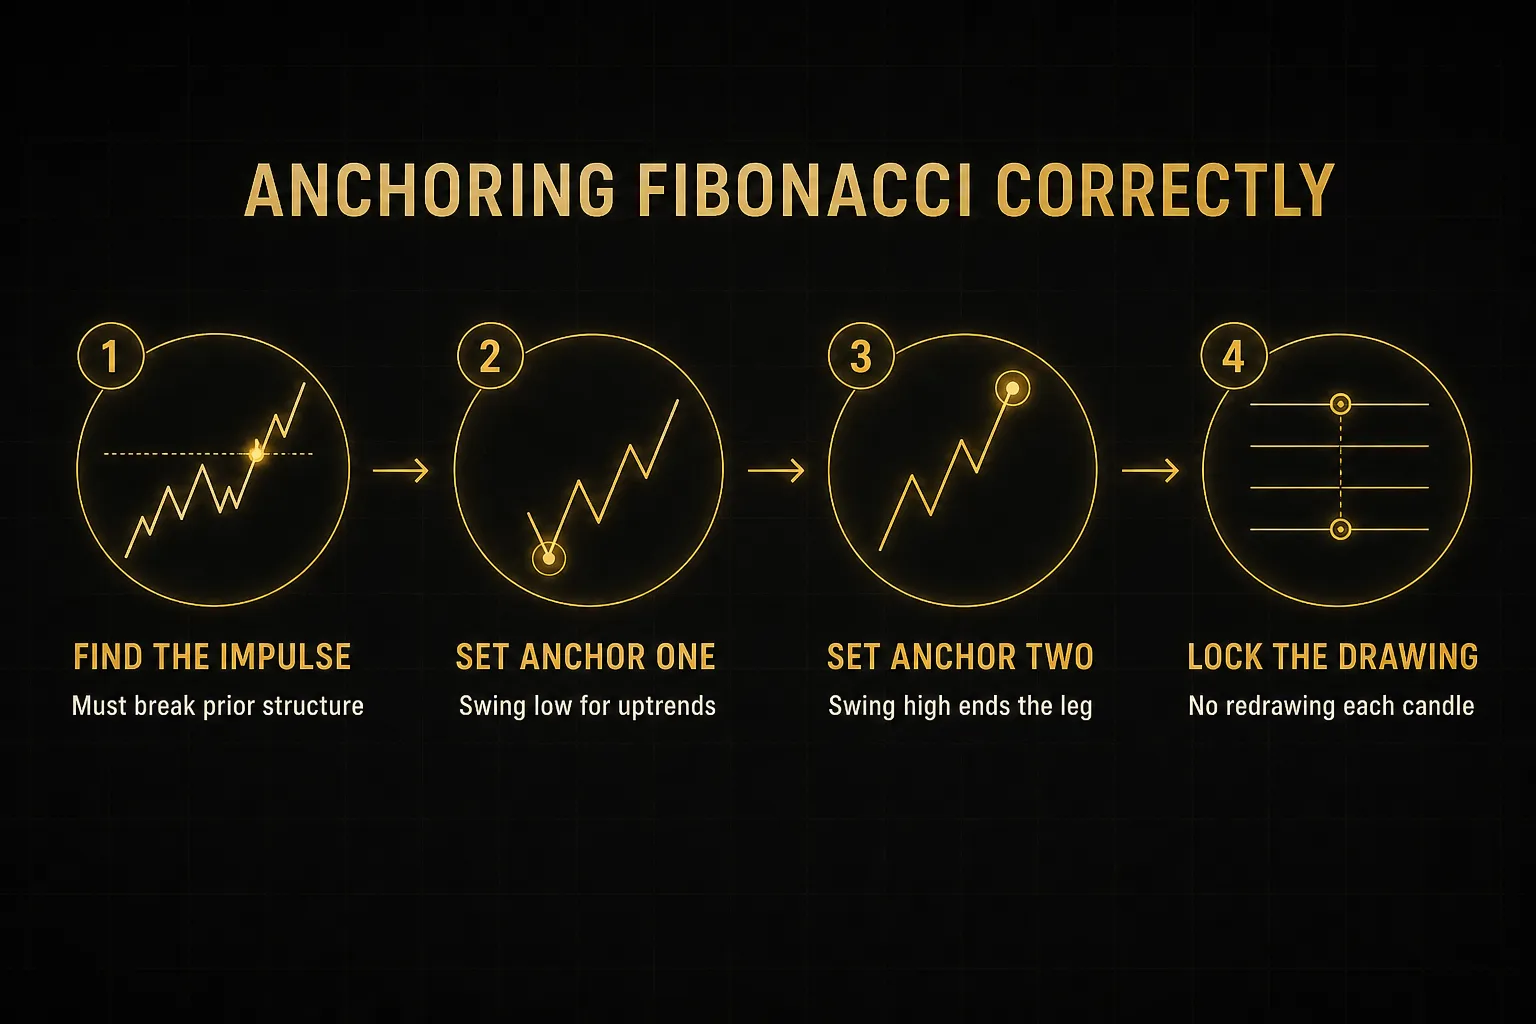
- Identify the completed impulse leg. Find a clear upward move that broke prior structure, meaning it took out a previous swing high rather than just drifting sideways.
- Click the swing low first. Anchor point one goes on the lowest price of the leg, the origin of the move you are measuring.
- Drag to the swing high. Anchor point two goes on the highest price reached before the pullback began.
- Confirm the levels sit below current price. In a bullish anchor, 23.6% sits nearest the high and 78.6% nearest the low. All retracement levels should be below the swing high, acting as potential support.
- Lock the drawing. Once the anchors are set on a valid structure, leave them alone. If you redraw after every candle, you are curve-fitting your analysis to price you already know.
Anchoring a Downtrend
- Find the impulse leg down. Look for a decline that broke a prior swing low, confirming sellers took control of market structure.
- Click the swing high first. Anchor point one sits at the highest price of the leg, the origin of the sell-off.
- Drag to the swing low. Anchor point two sits at the lowest price before the bounce started.
- Confirm the levels sit above current price. Retracement levels now act as potential resistance, with 61.8% typically the deepest area a corrective bounce reaches before trend continuation resumes.
- Note the invalidation point. A close above the 100% level means the entire decline has been unwound and your bearish thesis is gone.
Choosing Swing Points That Matter
Not every high is a swing high.
A meaningful swing point is one where structure actually changed hands, where the move that followed broke a prior level rather than wandering a few pips.
Three filters help.
First, the swing should be visible on the timeframe above the one you are trading, since a level nobody else can see attracts no orders. Second, prefer swings that produced a decisive break of prior structure. Third, when a wick and a closing price disagree, favour the structure that closing prices confirm, because closes reflect where the market agreed value sat.
Constant redrawing is the most common self-inflicted wound.
Each redraw shifts every level, which means the “confluence” you found was manufactured after the fact.
Pick your anchors from completed structure and let the trade prove you right or wrong.
Linear vs Logarithmic Scale
On a linear chart, equal vertical distance means equal dollar movement. On a logarithmic chart, equal vertical distance means equal percentage movement.
That difference is trivial over small ranges and enormous over large ones.
Take an asset that runs from $1,000 to $60,000. On a linear scale, the 61.8% retracement sits near $37,500.
On a log scale, the same retracement lands materially lower, because the tool now measures proportional decline rather than absolute dollars.
Use logarithmic scale for any instrument that has moved more than roughly 100% within the range you are measuring. That covers most crypto charts, high-growth equities, and long-term index studies.
For intraday forex, where a major pair might move 0.6% in a session, linear is fine and simpler.
Turning a Zone Into a Trade Signal
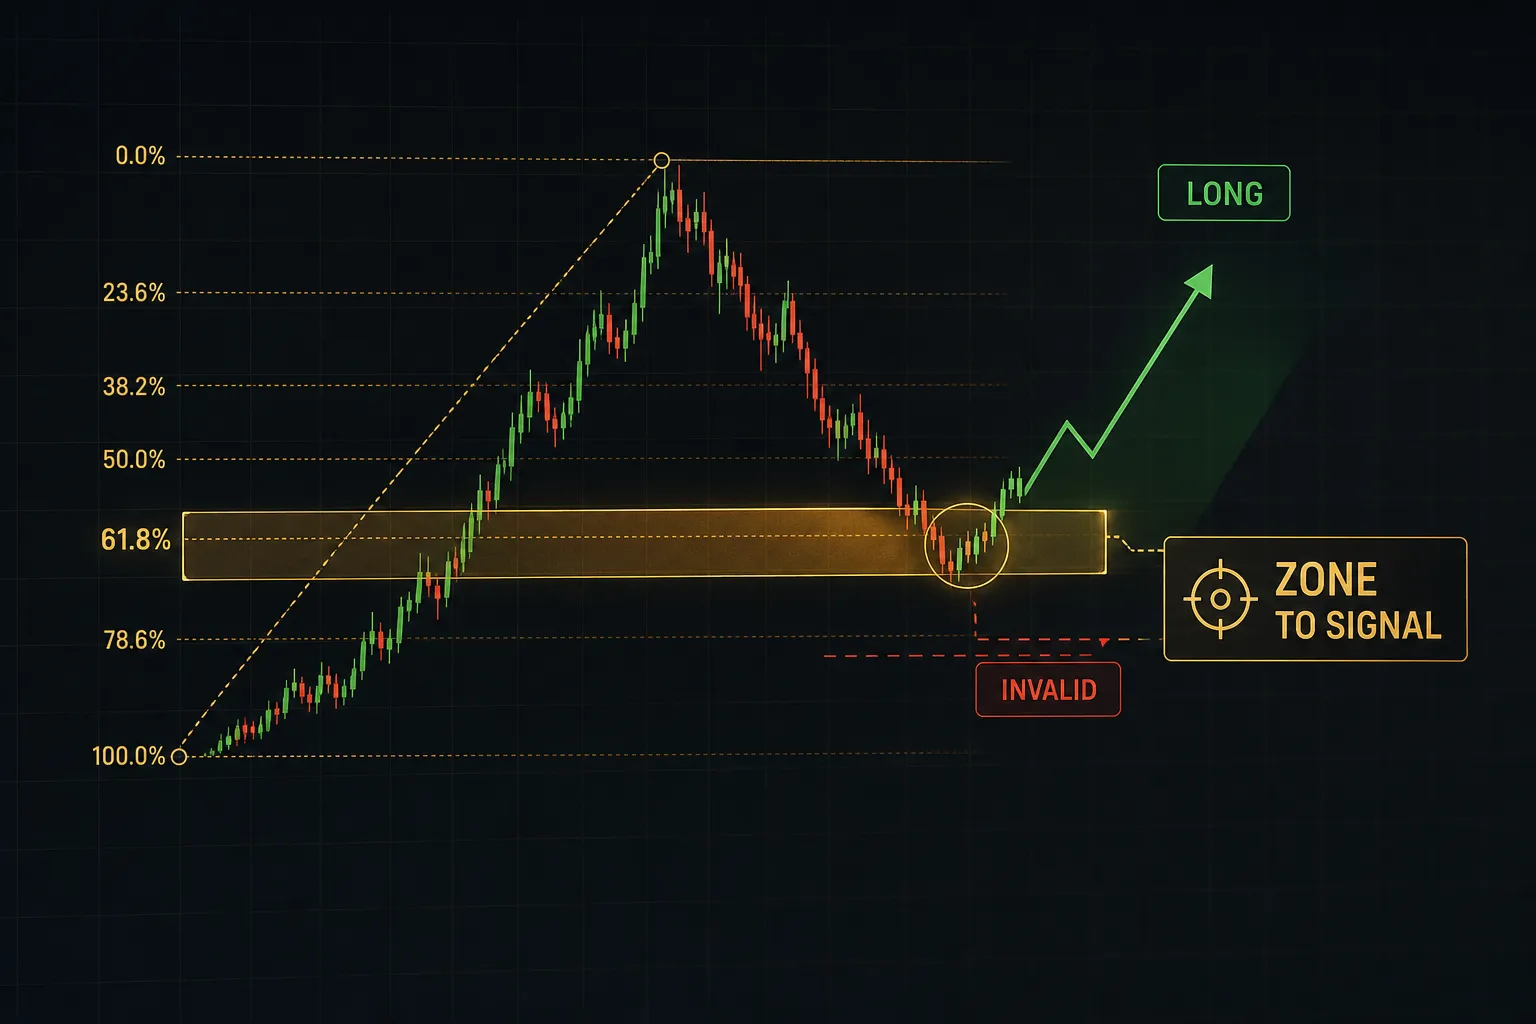
Here is the uncomfortable truth about Fibonacci in isolation: price touches these levels constantly, and most touches produce nothing tradeable.
The level is a filter for attention, not a trigger for orders.
Ranking Your Confluence Factors
Confluence means multiple independent reasons pointing at the same price area. But not all reasons carry equal weight, and stacking five weak signals does not equal one strong one.
Rank them in this order.
Market structure comes first, because a Fib level inside an uptrend that is still printing higher highs and higher lows is a fundamentally different proposition than the same level in a trend that just broke down.
Second, prior support and resistance that was already respected. If the 61.8% level lands on a horizontal zone that rejected price twice in the last month, you have two independent sources agreeing.
Third, trend direction on the higher timeframe. Fourth, volume behaviour, specifically whether the pullback is arriving on declining volume, which suggests a correction rather than a distribution.
Fifth and last, the price action confirmation candle. A bullish engulfing, a pin bar with a long lower wick, or simply a close back above the level after a probe below it.
This is your entry trigger, and it should be the final piece, never the first.
If your only reason for the trade is that price touched a line, you do not have a setup. You have a coincidence.
Retracement Entry vs Breakout Retest
These two setups look similar on a chart and behave differently in practice. Knowing which one you are in changes your stop, your target, and your expectations.
A pure retracement setup happens inside an established trend. The trend was already moving, price pulled back into the 38.2% to 61.8% region, and you are betting on trend continuation.
Structure has not broken.
Your risk is that the pullback becomes a trend reversal.
A breakout-and-retest setup is different.
Price broke a significant level, then returned to it. Here the Fibonacci tool is anchored to the breakout leg itself, and the retracement level ideally lines up with the broken level, now flipping from resistance to support.
The confluence is what makes it strong, not the Fib alone.
Retests generally offer tighter invalidation, because a close back below the broken level kills the idea immediately. Retracements inside trends usually need wider stops and correspondingly wider targets to keep the risk-to-reward ratio viable.
When Timeframes Disagree
You find a beautiful daily 61.8% level. You drop to the 15-minute chart and structure is falling apart, printing lower highs into the zone. What now?
The general rule: higher timeframe context takes priority for direction, lower timeframe structure takes priority for timing. The daily zone tells you where to be interested. The 15-minute chart tells you whether buyers have actually shown up yet.
In practice, that means waiting.
If the daily zone is valid and the 15-minute is still bearish, you do not have confirmation, you have a level and a hope. The signal arrives when the lower timeframe stops making lower lows and prints a structural shift inside the higher timeframe zone.
This is exactly where a multi-timeframe confirmation dashboard earns its place. Tools like PipTrend present trend direction across 12 timeframes in a single table, so you can see at a glance whether the daily, four-hour, and one-hour agree before you commit. When ten of twelve timeframes lean the same way and your Fib zone sits in that direction, you are trading with the weight of the market.
When they are split, the honest read is that there is no edge available yet.
Alignment before entry.
That single habit removes a large share of losing trades that felt right at the time.
Stops, Targets, and Whether It Really Works
A clean setup with bad risk management is still a losing strategy over a hundred trades.
The arithmetic does not care how good the chart looked.
Invalidation and Stop Placement
Place your stop beyond the originating swing point, not just below the Fibonacci line.
This is the single most consequential adjustment most traders can make.
Why?
Because the Fib level is an arbitrary line inside a structure. The swing low that anchored your drawing is the structure.
If price closes beyond that swing, the higher low sequence is broken and your reason for the trade no longer exists.
So stop-loss placement goes a small buffer past the swing low in a long setup, or past the swing high in a short. The buffer should scale with volatility, and a common approach is roughly half of the current Average True Range on your trading timeframe.
Now the math.
If your entry sits at the 61.8% level and your stop sits past the swing low, you are risking the remaining 38.2% of the leg plus the buffer. If your target is the prior swing high, your reward is 61.8% of the leg.
That yields a ratio around 1.6 to 1 before costs.
Entering at 38.2% instead produces a much wider stop and a smaller reward, often below 1 to 1. Shallow retracement entries look safer and usually price worse.
That is the trade-off nobody mentions.
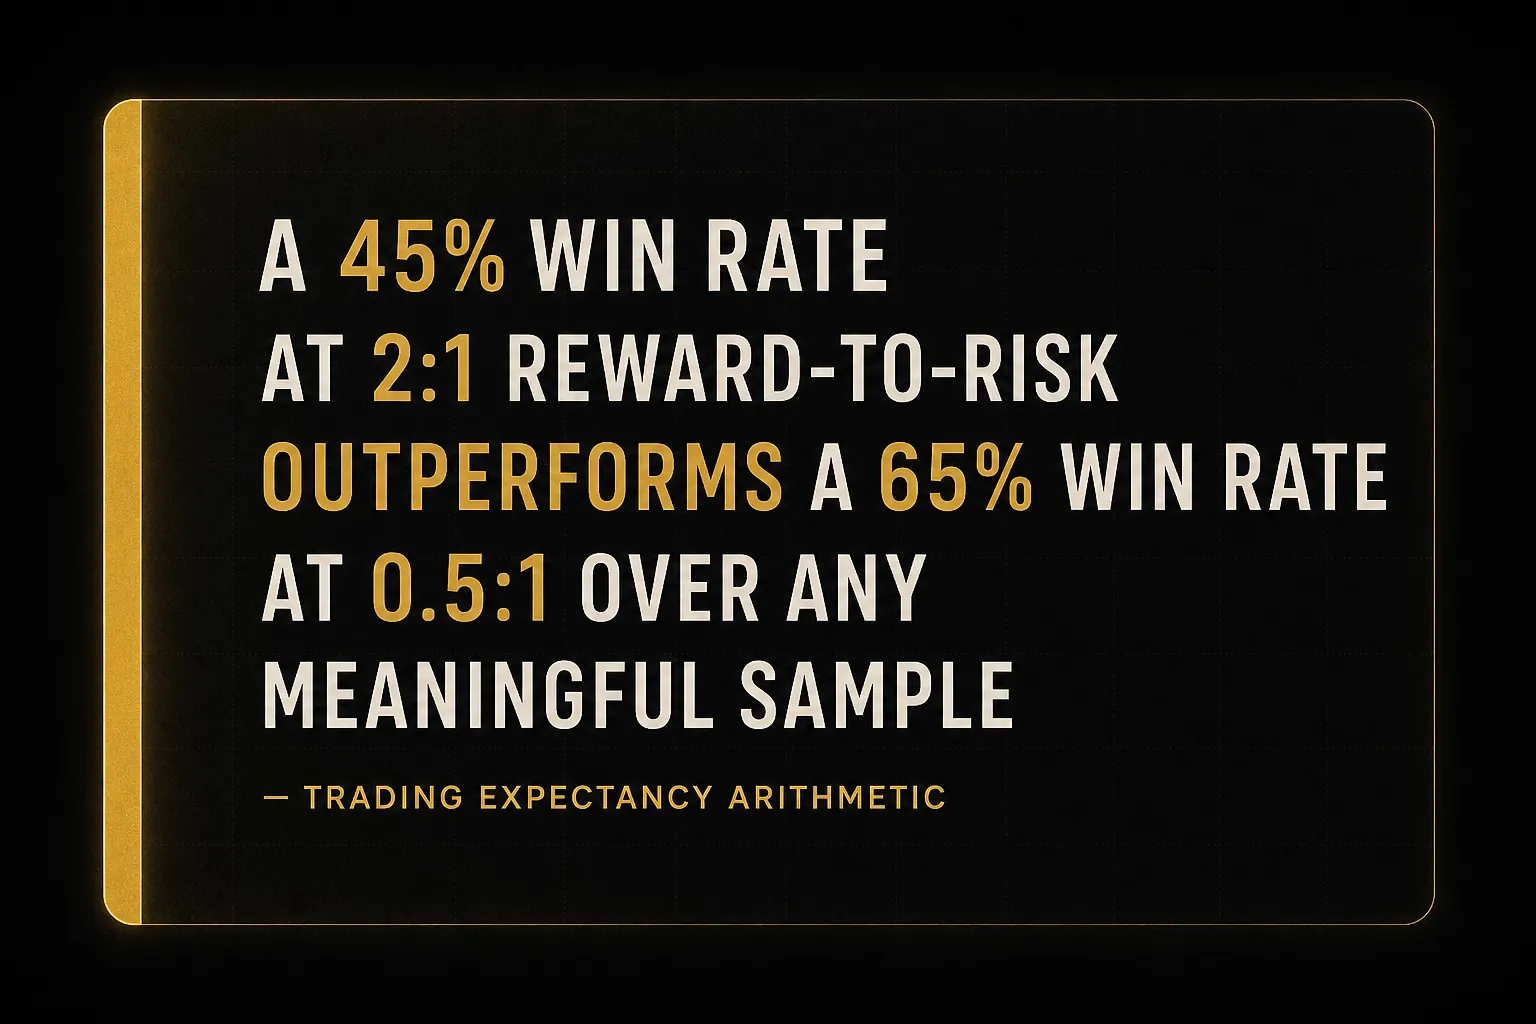
Expectancy is what actually matters: win rate multiplied by average win, minus loss rate multiplied by average loss. A setup that wins 45% of the time at 2 to 1 is profitable. A setup that wins 65% of the time at 0.5 to 1 is not.
A visually perfect 61.8% bounce with a wide stop and a nearby target is a bad trade wearing good clothes.
Which Markets and Timeframes Work Best
Fibonacci levels behave best where liquidity is deep and participation is broad. Forex majors, large-cap equities, index futures, and the largest crypto pairs fit that description. Thinly traded small caps and exotic currency crosses do not, because a handful of orders can push price straight through any level.
Timing matters as much as instrument.
On EUR/USD, a 61.8% zone tested during the London and New York overlap has real order flow behind it. The same zone tested at 3am London time, in thin Asian liquidity, is far more likely to be probed and abandoned.
For swing trading on four-hour and daily charts, Fibonacci is at its most useful, because swing points are unambiguous and stops have room to breathe. For day trading on 15-minute and one-hour charts, it works when anchored to session-defining swings rather than every minor wiggle.
For scalping below the five-minute chart, honestly, the edge thins fast. Spread and commission consume a large share of the move, and the swing points are too small to be meaningful to anyone else.
Nobody is placing institutional orders at your two-minute 38.2% level.
Does It Actually Work, or Is It Self-Fulfilling?
Partly self-fulfilling, and that is fine.
There is no evidence that markets obey the golden ratio through some natural law. There is plenty of evidence that a large number of traders and algorithms place orders at these levels, which concentrates liquidity there and produces genuine reactions.
A self-fulfilling level still generates tradeable order flow.
What it does not do is guarantee direction.
Concentrated orders can be absorbed and run through, which is precisely why confirmation is non-negotiable.
Be sceptical of backtests, including your own. Three pitfalls contaminate most Fibonacci research:
- Look-ahead bias. Anchoring to a swing high that you can only identify because you already know price turned there. In live trading, that high was not confirmed at the time.
- Subjective swing selection. Two competent traders will anchor the same chart differently, producing different levels and different results. Any rule that cannot be coded is hard to validate.
- Cherry-picked examples. Every Fibonacci tutorial shows the chart where 61.8% held perfectly. The interesting sample is the set of every 61.8% test in a period, including the ones that failed.
The honest conclusion: Fibonacci retracement is a useful framework for locating high-attention areas, with no independent predictive power on its own. Combined with structure, trend, and confirmation, it becomes a repeatable process.
Used alone, it is decoration.
Fibonacci Retracement FAQs
What is the 61.8% Fibonacci retracement level?
The 61.8% level is the golden ratio retracement, derived by dividing any Fibonacci number by the number that follows it. It marks a deep pullback where roughly two thirds of the prior move has been given back.
It is the most widely watched retracement level, which is part of why it produces reactions. Treat it as a zone extending toward 78.6%, and require a confirming close before acting.
What is the best Fibonacci retracement level to use?
There is no single best level, but 61.8% and 50% attract the most attention and generally offer the better risk-to-reward ratio for entries. Deeper entries mean tighter stops relative to the target.
In strong trends, shallower 38.2% pullbacks are common but produce wider stops. Choose based on where your invalidation sits, not on which line looks prettiest.
How do you use Fibonacci retracement for entry and exit?
Enter on a confirmation signal inside the retracement zone, not on the touch itself. Wait for a candle close that shows the zone rejecting price, then place your stop beyond the originating swing point.
For exits, use the prior swing high or low as a first target and Fibonacci extension levels beyond it for the remainder. Scaling out at the first target and trailing the balance is a common approach.
Is Fibonacci retracement accurate?
Fibonacci retracement is accurate as a map of probable reaction zones, not as a precise price predictor. Price routinely overshoots levels on wicks due to spread, thin liquidity, and news volatility.
Accuracy improves substantially when levels align with market structure, prior support and resistance, and higher timeframe trend. Used alone, hit rates are close to random.
What is the difference between retracement and extension in Fibonacci?
Retracement measures a pullback within a completed move, while Fibonacci extension projects beyond it to estimate where the next leg might end. Retracement levels fall between 0% and 100% of the original leg.
Extension and Fibonacci projection levels sit past 100%, commonly at 127.2%, 161.8%, and 261.8%. Retracements find entries; extensions find targets.
How do you use Fibonacci retracement in forex trading?
Anchor to clear session or daily swing points on liquid major pairs, then wait for confirmation during high-liquidity hours. The London and New York overlap produces the most reliable reactions.
Account for spread when placing stops, especially around scheduled news. Levels tested in thin Asian session liquidity fail more often than the same levels tested at peak volume.
The Bottom Line on Fibonacci Levels
One habit separates traders who profit from Fibonacci from traders who collect stories about it. Treat every zone as a place to look for confirmation, never as a signal in itself.
Here is the decision rule, and it is short enough to keep on a sticky note. If market structure supports the direction, the higher timeframe trend agrees, and a candle closes in confirmation inside the zone, the trade is worth considering.
If any one of those three is missing, wait.
Waiting is the hard part.
It feels like inaction while price runs without you. But the trades you skip because structure disagreed are the same trades that would have taken your stop out three candles later.
Pair your Fibonacci work with objective inputs rather than more discretionary lines. Knowing whether the daily, four-hour, and one-hour trends actually align before you commit turns a subjective drawing exercise into a filtered process.
Multi-timeframe confirmation tools handle that read in seconds.
The levels will not improve.
Your selectivity around them can, and that is where the consistency comes from.
Sources
Risk Disclaimer: Trading involves risk. Past performance doesn't guarantee future results. Only trade with money you can afford to lose. PipTrend is a tool to assist your trading decisions, not financial advice.