
You've been there. Price is climbing, your gut says buy, but two candles later you're stopped out watching the move continue without you. Or worse, you enter a sell signal only to see it reverse into a breakout that wipes your account progress for the week. The problem isn't your discipline or your chart reading skills. The problem is you're trading without a structured buy sell indicator that filters real opportunities from market noise.
A buy sell indicator is a technical tool that analyzes price action, momentum, and trend structure to generate entry and exit signals. The best ones don't just flash arrows on your chart. They combine multiple confirmation layers so you're only trading when probability is stacked in your favor. That means fewer losing trades, less second-guessing, and more confidence in your setups.
What Makes a Buy Sell Indicator Actually Reliable
Most traders download the first free indicator they find and wonder why it fails in live markets. The difference between a useful buy sell indicator and chart clutter comes down to three factors: lag, repainting, and confirmation logic.
Lag is unavoidable because indicators calculate from past data. A moving average crossover will always confirm after price has already moved. But excessive lag means you're entering trades after the best risk-reward is gone. Look for indicators that balance responsiveness with reliability. A 5-period moving average reacts faster than a 50-period, but it also whipsaws more often. The sweet spot for most intraday traders is between 10 and 20 periods on your core entry timeframe.
Repainting is when an indicator changes its historical signals after the fact. You backtest and see perfect entries, but in real time those signals appear and disappear or shift positions. This destroys trust and profitability. Any serious buy sell indicator should be non-repainting, meaning once a signal prints, it stays fixed even as new candles form.
Confirmation logic separates professionals from gamblers. A single condition like price crossing a moving average generates too many false signals. Effective indicators stack conditions. For example, a buy signal might require price above the 50 EMA, RSI rising from below 40, and the current candle closing in the top 30% of its range. Each filter removes low-probability setups.
How Buy Sell Indicators Use Momentum and Oscillators
The core of most buy sell indicator systems is oscillator analysis. Oscillators measure momentum by comparing recent price action to historical ranges. When momentum shifts, price often follows. That shift is your signal.
The Relative Strength Index is the foundation for thousands of custom indicators. RSI measures the magnitude of recent price changes on a 0-100 scale. Traditional buy signals occur below 30 when RSI turns upward, and sell signals above 70 when it turns down. But in strong trends, RSI can stay pegged in overbought or oversold territory for hours or days. That's why experienced traders add trend filters. Only take RSI buy signals when price is above a key moving average. Only take sells when price is below.
The Ultimate Oscillator improves on single-period momentum tools by blending short, medium, and long-term price action. This reduces the whipsaw that plagues faster oscillators. When the Ultimate Oscillator crosses above 50 after a dip below 30, you're seeing momentum shift across multiple timeframes simultaneously. That's a higher-probability buy signal than a simple RSI bounce.
Stochastic oscillators compare the current close to the recent high-low range. Settings of 14,3,3 are standard, but many intraday traders tighten to 8,3,3 for faster signals. A stochastic buy signal occurs when the %K line crosses above %D below the 20 level. The key is waiting for the crossover, not just the oversold reading. Price can remain oversold during a waterfall decline. The crossover shows buyers are stepping in.
Multi-Timeframe Confirmation: The Missing Piece in Most Indicators
You can have a perfect buy sell indicator setup on the 5-minute chart, but if the hourly chart shows a strong downtrend, your trade is swimming against the current. Multi-timeframe analysis turns mediocre signals into high-conviction entries.
Start with your entry timeframe. If you trade the 15-minute chart, that's where you'll execute. But before you click buy, check the 1-hour and 4-hour charts. You want trend alignment. If the 4-hour shows an uptrend, the 1-hour recently bounced off support, and your 15-minute just flashed a buy signal, all three timeframes agree. Your win rate on those setups will be 20-30% higher than random 15-minute signals.
The exact multiples don't matter as much as the relationship. A good rule is 1:4:16. If you trade the 5-minute, check the 20-minute and 80-minute (or 1-hour as a close proxy). If you trade the 1-hour, check the 4-hour and daily. This gives you immediate context (entry timeframe), short-term bias (middle timeframe), and dominant trend (higher timeframe).
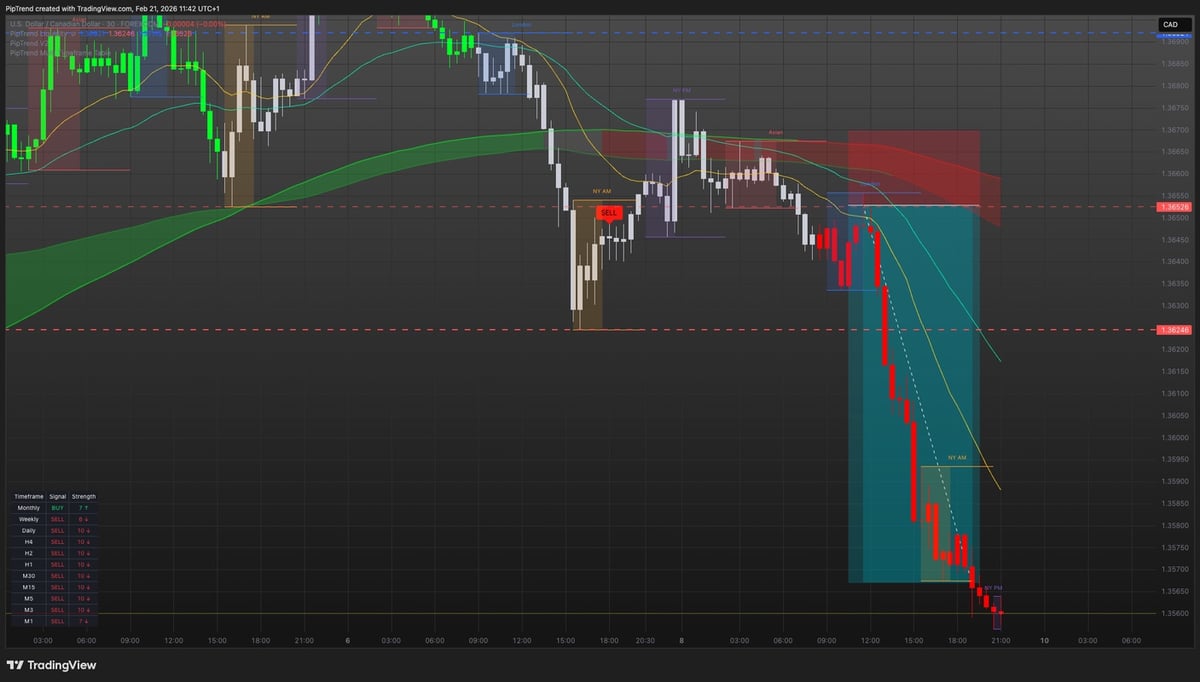
Most standalone indicators show signals on one timeframe. You're forced to manually flip charts and interpret whether alignment exists. This is where integrated systems shine. A quality buy sell indicator will display multi-timeframe trend status directly on your entry chart, often as a table or dashboard. Green across all timeframes? High probability. Mixed colors? Wait for alignment or reduce position size.
When to Ignore Your Buy Sell Indicator
Even the best indicator is wrong sometimes. Knowing when to override or skip a signal separates consistent traders from those who follow tools blindly.
Ignore buy signals within 10 pips of major resistance. Price might bounce there, but the risk-reward is terrible. You're entering where smart money is selling. The same applies to sell signals near major support. Wait for a breakout and retest, or find a better location.
Skip signals during the first 30 minutes of a new session if you trade forex or futures. The New York open, London open, and Asian session transitions create volatility spikes that trigger false signals. Price often whipsaws in both directions before establishing a true trend. Let the session settle, then trade your indicator signals with the established momentum.
Never trade a buy sell indicator signal within 15 minutes of high-impact economic news. NFP, FOMC decisions, CPI releases, and central bank announcements override all technical setups. You might get a picture-perfect buy signal two minutes before NFP, but the news will decide price direction regardless of your indicator. Mark your economic calendar and stay flat during major releases.
Volume confirms or invalidates signals. A buy signal on declining volume is suspect. Buyers aren't stepping in with conviction. A buy signal on surging volume, especially after a pullback, shows real demand. If your platform provides volume data, add a simple volume moving average and only trade signals that occur with above-average volume.
Building Your Own Buy Sell Indicator Logic
You don't need to code an indicator from scratch to benefit from this knowledge. Understanding the logic lets you combine existing tools intelligently and set filters that match your strategy.
Start with trend direction. Add a 50-period exponential moving average to your chart. Price above is bullish context. Price below is bearish context. This is your first filter. Only look for buy signals above the 50 EMA and sell signals below it. This one rule will eliminate 40-50% of losing trades.
Add a momentum oscillator like RSI with a 14-period setting. Your second filter: only take buy signals when RSI is rising from below 50, and sell signals when RSI is falling from above 50. This ensures you're entering with momentum, not against it.
Layer in a moving average crossover for timing. A 10 EMA crossing above a 20 EMA is a simple buy trigger. The reverse is a sell trigger. But don't take the crossover alone. It must occur when your first two filters align. Price above the 50 EMA, RSI rising, and 10/20 crossover? Now you have a three-condition buy sell indicator.
Test these rules on your charts. Scroll back through 50-100 setups and note which ones would have worked. You'll see patterns. Maybe buy signals work better in the first half of the London session. Maybe sell signals need a higher RSI threshold like 60 instead of 50. Adjust based on what the data shows, not what sounds good in theory.
The Role of Alerts in Buy Sell Indicator Systems
You can't watch charts 24 hours a day. Professional traders use alerts to monitor multiple pairs and timeframes without burning out. A quality buy sell indicator should send you an alert the moment a valid signal forms, so you can review and decide whether to take the trade.
Set alerts for signal generation, not price levels. A price alert tells you EUR/USD hit 1.0500, but it doesn't tell you if conditions are right to trade. An indicator alert tells you all your filters aligned and a high-probability setup just appeared. That's actionable information.
Most modern platforms support push notifications to your phone. This matters because the best setups don't wait for you to check your charts. A momentum shift happens, your buy sell indicator fires, and you have 2-5 minutes to enter before the move extends. Mobile alerts let you catch these opportunities even when you're away from your desk.
Configure alerts with specificity. Don't just alert on every RSI cross. Alert when RSI crosses above 40 and price is above the 50 EMA and the 10/20 crossover just occurred. The more conditions you stack, the fewer alerts you receive, but each one is higher quality. You want 2-4 solid alerts per day, not 40 mediocre ones.
Comparing Buy Sell Indicators to Discretionary Trading
Some traders argue that indicators are crutches and pure price action is superior. The reality is more nuanced. Indicators are price action. They're just mathematical summaries of what price already did. The question isn't whether to use indicators, but how to use them without losing the context that discretionary reading provides.
A discretionary trader sees a double bottom forming at a key support level and knows that's a high-probability long setup. An indicator might not flag that pattern until the breakout is already underway. The discretionary edge is recognizing context before it's obvious. But discretionary trading is inconsistent when emotions interfere. You see the pattern but hesitate. Or you trade a marginal setup because you're bored.
A buy sell indicator removes emotional interference. When your conditions align, the signal appears. No debate. No second-guessing. This consistency is valuable, especially for part-time traders who can't develop the screen time for pure discretionary mastery. The best approach blends both. Use your indicator for timing and confirmation, but apply discretionary filters for context. If your buy signal appears in the middle of a consolidation with no clear trend, you can choose to pass even though the indicator fired.
Advanced buy sell indicator research now incorporates machine learning and language models to process fundamental data alongside technical signals. These systems analyze earnings reports, news sentiment, and price action simultaneously. While most retail traders won't build neural networks, the principle applies. The more relevant information your buy sell indicator considers, the better your edge.
For traders looking to skip the trial and error of building custom systems, the PipTrend AI Trading Indicator combines trend detection, multi-timeframe confirmation, and filtered signals in a single tool designed for clarity and consistency.
 AI Trading Indicator - PipTrend">
How Session Timing Affects Buy Sell Indicator Performance
Not all trading hours are equal. A buy sell indicator might generate a dozen signals in 24 hours, but the ones that occur during high-liquidity sessions have dramatically better follow-through.
The London session from 3:00 AM to 12:00 PM EST is the highest volume period for forex pairs. Buy and sell signals during this window tend to develop into sustained moves because institutional order flow is active. Your stop loss is less likely to get hunted, and your targets are more likely to get hit. The same indicator signal during the Asian session might stall after 15 pips because there's insufficient volume to drive momentum.
The New York open at 8:00 AM EST creates a second liquidity surge, especially for USD pairs. If your buy sell indicator fires a signal in the first hour of New York trading and it aligns with the London trend direction, you're trading with the strongest possible tailwind. These setups often move 50-100 pips in a few hours.
Avoid trading signals that fire during session overlaps unless you're specifically hunting volatility. The London-New York overlap from 8:00 AM to 12:00 PM EST is active but chaotic. Signals can reverse quickly. The Asian-London overlap is thin and prone to false breakouts. If your indicator fires during off-hours, consider waiting for the next major session to confirm the move is real.

Risk Management with Buy Sell Indicator Signals
An indicator tells you when to enter. It doesn't tell you how much to risk or where to exit. Those decisions determine whether you're profitable long-term.
Set your stop loss based on structure, not arbitrary pip counts. If your buy signal occurs at a support bounce, place your stop 5-10 pips below that support level. If support breaks, your trade thesis is invalidated and you want out. A buy sell indicator that prints signals without structural context forces you to guess at stops. Look for systems that incorporate recent swing highs and lows into their signal logic.
Position sizing matters more than entry precision. Risk 1-2% of your account per trade, regardless of how confident you feel. A string of five losses at 2% risk drops your account by 10%. The same five losses at 5% risk costs you 25%, and recovery becomes exponentially harder. Your buy sell indicator might have a 60% win rate, but the 40% of losers will destroy you if position sizing is reckless.
Trail your stops as the trade moves in your favor. If you enter a buy signal with a 20-pip stop and the trade moves 40 pips into profit, move your stop to breakeven. This locks in a risk-free trade. At 60 pips profit, trail your stop to 30 pips profit. You're giving back some gains to let the trend extend, but you've secured a win even if price reverses. Many indicators don't provide exit signals, so mechanical trailing rules keep you in trades long enough to capture the big moves.
Common Mistakes Traders Make with Buy Sell Indicators
The first mistake is chasing signals. Your buy sell indicator fires, but you're not at your desk. By the time you see the alert, price has already moved 30 pips. You enter anyway, hoping for more. This puts you in late with poor risk-reward. If you miss a signal, let it go. The next one is coming.
Over-optimization kills strategies. You backtest your buy sell indicator and tweak the settings until historical results look perfect. You change the RSI period from 14 to 13.6, adjust the moving average to 47 instead of 50, and add a custom filter for Tuesday mornings. In backtests, you're a genius. In live trading, the system falls apart because it was fit to past data, not real market behavior. Stick to standard settings and simple logic. Robust systems work across various conditions without constant adjustment.
Ignoring the broader market context is another trap. Your buy sell indicator doesn't know if the S&P just dropped 3% or if a central bank surprised with a rate hike. These macro events override technical signals. Maintain awareness of what's driving sentiment. If your indicator says buy but the overall market is in risk-off mode, reduce size or skip the trade.
Relying on a single indicator without confluence is gambling. A buy signal alone gives you maybe 50-55% edge. A buy signal plus trend alignment, support confluence, and session timing might give you 65-70%. Stack your probabilities. The goal isn't to trade more. It's to trade better.
Integrating Buy Sell Indicators into a Complete Trading Plan
Your indicator is one component of a system. You also need rules for when to trade, how to manage risk, and when to step aside. Write these rules down. A trading plan removes in-the-moment decision-making.
Define your trading hours. If you're most profitable during the London session, only trade signals that occur between 3:00 AM and 12:00 PM EST. Ignore everything else. This focus increases consistency and prevents overtrading during low-quality hours.
Set a daily loss limit. If you lose 3% of your account in a day, stop trading. Close your platform. Go for a walk. This rule protects you from revenge trading after a bad beat. Your buy sell indicator might fire ten more signals, but you're too emotional to trade them objectively. Come back tomorrow with a clear head.
Review your trades weekly. Go through every signal your indicator generated. Mark the ones you took and the ones you skipped. Note the outcomes. You'll spot patterns. Maybe you're skipping winners out of fear. Maybe you're taking signals that violate your session rules. This feedback loop sharpens your execution over time.
Keep a performance journal separate from your trade log. Write what you were thinking and feeling during key decisions. When you took a sell signal against the trend and lost, what was your reasoning? When you skipped a perfect buy signal, what stopped you? These notes reveal psychological patterns that no indicator can fix. Trading skill is 70% psychology, 20% risk management, and 10% edge. Your buy sell indicator provides the edge. You provide the rest.
A reliable buy sell indicator removes guesswork and gives you a structured framework for finding high-probability setups. When you combine trend filters, momentum confirmation, multi-timeframe alignment, and disciplined risk management, you stop trading on hope and start trading with an edge. If you're ready to trade with the clarity and confidence that comes from filtered, high-probability signals across any market or timeframe, explore what PipTrend can do for your trading consistency.