
Most traders chase price action without understanding the cyclical nature of markets. You watch prices climb, wondering if momentum is real or about to collapse. The commodity channel indicator was built specifically to solve this problem by measuring how far price has deviated from its statistical average. When you understand what drives these deviations and how to read them, you gain a quantifiable edge in timing entries and exits across any timeframe.
Understanding the Commodity Channel Indicator Framework
Donald Lambert developed the commodity channel index in 1980 to identify cyclical turns in commodity markets, but its application extends far beyond agricultural futures. The indicator calculates the difference between current price and its simple moving average, then divides by a multiple of the mean absolute deviation. This mathematical approach creates a normalized oscillator that typically fluctuates between -100 and +100, though values can extend well beyond these boundaries during strong trending conditions.
The standard formula uses a 20-period lookback and multiplies the mean deviation by 0.015 to ensure approximately 70 to 80 percent of values fall within the normal range. This statistical foundation matters because it tells you when price behavior has moved into extreme territory. Unlike indicators that simply smooth price data, the commodity channel indicator quantifies statistical abnormality, which often precedes reversals or continuation breakouts.

Reading CCI Values in Live Market Conditions
When the commodity channel indicator crosses above +100, price has moved significantly higher than its recent average, signaling strong bullish momentum. Values above +200 indicate extreme strength that might sustain for extended periods in trending markets. The critical distinction lies in understanding whether you're trading a ranging or trending environment. In a sideways market, readings above +100 warn of overbought conditions likely to reverse. In a confirmed uptrend, those same readings confirm momentum you should ride, not fade.
Conversely, readings below -100 signal price has dropped well below its statistical mean. The -200 level marks extreme weakness. Many traders make the mistake of buying every dip below -100, assuming automatic reversals. This approach works in range-bound conditions but destroys accounts during sustained downtrends. The commodity channel index interpretation requires context from trend structure, not just oscillator levels.
Zero-line crosses provide additional signal layers. When CCI rises through zero, it indicates typical price has moved above its moving average, suggesting bullish momentum. Drops below zero show bearish pressure. These crosses work best on higher timeframes like the 4-hour or daily chart, where statistical significance increases. On 5-minute charts, zero-line whipsaws create false signals that chop your account.
Practical Trading Strategies Using CCI
The reversal strategy focuses on extreme readings in established ranges. When price reaches resistance and CCI pushes above +100, you watch for bearish divergence where price makes a higher high but CCI fails to confirm with its own higher high. This divergence signals weakening momentum. Your entry comes when CCI crosses back below +100 with confirmation from price action like an engulfing candle or break of a micro trendline. Set your stop above the recent swing high and target the opposite range boundary, typically offering 2:1 or better risk-reward ratios.
The breakout confirmation strategy applies in trending markets. You identify a consolidation pattern like a bull flag or triangle. As price approaches the pattern's upper boundary, you monitor CCI. If CCI is already above +100 before the breakout, momentum is strong. When price breaks resistance and CCI pushes even higher or remains elevated above +100, the breakout is legitimate. Enter on the first pullback after the breakout, placing stops below the pattern and targeting measured moves based on the pattern's height.
Trend-following entries use CCI pullbacks within larger trends. On a daily chart showing an uptrend, wait for CCI to drop into negative territory between -50 and -100. This represents a healthy correction in an ongoing bull move. When CCI turns back up and crosses above -50, it signals the pullback is ending. Enter long as CCI momentum shifts positive, using the recent swing low as your stop and trailing stops as the trend extends. This approach captures mid-trend entries without requiring perfect timing at major lows.
Optimizing CCI Period Settings for Different Markets
The standard 20-period setting works well for daily charts and swing trading, but you need to adjust based on your timeframe and market volatility. Shorter periods like 14 increase sensitivity, generating more signals but also more noise. This suits scalpers on 5-minute or 15-minute charts who need quick feedback. Longer periods like 30 or 40 smooth the indicator, reducing false signals in choppy markets but delaying entries in fast-moving trends.
Forex pairs with high volatility like GBP/JPY often benefit from slightly longer periods to filter erratic movements. Crypto markets in 2026 show extreme volatility spikes that render ultra-short settings useless. A 25 to 30-period CCI on 1-hour crypto charts provides enough responsiveness without getting shredded by noise. Stock indices like the S&P 500 tend to trend more smoothly, allowing 14 to 20-period settings on 4-hour charts for swing trades.
Testing different periods against your specific instrument and timeframe is not optional. Pull up your platform's strategy tester and run CCI signals across the past 500 bars using 14, 20, 30, and 40-period settings. Document which period minimizes false signals while capturing the bulk of profitable moves. Most traders skip this step and wonder why textbook strategies fail in live conditions. The practical applications of CCI require customization, not blind acceptance of defaults.
Combining CCI with Price Action and Structure
The commodity channel indicator strengthens dramatically when filtered through support and resistance levels. Price touching a weekly support zone means little if CCI shows continued bearish momentum below -100. But when price reaches that same support and CCI forms bullish divergence or crosses back above -100, you have confluence. The statistical momentum shift confirms what price structure suggests.
Candlestick patterns at extreme CCI levels multiply signal reliability. A hammer or bullish engulfing at support while CCI sits at -150 carries far more weight than the candle alone. Similarly, a shooting star or bearish engulfing at resistance while CCI exceeds +150 warns of exhaustion. You're not just seeing a reversal pattern but also confirming that momentum has reached statistical extremes where reversals become probable.
Trendline breaks gain validation from CCI behavior. When price breaks a rising trendline in an uptrend, you question whether this is a minor shakeout or a true trend change. Check CCI. If it's been making lower highs despite price making higher highs, bearish divergence preceded the break. This confirms trend weakness. Enter short as price closes below the trendline with CCI already negative or falling rapidly. Conversely, if CCI remains strong above +100 despite the trendline break, it's likely a false breakdown.

Multi-Timeframe CCI Analysis for High-Probability Setups
Professional traders don't make decisions from a single timeframe. You need the 4-hour chart to show trend direction, the 1-hour chart to identify the current swing, and the 15-minute chart to time precise entries. Apply the commodity channel indicator across all three. When 4-hour CCI sits above +100 confirming a strong uptrend, 1-hour CCI pulls back into negative territory showing a healthy correction, and 15-minute CCI turns positive signaling the correction is ending, you have maximum alignment.
This approach filters out the majority of losing trades. You avoid fighting the larger trend because 4-hour CCI keeps you directionally aligned. You avoid chasing exhausted moves because 1-hour CCI ensures you're entering on pullbacks, not extensions. You avoid premature entries because 15-minute CCI confirms momentum is actually shifting in your direction before you risk capital.
The execution sequence matters. Monitor your 4-hour chart first each trading session. Is CCI above zero indicating bullish conditions or below zero showing bearish pressure? This becomes your directional bias. Next, watch for 1-hour CCI to move opposite that trend, creating pullback opportunities. Finally, wait for 15-minute CCI to flip back in the trend direction. Only then do you enter. This systematic approach prevents emotional trading and keeps you in sync with market structure at multiple levels.
Identifying Divergences for Reversal Opportunities
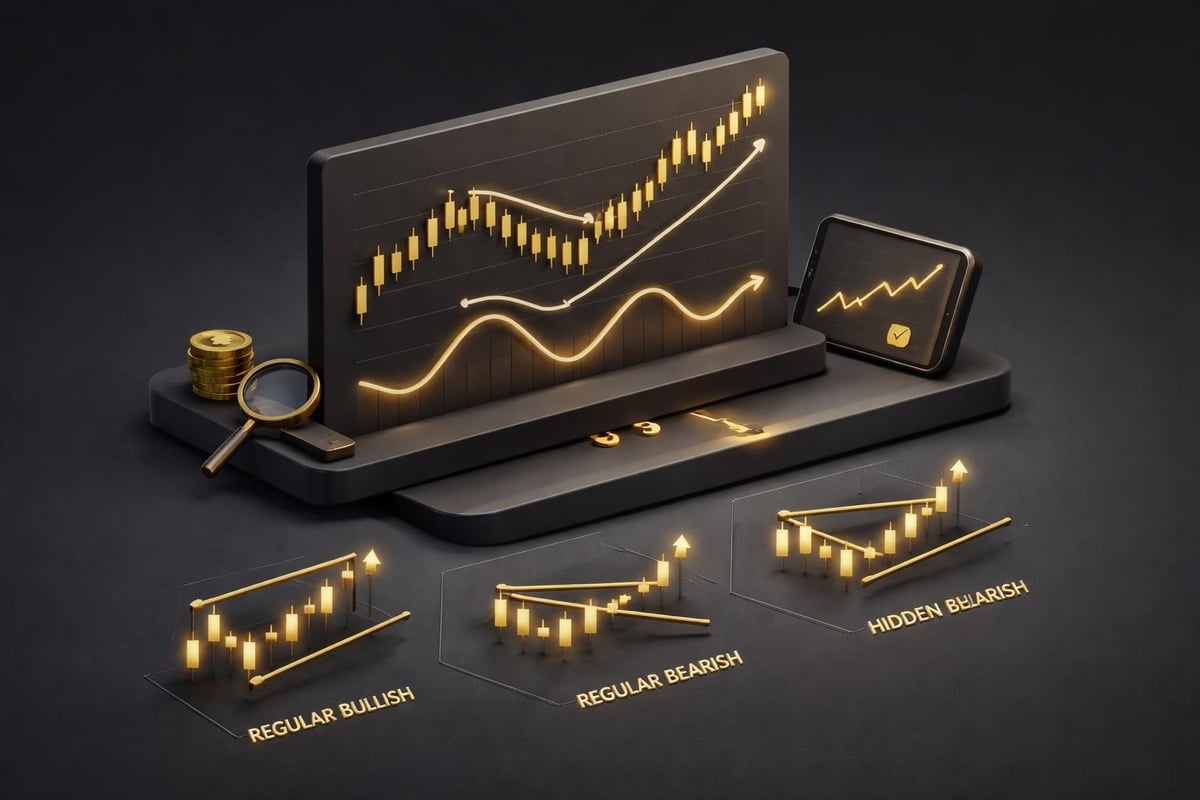
Divergence occurs when price and the commodity channel indicator move in opposite directions, signaling momentum is failing to confirm price action. Regular bullish divergence forms when price makes a lower low but CCI makes a higher low. This tells you selling pressure is weakening even as price continues down. The statistical deviation is shrinking, suggesting buyers are stepping in at these lower prices. When combined with oversold CCI readings below -100, bullish divergence becomes a high-probability reversal signal.
Regular bearish divergence appears when price makes a higher high but CCI forms a lower high. Buyers are pushing price up, but momentum is dying. The commodity channel indicator reveals this weakness before price confirms it. You see this frequently at the end of extended trends where price grinds higher on decreasing volume and momentum. Enter short when CCI crosses below +100 after forming the divergence, confirming the momentum shift is underway.
Hidden divergences signal trend continuation rather than reversal. Hidden bullish divergence occurs in uptrends when price makes a higher low but CCI makes a lower low. This shows the pullback is shallow in price terms but deep in momentum terms, indicating strong buyers absorbing the dip. It's a continuation setup. Hidden bearish divergence in downtrends shows price making lower highs while CCI makes higher highs, suggesting the bounce is weak and selling will resume.
Common CCI Trading Mistakes to Avoid
Treating every +100 or -100 cross as a signal destroys consistency. The commodity channel indicator provides information about statistical deviation, not automatic trade triggers. You need additional context like trend direction, support and resistance proximity, and confirmation from price action. Traders who mechanically short every +100 cross or buy every -100 cross find themselves stopped out repeatedly in trending markets where extended readings persist for dozens of bars.
Ignoring the underlying trend causes most CCI failures. An indicator designed to spot cyclical turns works differently in trending versus ranging markets. In a strong downtrend, CCI can remain below -100 for extended periods as price continues falling. Buying these "oversold" conditions means catching a falling knife. Wait for trend structure to shift first, then use CCI to time entries in the new direction. The CCI trading strategies that work require trend awareness.
Using CCI in isolation without volume or price pattern confirmation leaves you vulnerable. CCI might show bullish divergence, but if volume is declining and price structure remains bearish, the reversal may fail. Layer your analysis. Combine CCI signals with candlestick patterns, chart patterns, volume analysis, and key levels. When multiple factors align, your probability increases. When CCI signals alone contradict everything else, skip the trade.
Integrating CCI into a Complete Trading System
The commodity channel indicator works best as a confirmation tool within a broader system, not as a standalone solution. Your system needs trend identification, entry rules, stop loss placement, position sizing, and exit management. CCI handles the momentum confirmation piece. It tells you whether current price action has statistical support or is overextended. This information improves entry timing and helps you avoid fighting exhausted moves.
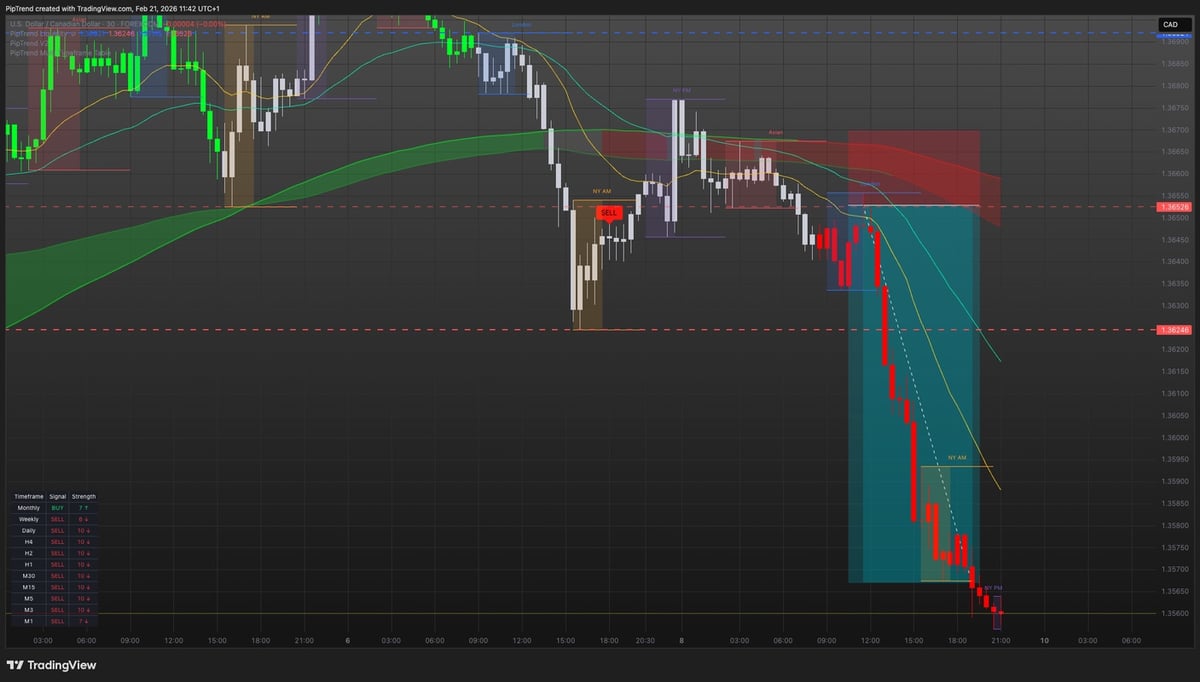
PipTrend AI Trading Indicator integrates multiple momentum and trend signals including CCI-style deviation analysis with automatic trend detection and multi-timeframe confirmation. This removes the manual work of checking three timeframes and cross-referencing divergences while providing clear buy and sell signals filtered for high-probability setups.
 AI Trading Indicator - PipTrend">
Build your checklist. Before entering any trade, verify your requirements. For a long trade example: 4-hour trend is up, price is at or near support, CCI on 1-hour chart is oversold or showing bullish divergence, 15-minute CCI is turning positive, candlestick pattern confirms, and risk-reward is at least 2:1. When all conditions meet, you enter. When one or more fail, you wait. This systematic approach using CCI as one component creates consistency.
Track your CCI signals in a journal. Record the timeframe, the CCI reading, whether divergence was present, the outcome, and what you learned. Over 50 or 100 trades, patterns emerge. You might discover CCI works brilliantly for you on 4-hour EUR/USD charts but poorly on 15-minute Bitcoin charts. This data-driven approach lets you refine which markets and timeframes benefit most from commodity channel indicator analysis in your trading.
Advanced CCI Techniques for Experienced Traders
Multiple CCI indicators with different periods reveal momentum at different speeds. Plot a 14-period CCI for short-term momentum and a 40-period CCI for longer-term trend strength on the same chart. When both are positive and rising, you have momentum alignment across timeframes on a single chart. When short-term CCI turns negative while long-term CCI remains positive, it signals a pullback within a larger uptrend, creating the ideal entry setup.
CCI slope analysis adds another layer. The absolute level matters, but so does the rate of change. If CCI is at +50 but rising sharply, momentum is accelerating. This suggests strength will continue. If CCI is at +150 but flattening or starting to roll over, momentum is stalling despite the high reading. The slope change often precedes the level change, giving you earlier warning of shifts.
Pairing CCI with other oscillators like RSI creates powerful confirmation. When both CCI and RSI show bullish divergence at the same time, the reversal probability increases significantly. When CCI signals oversold conditions below -100 and RSI simultaneously shows oversold readings below 30, the confluence strengthens the setup. You're not looking for indicators to tell you different things but for multiple analytical methods to confirm the same conclusion. Understanding how CCI complements other tools enhances your overall edge.
Real-World CCI Applications Across Markets
Forex traders use the commodity channel indicator to time entries around major support and resistance zones. On EUR/USD daily charts, when price approaches the 1.0800 level and CCI drops below -100, you watch for bullish divergence or a cross back above -100 to signal the reversal. The 4-hour chart provides more frequent signals for shorter-term trades, with CCI crossovers at the +100 and -100 levels generating 10 to 15 setups per month on major pairs. Risk management remains critical, with stops placed beyond recent swing points and targets based on the next key level or a trailing stop approach.
Stock traders apply CCI to identify momentum shifts in individual equities and indices. On the S&P 500, CCI divergences on the weekly chart often precede multi-week trend changes. Tech stocks with high volatility benefit from 25 to 30-period CCI settings to smooth out intraday noise while maintaining responsiveness to actual momentum shifts. Earnings reports and news events can override technical signals, so experienced stock traders avoid CCI setups immediately before scheduled announcements.
Crypto markets in 2026 present unique challenges given extreme volatility and 24/7 trading. The commodity channel indicator helps identify when Bitcoin or Ethereum has moved into statistically extreme territory, but the thresholds differ. Readings of +200 or -200 occur more frequently in crypto than traditional markets, so you adjust expectations. Using CCI on 4-hour and daily crypto charts with 20 to 30-period settings provides better signal quality than shorter timeframes where noise dominates. The principles remain consistent, but the application of CCI across different markets requires flexibility.
Building Confidence with CCI Through Backtesting
Paper trading CCI strategies before risking real capital eliminates expensive lessons. Open your charting platform and scroll back 500 bars. Mark every point where CCI crossed above +100 or below -100. Note the market context, whether divergence was present, and what happened in the following 10 to 20 bars. This visual backtest shows you how often CCI signals worked versus failed in your specific market and timeframe.
Forward testing over 30 to 60 days in a demo account builds muscle memory. You execute CCI signals in real-time without financial risk. You learn how quickly momentum can shift, how often false signals occur, and which additional filters improve accuracy. Most traders skip this step and wonder why they freeze or make mistakes in live trading. The detailed understanding of CCI behavior comes from repetition and observation.
Create a spreadsheet tracking every CCI signal you take. Include columns for date, instrument, timeframe, CCI reading at entry, whether divergence was present, entry price, stop loss, target, outcome, and profit or loss in pips or dollars. After 50 trades, calculate your win rate, average winner, average loser, and expectancy. If your expectancy is positive, you have an edge worth trading with real money. If not, adjust your filters and continue testing until the numbers work.
Adapting CCI to Your Trading Style
Scalpers need rapid CCI feedback on 1-minute to 5-minute charts with 10 to 14-period settings. You're looking for quick momentum pops above +100 or drops below -100 at key intraday levels. Trades last minutes to an hour. The challenge is separating noise from signal, which requires strict adherence to additional filters like volume spikes or price action confirmation. Scalping with CCI alone generates too many false signals.
Day traders operate on 5-minute to 1-hour charts with 14 to 20-period CCI settings. You identify the daily trend first, then use CCI to time entries on pullbacks. Trades last several hours, capturing intraday swings. You close everything before the session ends to avoid overnight risk. CCI divergences on the 15-minute chart provide excellent day trading signals when aligned with the larger daily trend direction.
Swing traders work on 4-hour to daily charts with 20 to 30-period CCI settings. You're capturing multi-day moves, entering on CCI confirmation of trend continuation or reversal patterns. Trades last days to weeks. The longer timeframe reduces noise significantly and allows CCI signals to develop with greater statistical validity. Swing trading suits those who can't watch charts all day but can check positions once or twice daily.
Managing Risk with CCI Signals
Stop loss placement with CCI trades depends on the signal type. For reversal trades based on divergence, place stops beyond the swing high or low that created the divergence. This ensures the pattern is invalidated before you're stopped out. For breakout trades confirmed by CCI, place stops below the breakout level or pattern boundary. The stop distance determines your position size, not arbitrary percentage rules.
Position sizing should account for CCI signal strength. A trade where CCI shows extreme oversold readings below -200 with bullish divergence at weekly support carries higher probability than a marginal -110 reading with no divergence at a minor level. You might risk 1.5% of your account on the former and 0.75% on the latter. Scaling risk based on setup quality improves long-term returns while managing drawdowns.
Exit strategies using CCI include profit targets at the next major level, trailing stops based on CCI remaining in positive territory, or exits when CCI reaches opposite extremes. If you entered long on a CCI cross above -100, you might hold until CCI exceeds +100, suggesting the move is extended. Alternatively, exit when CCI crosses back below +100, indicating momentum is fading. Test different exit rules to find what maximizes your reward-to-risk ratio.
The commodity channel indicator provides quantifiable momentum analysis that removes guesswork from your trading when you apply it within proper market context. Combining CCI signals with trend structure, support and resistance, and multi-timeframe confirmation creates a systematic approach to identifying high-probability opportunities. PipTrend delivers this clarity instantly, showing you exactly when momentum aligns across timeframes so you can trade with conviction instead of doubt. Stop second-guessing your entries and start trading with the statistical edge you need.