
Most traders watch the S&P 500 like it's a crystal ball, but by the time the index confirms a trend, the best entries are gone. Smart money doesn't wait for confirmation from lagging indicators. They watch specific stocks that move first, the ones that telegraph what's coming next for the entire market. These are indicator stocks, and understanding them separates reactive traders from those who position ahead of the crowd.
What Makes a Stock an Indicator
Indicator stocks aren't random picks. They're high-capitalization, heavily-traded names that institutional money flows into and out of before making broader market moves. Think Apple, NVIDIA, JPMorgan Chase. These stocks carry enough weight to influence sector indices and the major averages, but they're also liquid enough that large players can establish positions without moving price dramatically.
The mechanics are straightforward. When institutions want to rotate capital, they start with their highest-conviction positions in the most liquid names. If Goldman Sachs is turning bullish on equities, you'll see buying pressure in financials like JPM before the Financial Select Sector SPDR ETF catches up. If tech spending looks weak, AAPL and MSFT will roll over before the Nasdaq-100 confirms the breakdown.
What separates indicator stocks from the rest of the market is their dual role. They reflect sector health while simultaneously influencing it through index weighting. NVIDIA alone can swing the Nasdaq by 50 points on an earnings miss. That's not correlation, that's causation.
Volume Characteristics That Matter
Real indicator stocks trade with institutional volume patterns. You're looking for consistent daily volume above 20 million shares, tight bid-ask spreads, and option chains with heavy open interest across multiple strikes. These features mean the stock can absorb large orders without gapping, which is exactly what institutions need.
Compare average daily volume during trending periods versus consolidation. True indicator stocks maintain elevated volume even when price goes sideways, signaling continued institutional interest. If volume dries up during a pullback, it's a healthy retest. If volume spikes on the decline, distribution is happening and the broader sector is next.
The Nasdaq’s investor activity patterns show how concentrated flows into these liquid names precede broader market shifts by days or even weeks. You're not looking for penny stock volatility. You want boring, predictable stocks that suddenly aren't boring anymore.
Identifying Your Watchlist of Indicator Stocks
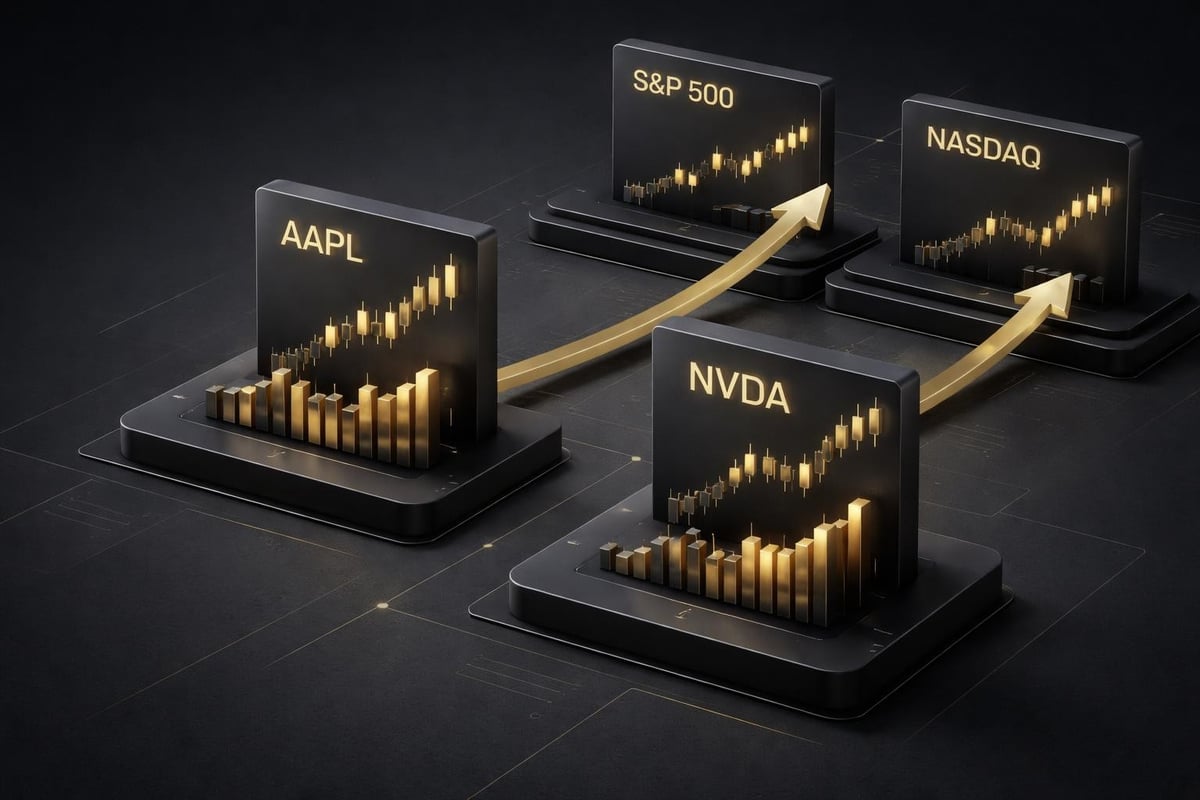
Start with the top 10 holdings in SPY, QQQ, and IWM. These are the index heavyweights that move markets. In 2026, that includes AAPL, MSFT, NVDA, GOOGL, AMZN, META, TSLA, BRK.B, JPM, and V. Each represents a different sector or market theme, giving you a diversified view of institutional sentiment.
But don't stop at tech. The Russell 2000's leading stocks signal risk appetite differently than mega-caps. Small-caps lead when investors expect growth acceleration and are willing to take risk. When IWM's top holdings start lagging while SPY holds up, that's divergence worth trading.
Sector-specific indicator stocks matter for focused strategies. If you trade energy, XOM and CVX are your indicators. For semiconductors, watch NVDA and AMD relative to the SMH ETF. The relationship between the stock and its sector tells you whether strength is isolated or the start of a rotation.
Cross-reference your list with stocks that have weekly options and tight spreads. This ensures institutional participation and gives you flexibility in position management. If you can't get filled at the mid on a 1000-share order, it's not liquid enough to be a reliable indicator.
Reading Price Action in Indicator Stocks
Price action in indicator stocks follows predictable patterns because institutions can't hide. A hedge fund buying 500,000 shares of AAPL will leave tracks. You're looking for accumulation patterns: higher lows on the daily chart, volume surges on up days, and price holding key moving averages like the 21 EMA.
When an indicator stock breaks structure, pay attention. If NVDA closes below its 50-day moving average after a sustained uptrend, that's not random noise. Chips are often the first sector to weaken ahead of broader tech weakness. Similarly, if JPM clears resistance and holds above prior highs on expanding volume, financials are likely entering a leadership phase.
The 15-minute and 1-hour timeframes show you real-time institutional activity. Watch for absorption, where price consolidates despite heavy volume. That's buying or selling being absorbed by the other side, often a precursor to a breakout or breakdown. Unlike tools that repaint or lag, raw price and volume data on these timeframes gives you the truth.
Relative strength matters more than absolute price. Compare your indicator stock to its sector ETF and the S&P 500. Is AAPL making new highs while SPY is flat? That's leadership and often predicts SPY following higher. Is XOM dropping while SPY rallies? Energy weakness might drag the index down next week.
Using Multiple Timeframes for Confirmation
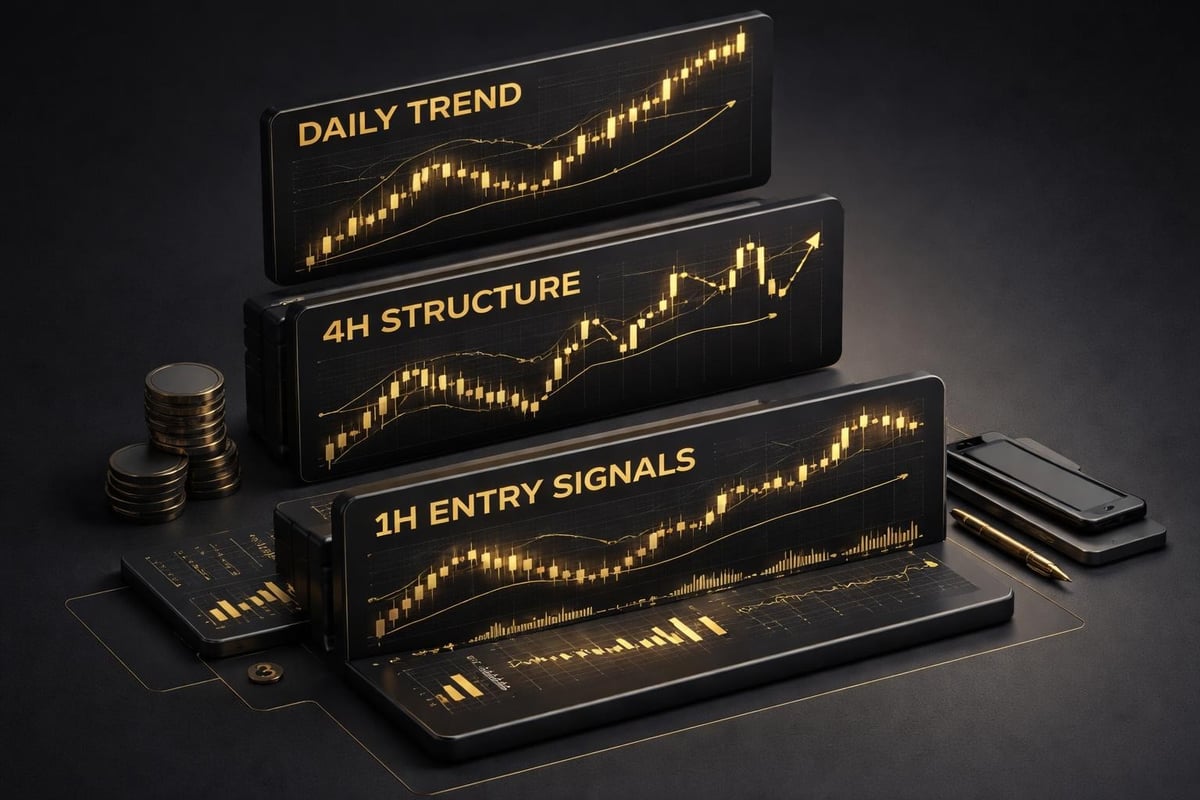
Indicator stocks work best when you align multiple timeframes. The daily chart sets the trend, the 4-hour shows you swing structure, and the 1-hour gives you entries. If all three agree, your probability increases dramatically.
Let's walk through a real setup. NVDA is in a daily uptrend above the 21 and 50 EMA. The 4-hour chart shows a bull flag forming after a strong impulse move. On the 1-hour, price pulls back to the flag support with declining volume, then starts basing. That's your entry zone. You're not guessing. You're reading institutional positioning across timeframes.
The same logic applies in reverse. If the daily chart shows a lower high, the 4-hour breaks support, and the 1-hour is making lower lows with increasing volume, that's a short setup. Indicator stocks respect technical levels better than low-float garbage because the order flow is real, not manipulated.
Check correlation between your indicator stock and the index it influences. Pull up a split chart with AAPL on top and QQQ on bottom. Do they move in lockstep, or is one leading? When the indicator stock leads by a day or more, you have an edge. That lag is your opportunity.
Combining Indicator Stocks with Technical Tools
Indicator stocks become exponentially more valuable when paired with momentum oscillators and volume analysis. The Relative Strength Index works exceptionally well on high-volume names because the calculations aren't distorted by thin trading.
Set your RSI to a 14-period default and watch for divergence. If AAPL makes a new high but RSI makes a lower high, momentum is fading. That's often the first sign of distribution before the stock rolls over. Conversely, bullish divergence where price makes a lower low but RSI makes a higher low signals accumulation.
The Stochastic Oscillator helps time entries within the larger trend. Use a 14,3,3 setting on the daily chart. When your indicator stock is in an uptrend and stochastic dips into oversold territory below 20, that's a potential buy zone. Wait for it to cross back above 20 with a rising price bar for confirmation.
Volume-based tools like on-balance volume and the volume-weighted average price separate real moves from noise. If NVDA rallies 3% but OBV is flat or declining, that's low-conviction buying likely to reverse. If VWAP is rising alongside price and volume is above the 20-day average, institutions are participating.
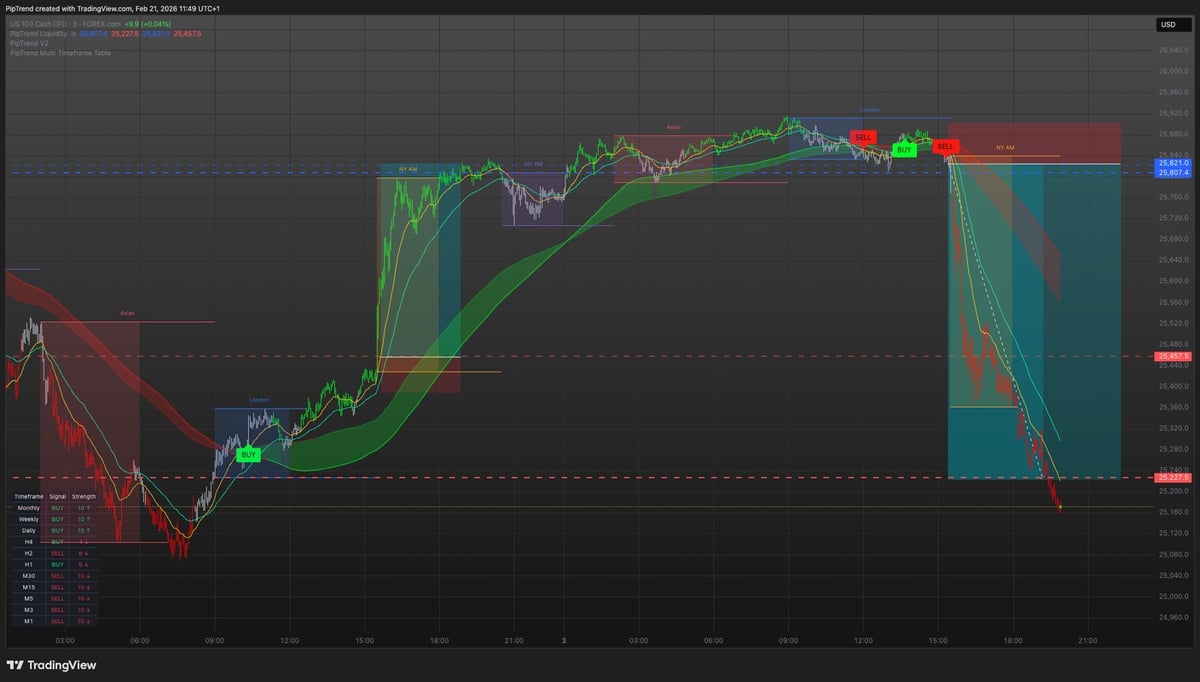
For those looking to cut through conflicting signals entirely, PipTrend AI Trading Indicator analyzes multiple timeframes simultaneously and filters for high-probability setups. When you're tracking five or six indicator stocks across different sectors, having automated multi-timeframe confirmation saves hours and prevents you from missing aligned setups while you're analyzing one chart.
Momentum Indicators That Actually Work
Most oscillators in technical analysis were designed decades ago for different market structures. They still work on indicator stocks because these names trade with institutional flow, not retail panic. The key is using them for confirmation, not as standalone signals.
Pair RSI with price structure. An RSI reading above 70 doesn't mean sell, it means strong momentum. If your indicator stock is in an uptrend with RSI above 70 and price is making higher highs, stay long until structure breaks. Overbought can stay overbought for weeks in trending markets.
The Coppock Curve is underutilized but valuable for longer-term positioning. It's designed to identify major bottoms in indicator stocks and indices. When the Coppock Curve turns positive after being negative for months, it signals institutional accumulation is underway. This works especially well on monthly charts for swing trades lasting several weeks.
Market Breadth and Indicator Stock Divergence
Indicator stocks gain power when you compare them against market breadth. The advance-decline line, new highs versus new lows, and sector rotation all provide context. If SPY is making new highs but only three of your ten indicator stocks are participating, that's weak breadth and a warning sign.
The TRIN (Arms Index) measures market breadth through volume and helps identify whether moves in your indicator stocks are supported by the broader market. A TRIN reading below 1.0 with your indicator stocks rallying confirms broad buying pressure. A reading above 1.0 while indicator stocks push higher suggests the rally is narrow and vulnerable.
Watch for divergence between mega-cap indicator stocks and mid-cap names. If AAPL and MSFT are grinding higher but mid-cap tech is flat, that's concentration risk. When a market correction comes, it often starts in the names that didn't participate in the rally and spreads to the leaders last.
Sector rotation shows you which indicator stocks to focus on. In early 2026, if financials are outperforming tech, your watchlist should prioritize JPM, BAC, and GS over NVDA and AMD. Don't fight the rotation. Trade the stocks where institutional money is flowing, not where it was three months ago.
Trading Setups Using Indicator Stocks
The cleanest setups occur when an indicator stock confirms index action with a one or two-day lead. If JPM breaks out on Monday and SPY is still consolidating, you can position in SPY with higher confidence knowing a key financial is already moving. This lead-lag relationship is your edge.
For breakout trades, wait for the indicator stock to clear resistance with volume at least 1.5x the 20-day average. Set your stop below the breakout level or the nearest swing low, whichever offers a better risk-reward ratio. Target previous highs or measured moves based on the consolidation range. A 2:1 reward-to-risk ratio is the minimum acceptable setup.
Reversal trades require more confirmation. If AAPL has been in a downtrend and starts forming higher lows with increasing volume, you need to see multiple indicator stocks in the same sector showing similar action. One stock reversing could be noise. Three or four sector leaders reversing simultaneously is a signal worth trading.
Mean reversion works when your indicator stock deviates significantly from its sector ETF. If NVDA drops 5% intraday while SMH is only down 2%, and there's no stock-specific news, that's often an overreaction you can fade. Use tight stops and quick profit targets on these trades since you're betting on a return to correlation, not a trend change.
Risk Management Specific to Indicator Stocks
Position sizing matters more with indicator stocks because they're volatile enough to move your account. Risk no more than 1-2% of your capital per trade, adjusted for the stock's average true range. NVDA with a $15 ATR requires different position sizing than JPM with a $3 ATR to maintain consistent risk.
Earnings announcements turn indicator stocks into grenades. Whether you hold through earnings or exit before the announcement depends on your strategy, but you must decide in advance. Post-earnings moves in stocks like AAPL or TSLA often predict sector direction for weeks, so there's information value even if you don't hold the position.
Correlation breaks are your biggest risk. Normally, AAPL and QQQ move together. If AAPL suddenly decouples, either something company-specific is happening or the correlation is about to snap back violently. Don't assume relationships that held for months will continue without confirmation.
Stop placement on indicator stocks should respect their volatility. A stock with 2% daily average moves needs wider stops than one with 0.5% moves. Use ATR-based stops (1.5x to 2x ATR) rather than arbitrary percentages. This keeps you in trades through normal noise while cutting losers before they become disasters.
Reading Institutional Activity Through Indicator Stocks
Dark pool data and block trades in indicator stocks reveal what institutions are doing before it shows up in price. If you see repeated block trades above 100,000 shares in JPM all at or above the ask price, that's accumulation. Selling shows up as blocks hitting the bid.
Time of day matters for reading this activity. Institutional traders often execute large orders in the first 30 minutes and last 30 minutes of the session when liquidity is highest. If you see heavy block buying in AAPL at 3:30 PM EST, that's not retail. Someone is positioning ahead of tomorrow's expected move.
The put-call ratio on indicator stocks signals sentiment shifts. A ratio below 0.7 (more calls than puts) suggests bullish positioning. Above 1.0 indicates hedging or bearish bets. When the ratio on an indicator stock diverges from the broader index ratio, it's worth investigating.
Compare your indicator stock's performance during different market sessions. Does it rally during New York hours and fade during after-hours? That tells you who's driving the action. Stocks dominated by institutional flow show the strongest moves during regular trading hours, while retail-heavy names might have more after-hours volatility.
Common Mistakes When Trading Indicator Stocks
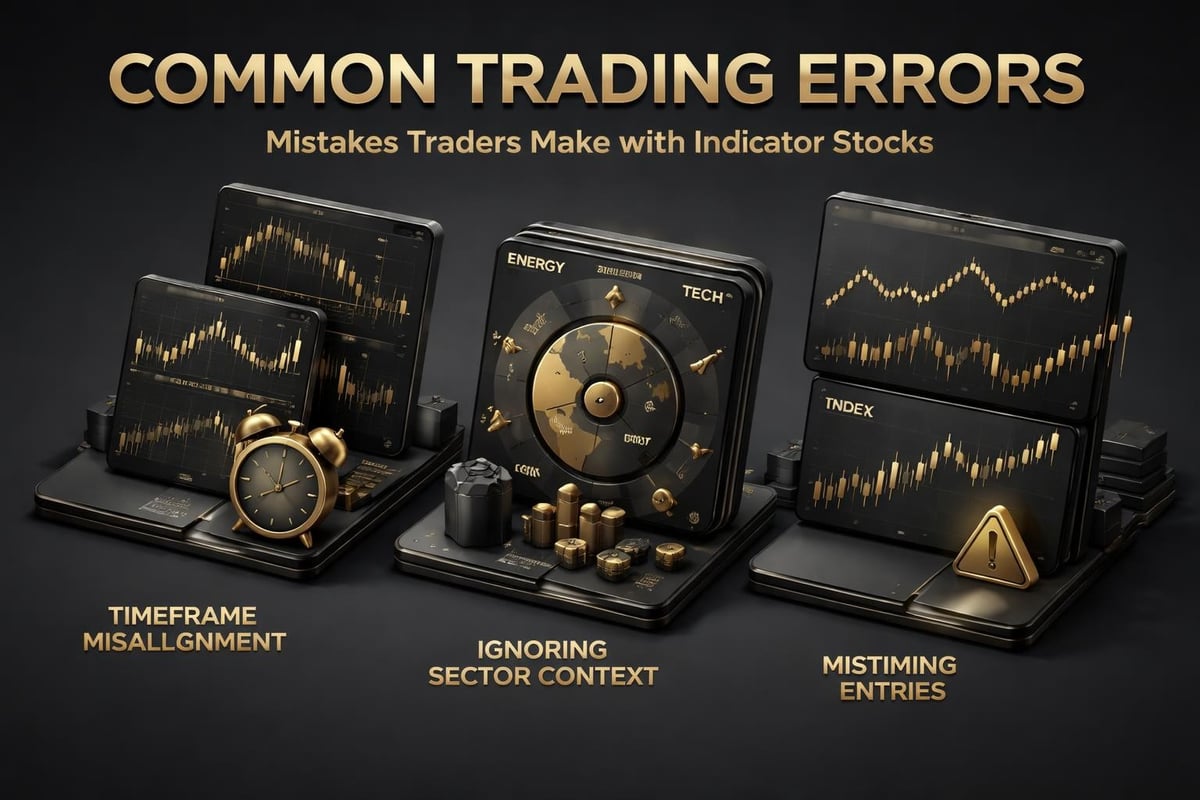
The biggest mistake is treating indicator stocks like they're the entire market. They lead, but they're not perfect. AAPL can rally for days while the S&P consolidates, then reverse sharply when the index catches up. Always confirm with at least two other indicator stocks before assuming a market-wide trend.
Over-reliance on a single timeframe kills accounts. You might see a perfect setup on the 1-hour chart, but if the daily chart is at major resistance, your probability drops significantly. Check alignment across at least three timeframes before entering any position.
Ignoring stock-specific catalysts is another trap. If TSLA is your indicator stock for consumer discretionary and Elon Musk tweets something controversial, the stock's price action becomes about Twitter noise, not sector trends. Know the difference between signal and company-specific chaos.
Failing to adjust for changing market regimes means you'll trade 2025's indicator stocks in 2026. Leadership rotates. The stocks that led in a bull market often lag in choppy conditions or bear markets. Review your indicator stock list quarterly and replace names that have lost their correlation and influence.
Integrating Indicator Stocks into Your Daily Routine
Start each trading day by scanning your indicator stock list for overnight changes. Did any gap significantly? Are they trending together or showing divergence? This five-minute scan tells you whether the market has conviction or if you should expect choppy, directionless action.
Create alerts for key levels on your indicator stocks. If NVDA approaching its 200-day moving average matters to your thesis, set an alert for when price gets within 1% of that level. Don't waste mental energy watching charts all day. Let alerts bring opportunities to you.
Compare your indicator stocks to market breadth metrics each morning. Pull up the advance-decline line, check new highs versus new lows, and look at sector heat maps. If your indicator stocks are green but breadth is weak, you know the rally is fragile. That changes how aggressive you get with new positions.
End each week by reviewing which indicator stocks led and which lagged. This reveals rotation patterns you can trade the following week. If financials led for three consecutive weeks, that's a trend. If they suddenly lag, something changed and you need to adjust your focus.
You can explore more refined entry techniques through chart pattern analysis that specifically applies to high-volume indicator stocks where patterns are more reliable due to institutional participation. The cleaner order flow in these names makes traditional technical patterns work better than in thinly-traded stocks.
Sector-Specific Indicator Stocks to Track
Technology leadership shows through AAPL, MSFT, NVDA, and GOOGL. These four represent different tech subsectors: consumer hardware, enterprise software, semiconductors, and internet services. When all four trend the same direction, tech is leading the market. When they diverge, it signals internal rotation worth investigating.
Financial sector health comes through JPM, BAC, GS, and MS. Banks respond to interest rate expectations and economic growth forecasts. If these stocks rally while bonds sell off (yields rising), it confirms market expectations of stronger economic activity. If they weaken despite rising yields, something else is wrong-likely credit concerns or recession fears.
Energy indicator stocks include XOM, CVX, and COP. These move with oil prices but also lead or lag based on supply expectations and geopolitical factors. When energy stocks lead the market higher, it often signals inflation concerns and rotation out of growth into value. When they lag, it suggests deflationary pressures or growth slowdown.
Consumer discretionary tells you about spending confidence through AMZN, HD, and MCD. Strong performance here with rising volume suggests consumers are confident and spending. Weakness despite a strong labor market warns of cracks in the consumer story that will eventually hit earnings across multiple sectors.
Advanced Strategies With Indicator Stocks
Pairs trading between an indicator stock and its sector ETF reduces market risk. If you're bullish on NVDA specifically but not the semiconductor sector, go long NVDA and short SMH. Your profit comes from NVDA outperforming, not from the sector rising. This isolates your edge and protects against sector-wide selloffs.
Calendar spreads using options on indicator stocks take advantage of their predictable volatility patterns. Sell near-term options to collect premium while owning longer-dated options for directional exposure. This works especially well around earnings when near-term volatility spikes but longer-term trend remains intact.
Statistical arbitrage between correlated indicator stocks can be profitable when correlation temporarily breaks. If AAPL and MSFT normally move with 0.85 correlation but suddenly diverge, you can fade the divergence by going long the laggard and short the leader, expecting mean reversion. Use tight stops since you're betting on statistical relationships, not fundamental trends.
For traders focused on swing trading across multiple timeframes, understanding top-down analysis helps you position indicator stocks within the broader market context. You're not just trading AAPL in isolation-you're trading AAPL relative to QQQ, relative to the Nasdaq sector it belongs to, and relative to global equity trends. This layered approach dramatically improves your win rate.
Indicator stocks give you a systematic edge by showing you where institutional money moves before the broader market confirms. Watch volume patterns, respect multi-timeframe alignment, and compare individual stock action against sector and index behavior. When you combine these signals with solid risk management and position sizing, you're no longer reacting to moves-you're anticipating them. PipTrend eliminates the guesswork by analyzing multiple timeframes simultaneously and filtering high-probability setups, so you can focus on execution instead of analysis paralysis. Stop second-guessing and start trading with the clarity that comes from knowing exactly when to act.