
Most traders hear about golden forex patterns and think it's some mythical setup that only works in hindsight. You watch the chart after price has already moved 200 pips and convince yourself you saw it coming. The truth is simpler and more profitable than the fantasy. Golden forex crossovers are mechanical, repeatable, and give you an edge when you know which timeframes matter and how to filter the noise from institutional moves.
What Golden Forex Crossovers Actually Tell You
The golden forex pattern happens when a faster moving average crosses above a slower one. The most common version uses the 50-period and 200-period simple moving averages. When the 50 breaks above the 200, you have a golden cross signaling momentum shift from sellers to buyers. This isn't astrology. It's a visual representation of price accepting higher levels over an extended period.
The pattern works because institutional algorithms and fund managers use these same levels for position building. When the 50 crosses the 200 on the daily chart of EUR/USD, pension funds and trend-following systems start layering into longs. This creates follow-through that can last weeks or months. You're not predicting the future. You're reading the footprints of money already committed.
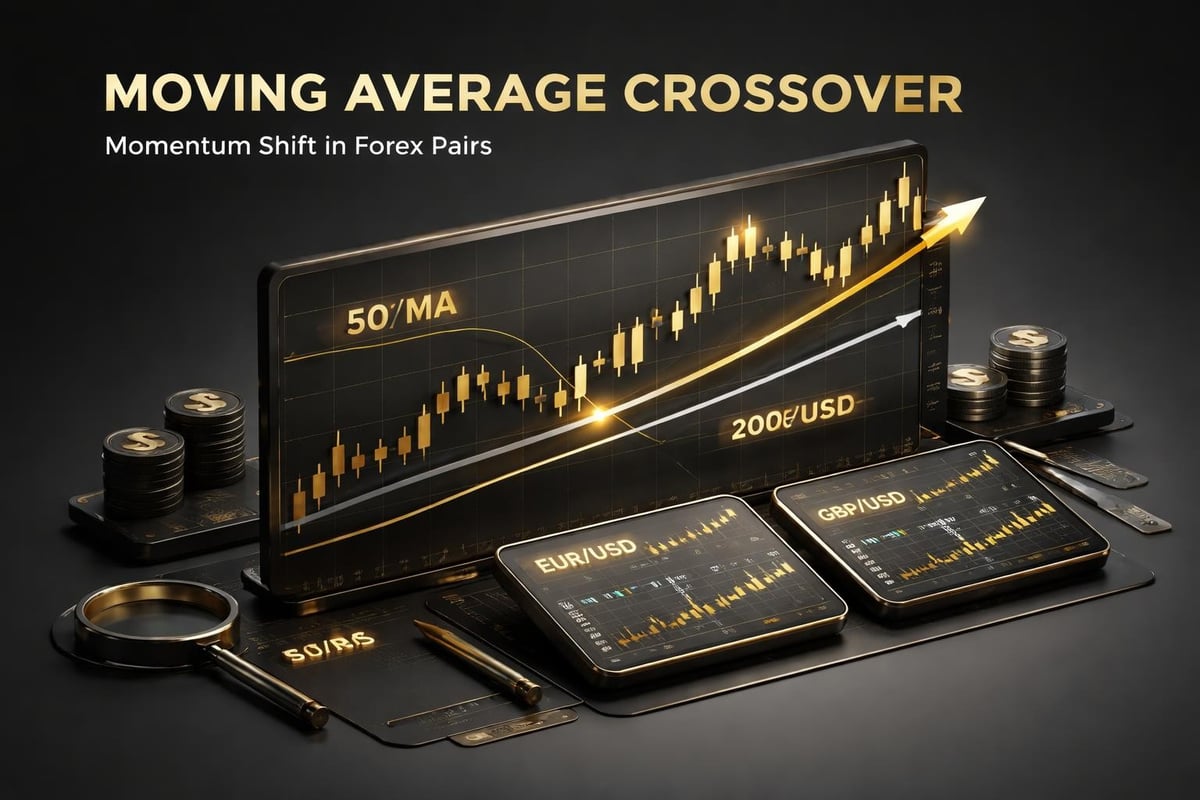
Unlike tools that repaint or disappear after the candle closes, moving averages are fixed. The crossover either happened or it didn't. This gives you a clear reference point for entries and lets you backtest exactly how the pattern performed on your pair over the last five years. Most traders skip this step and wonder why golden forex setups fail. They trade the pattern on pairs with low average daily range or during consolidation periods when no crossover matters.
Timeframe Selection Changes Everything
A golden forex crossover on the 15-minute chart means nothing. You'll get three crossovers before lunch and none of them will hold. The pattern needs room to breathe. Daily charts are the minimum timeframe where this setup has statistical merit. Weekly charts are even better for swing positions you can hold through minor pullbacks.
Here's the practical breakdown. On the H4 chart, a 50/200 golden cross might give you a trend that lasts three to seven days. Risk-reward setups in the 1:2 to 1:3 range are realistic if you enter on the first pullback after the cross. On the daily chart, the same crossover can signal a trend lasting 30 to 90 days with potential for 1:5 or better. The weekly chart extends this to multi-month moves, but you need the capital and patience to ride 300-pip drawdowns without panic.
The mistake is treating all golden forex signals the same. A crossover on GBP/JPY daily after a six-month downtrend holds more weight than one on AUD/NZD after a two-week dip. Context is the difference between a 60% win rate and a 40% win rate. You need to know what price was doing before the moving averages crossed.
Filtering Golden Forex Setups With Market Structure
Not every crossover deserves your money. You want the golden forex pattern to confirm what price structure already suggested. If EUR/USD has been making lower highs and lower lows for six months, then suddenly breaks a major resistance zone and the 50 crosses above the 200 three days later, you have alignment. The crossover is late confirmation, not early prediction.
Compare that to a pair chopping sideways in a 100-pip range for two months. The moving averages will cross back and forth as price bounces between support and resistance. These crossovers are noise. They'll get you chopped up with three losing trades before the real move starts. The solution is requiring a structural break first. Wait for a higher high or lower low depending on your directional bias, then use the golden forex crossover as your entry trigger.
| Timeframe | Trend Duration | Typical Risk-Reward | Best For |
|---|---|---|---|
| H4 | 3-7 days | 1:2 to 1:3 | Day traders with time to monitor |
| Daily | 30-90 days | 1:3 to 1:5 | Swing traders holding overnight |
| Weekly | 3-9 months | 1:5 to 1:8 | Position traders with larger capital |
You also need volume or momentum confirmation. If the 50 crosses the 200 but ATR is compressing and daily ranges are shrinking, the trend doesn't have fuel. Look for expanding ATR values and candles closing near their highs or lows depending on direction. This tells you participation is increasing, which is what carries price beyond the crossover point.
Entry Tactics That Reduce Risk
The crossover itself is not your entry. If you buy the exact candle where the 50 crosses the 200, you're often entering at the top of a momentum spike. Price needs to pullback and retest the moving averages before the next leg. This pullback entry can save you 30 to 50 pips of heat and improve your risk-reward from 1:2 to 1:4 on the same move.
Here's the mechanical process. The golden forex crossover occurs on Monday's daily candle close. You don't enter. You wait for price to retrace back toward the 50-period MA. When price touches or comes within 10 pips of the 50 and shows rejection with a bullish pin bar or engulfing candle, you enter long. Your stop goes 10 pips below the 50 MA or below the swing low, whichever is tighter. This gives you a defined risk of 20 to 40 pips depending on the pair's average true range.
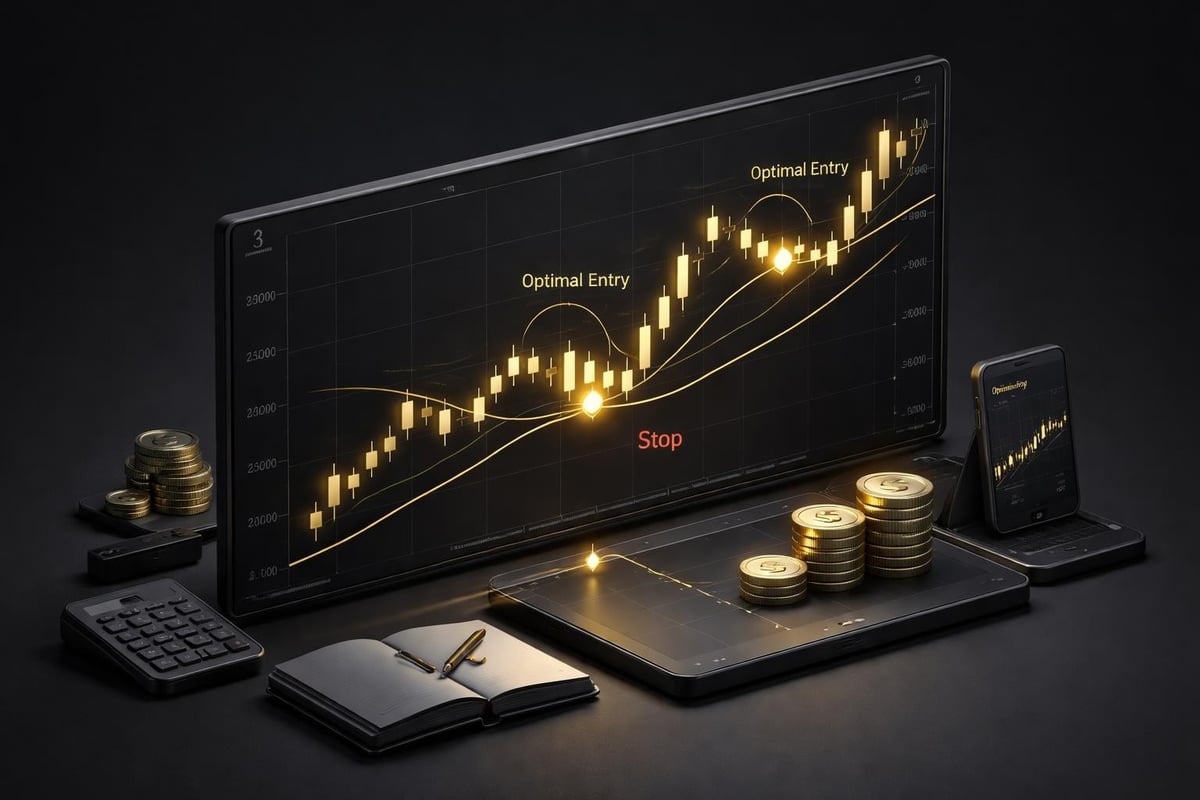
Your first target sits at the next resistance level or a 1:3 risk-reward ratio. If you risked 30 pips, your target is 90 pips. Move your stop to breakeven once price moves 40 pips in your favor. This protects you from the pullback turning into a reversal. The second target can be a measured move or trailing stop using the 20-period EMA on the same timeframe.
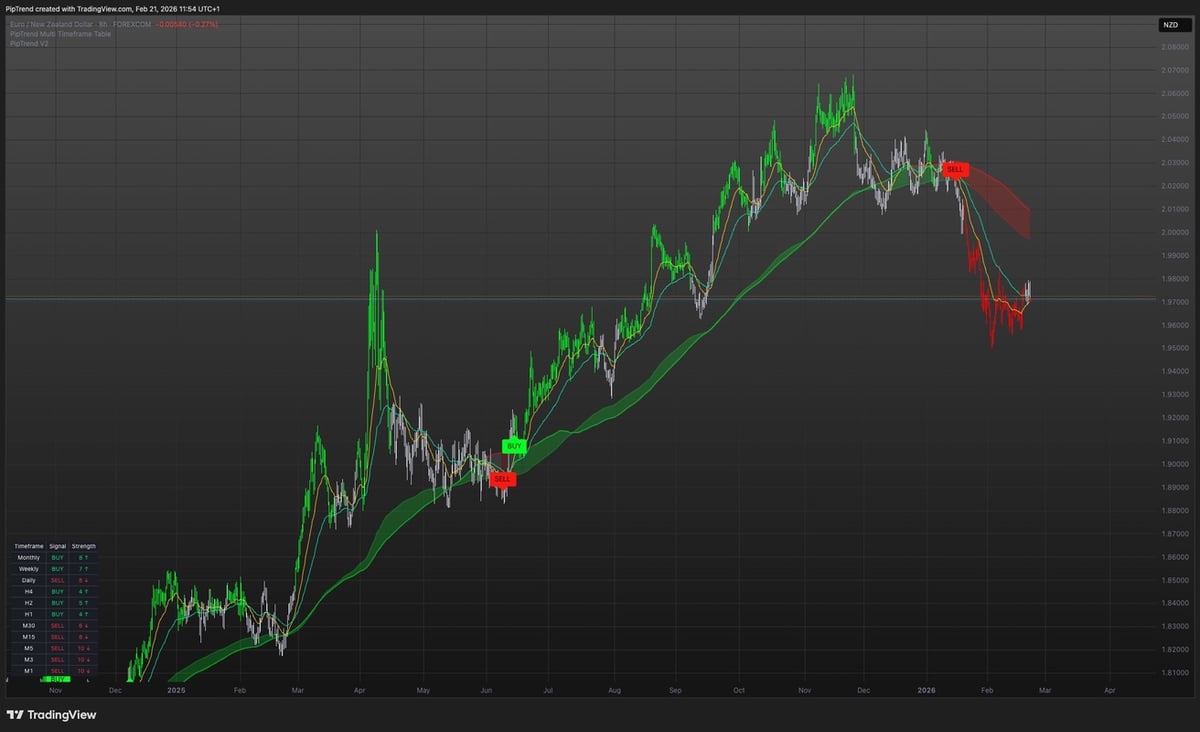
For traders using indicators that provide multi-timeframe confirmation, the golden forex setup becomes even stronger. You want the H4, daily, and weekly trends aligned in the same direction before committing larger position sizes. When all three timeframes show bullish structure and the daily gives you a golden cross, you have institutional and retail money moving together. That's when 1:5 and 1:8 risk-reward setups become realistic.
PipTrend AI Trading Indicator handles this multi-timeframe confirmation automatically, showing you when lower and higher timeframes agree on direction before you risk capital. It removes the manual work of checking three charts and trying to interpret conflicting signals, letting you focus on execution instead of analysis paralysis.
 AI Trading Indicator - PipTrend">
Managing Golden Forex Trades Through Volatility
Once you're in the trade, the hard part starts. Golden forex trends don't move in straight lines. EUR/USD might rally 150 pips over two weeks, but you'll see 60-pip pullbacks that test your conviction. The moving averages give you a framework for holding through noise. As long as price stays above the 50 MA and the 50 stays above the 200, the trend is intact.
You trail your stop using the 20 EMA or the 50 MA depending on how much breathing room you want to give the trade. The 20 EMA keeps you tight and gets you out faster when momentum shifts, usually keeping 60% to 70% of the move. The 50 MA gives more room and keeps you in longer trends, often capturing 80% to 90% of the move but with larger drawdowns during pullbacks. Neither approach is wrong. It depends on your risk tolerance and whether you're managing this as a day trade or a swing position.
What Kills Golden Forex Trades Early
The biggest mistake is ignoring fundamental shifts. A golden cross on USD/JPY looks perfect until the Federal Reserve pivots on rate policy. Suddenly your technical setup is fighting a fundamental wave that doesn't care about moving averages. You need to know the major events on your pair's economic calendar. If NFP, CPI, or central bank meetings are coming within your trade window, either take partial profits before the event or widen your stop to survive the volatility spike.
The second killer is over-leverage. A golden forex trade on the daily chart might take 15 days to reach your 1:4 target. If you're risking 5% of your account per trade because you want faster profits, a single 40-pip stop-out will undo three winning trades. The math doesn't work. Risk 1% to 2% per position and use position sizing that lets you survive three consecutive losses without emotional damage. This keeps you in the game long enough for the probabilities to work in your favor.
False crossovers happen when the moving averages cross by a few pips then immediately cross back the next day. This is why you wait for the candle to close and confirm the cross before planning your entry. Even better, require the 50 MA to be at least 10 pips above the 200 MA and sloping upward. This filters weak crosses that happen during low-volume sessions or holiday weeks when liquidity is thin.
Combining Golden Forex With Session Timing
Not all hours are equal in forex. The golden cross might form on a Monday, but if you enter during the Asian session when London and New York are asleep, you won't get the follow-through. Institutional money moves during London open (3 AM EST) and the New York open (8 AM EST). These are the sessions where trends extend and golden forex setups gain momentum.
If your crossover happens and you're planning a pullback entry, wait for the London or New York session to provide the retest. This gives you volume behind the move and better chances of continuation past your entry. Entering during low-volume Sydney or Tokyo hours often results in your trade sitting flat for 12 hours before it decides which direction to break. That's wasted time and mental capital watching a screen.
| Session | Volatility | Best For Golden Forex |
|---|---|---|
| Sydney | Low | Avoid entries |
| Tokyo | Medium | Watch for setups only |
| London | High | Primary entry window |
| New York | High | Confirmation and re-entries |
Real-world example: GBP/USD forms a golden cross on the daily chart on a Thursday. Price pulls back to the 50 MA on Friday during the New York afternoon session. Volume is dropping as traders head into the weekend. You skip the entry. Monday morning London open, price tests the 50 MA again with a bullish engulfing candle. Now you enter. Same setup, better timing, higher probability of follow-through.

You can find diverse chart examples and community analysis showing how session timing affects golden cross performance across different pairs and market conditions. The consistent theme is that low-volume entries lead to wider stops and longer holding times before the trade works.
Adapting Golden Forex to Different Pairs
Major pairs like EUR/USD and GBP/USD respond well to the 50/200 golden forex setup because they have consistent institutional flow and don't gap wildly overnight. Exotic pairs like USD/TRY or USD/ZAR will give you crossovers, but the spread and overnight swaps make the math unfavorable unless you're targeting 500+ pip moves. The golden cross works best on pairs with tight spreads, high daily volume, and predictable hourly ranges.
JPY pairs move differently. USD/JPY and EUR/JPY often trend longer and smoother than euro or pound crosses. When you get a golden forex signal on a yen pair, the follow-through can last three to six months with minimal chop. The tradeoff is that these trends take longer to develop. You might wait four weeks for the pullback entry while a GBP/USD setup gives you an entry in four days.
Commodity currencies like AUD/USD and NZD/USD are heavily influenced by risk sentiment and commodity prices. A golden cross during risk-on environments when equities are rallying tends to work better than one forming during risk-off periods when traders flee to the dollar. Check the S&P 500 or global bond yields before committing to golden forex trades on commodity pairs. If equities are making lower highs while AUD/USD is forming a golden cross, you have divergence that often resolves against the currency.
Risk-Reward Realities Across Timeframes
Your risk-reward expectations need to match the timeframe and pair. On the H4 chart with a 30-pip stop, targeting 90 pips is realistic on EUR/USD because the average daily range is 70 to 90 pips. You can hit that target within one to two days. But on USD/CHF, which averages 50 pips daily, a 90-pip target might take four days and expose you to multiple pullbacks. Adjust your targets to the pair's personality.
Daily chart setups give you the luxury of wider targets. A 60-pip stop can aim for 240 pips (1:4) on GBP/USD because the weekly range often hits 300+ pips. The challenge is holding through two to three pullbacks that each retrace 50 to 70 pips. Most traders bail on the second pullback even though the trend is still intact. This is where the moving averages save you. If price stays above the 50 and the 50 stays above the 200, you hold.
Golden forex crossovers give you a mechanical edge when you filter them through timeframe, market structure, and session timing. The pattern alone won't make you profitable, but combined with proper risk management and multi-timeframe alignment, it becomes a repeatable system. If you want that confirmation built into your charts without the manual work, PipTrend removes the guesswork and shows you exactly when all timeframes align so you can trade with conviction instead of doubt.