
Most traders lose money because they're fighting 2026 markets with 1980s tools. The gap between what traditional indicators can see and what institutional algorithms actually trade has never been wider. New trading indicators are closing that gap, and if you're still relying solely on standard RSI and moving average crossovers, you're trading blind while everyone else has night vision. The evolution happening right now in technical analysis isn't just incremental-it's a complete rethinking of how we identify opportunities, confirm setups, and manage risk in real time.
The Problem With Traditional Indicators
You already know the classics. MACD gives you divergence. Stochastics tell you overbought and oversold. The Average Directional Movement Index measures trend strength. These tools worked when markets moved slower and algorithms weren't front-running every retail setup. Now they lag so badly that by the time your 20-period moving average crosses the 50, smart money has already taken profit and reversed. Traditional indicators weren't designed for algorithmic trading environments where price can move 50 pips in 12 seconds on a news release.
The real issue isn't that these tools are wrong-it's that they're incomplete. A Stochastic Oscillator might show oversold conditions, but it can't tell you if institutional orders are stacking at that level or if you're catching a falling knife. Standard tools give you pieces of the puzzle without showing you how those pieces connect across timeframes, market sessions, or liquidity zones. You end up with five indicators saying five different things, and you make decisions based on whichever story you want to believe that day.
AI-Powered Pattern Recognition
The first wave of new trading indicators brings machine learning into pattern detection. Unlike static formulas that look for the same shapes regardless of market context, AI-powered systems adapt to changing volatility, different trading sessions, and evolving market structure. QuantAgent frameworks are now processing thousands of price patterns simultaneously, identifying which setups have the highest win rate in current market conditions rather than historical averages.
These systems don't just spot head and shoulders patterns or double bottoms. They recognize micro-structures that human eyes can't catch-subtle order flow imbalances, momentum shifts that precede major moves by 8-15 bars, and institutional accumulation patterns that traditional volume analysis misses entirely. The difference shows up in your win rate. Where a standard breakout strategy might win 42% of the time, an AI-enhanced version of the same basic setup can push that to 61% by filtering out low-probability variations.
What makes this practical for retail traders is that you don't need to build the models yourself. The computational heavy lifting happens in the background. You get clean signals that already incorporate pattern recognition across multiple timeframes. When the 15-minute chart shows a bullish reversal setup, the indicator has already verified that the 1-hour trend supports it, the 4-hour structure allows room to run, and the daily timeframe isn't hitting major resistance in 20 pips.
Multi-Indicator Fusion Systems
Single indicators will always give you single perspectives. New trading indicators are moving toward fusion-combining multiple analytical approaches into unified signal generation. Instead of you manually checking if MACD agrees with RSI while the Commodity Channel Index says something different, fusion systems weight each component based on current market regime and output one clear directional bias.
Technical Indicator Networks represent this evolution perfectly. They take classical tools like moving averages and oscillators but connect them through neural architectures that learn which combinations work in which conditions. During trending markets, the system might weight momentum indicators at 70% and mean-reversion tools at 30%. When volatility compresses and range conditions develop, those weights flip automatically. You're not switching strategies manually-the indicator adapts for you.
The practical edge is consistency. You stop second-guessing whether this particular setup qualifies as a good trade because the fusion system has already processed the checklist. High probability setups get flagged. Low probability noise gets filtered out. The difference in your equity curve over 100 trades is the difference between guessing and knowing which setups actually have statistical edge in real time.
| Indicator Type | Primary Function | Best Market Condition | Typical Lag (Bars) |
|---|---|---|---|
| Traditional Moving Averages | Trend identification | Strong trends, low volatility | 10-20 |
| AI Pattern Recognition | Setup identification | All conditions, adaptive | 2-5 |
| Multi-Indicator Fusion | Signal confirmation | Range and trending markets | 1-3 |
| Sentiment Analysis | Crowd positioning | High volatility, news events | 0-1 |
Sentiment-Based Indicators
Price tells you what happened. Sentiment tells you what's about to happen. New trading indicators are pulling real-time data from news feeds, social media, order flow, and institutional positioning to create sentiment scores that predict momentum shifts before they show up on price charts. Large Language Models analyzing market sentiment can process thousands of data points per second and output a single reading: bullish, bearish, or neutral with a confidence percentage.
This matters most around major news events and session opens. Traditional technical analysis goes blind when NFP drops or the Fed speaks because price action becomes erratic and none of your historical patterns apply. Sentiment indicators keep working because they're measuring the actual cause of price movement-how market participants are interpreting and reacting to information in real time. You can see sentiment turning bearish 3-7 minutes before price confirms the move, giving you time to exit longs or position for the reversal.
The key is combining sentiment with price confirmation. A sentiment indicator showing extreme bullishness doesn't mean go long immediately. It means watch for price to confirm that bullish bias with actual buying pressure on your chart timeframe. When sentiment and price align, you have the kind of confluence that turns 1:1 risk-reward setups into 1:3 runners because you're not fighting the broader market narrative.
Adaptive Volatility Systems
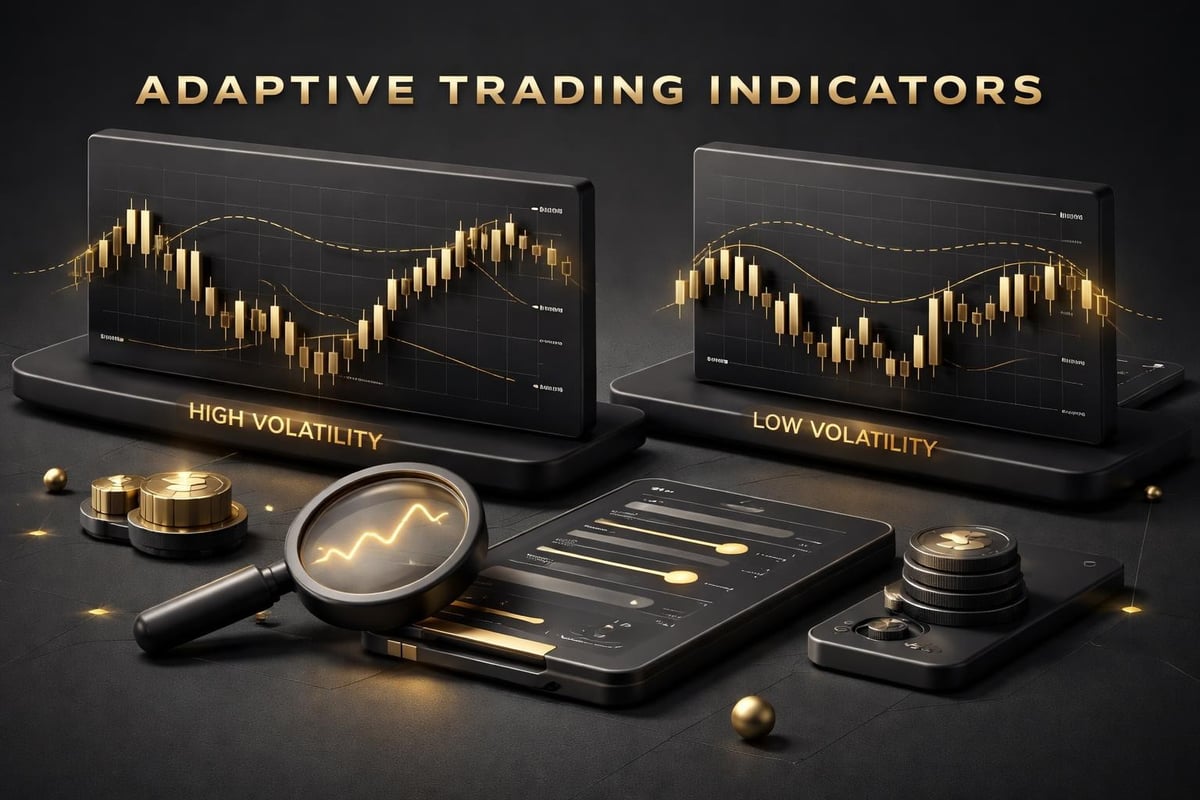
Most indicators use fixed lookback periods. A 14-period RSI is always 14 periods whether the market just printed a 200-pip range day or a 15-pip inside bar. New trading indicators adjust their sensitivity based on realized volatility, giving you sharper signals in quiet markets and smoother readings when price goes chaotic. This prevents the whipsaws that destroy accounts during major economic releases.
Adaptive systems recalculate their parameters every bar. When the ATR expands because volatility is rising, the indicator automatically widens its bands or extends its averaging period to avoid false signals. When volatility contracts and you're trading a 30-pip daily range, it tightens up to catch smaller moves that still represent valid opportunities. You're always trading with appropriate sensitivity for current conditions instead of forcing one-size-fits-all settings across every market regime.
The practical application is simple. You stop getting stopped out by normal market noise during volatile periods because your indicator isn't treating a 15-pip spike the same way it treats a 15-pip move during Asian session consolidation. Your entries improve because the signals you get are calibrated to the reality of how much the market is actually moving right now, not how much it moved on average over the past month.
Multi-Timeframe Confirmation Tables
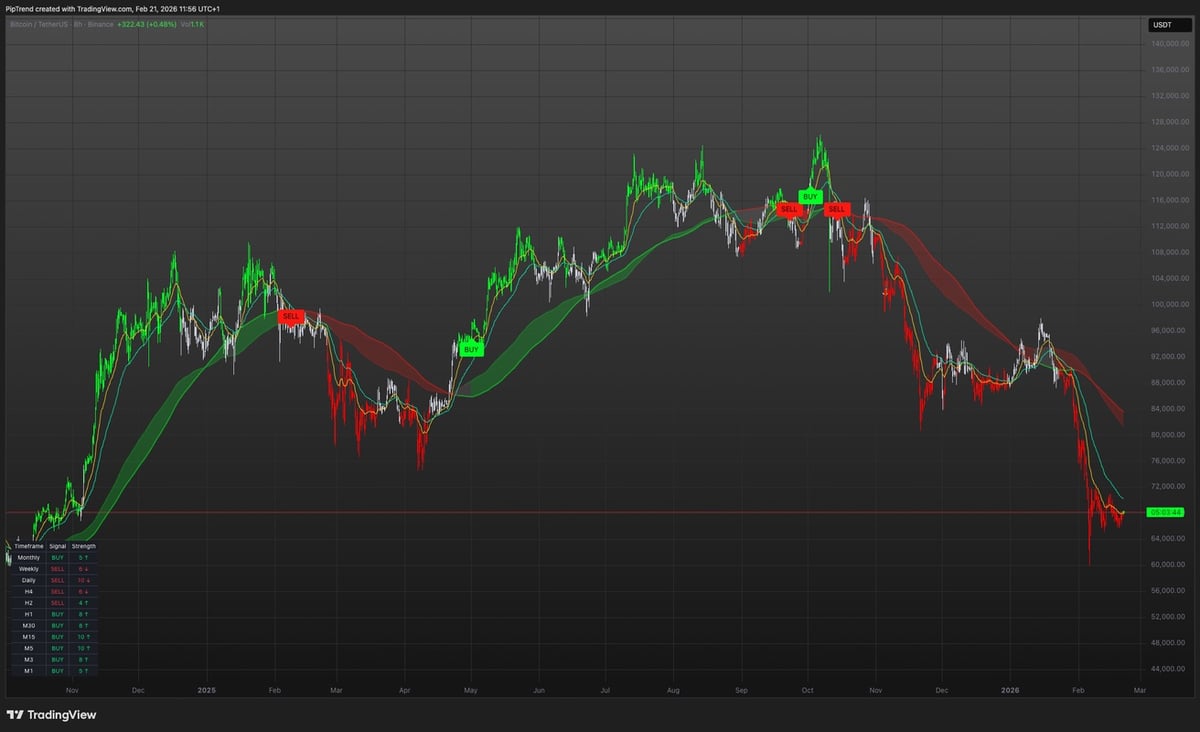
Checking multiple timeframes manually is tedious and slow. By the time you've verified that the 1-hour, 4-hour, and daily charts all support your 15-minute entry, price has moved 20 pips and your setup is gone. New trading indicators build multi-timeframe analysis directly into the display, showing you instant confirmation across all relevant periods in a single dashboard table.
These confirmation tables typically track trend direction, momentum strength, and support/resistance proximity on five to seven timeframes simultaneously. Green across the board means everything aligns-you have edge. Mixed signals mean you're trading into conflict, and historical data shows those setups win maybe 35% of the time. Having this information visible in one glance changes how you filter opportunities. You naturally become more selective because you can see immediately which setups have true multi-timeframe support and which are just noise on one chart period.
For swing traders working daily charts, this means checking weekly and monthly context without opening separate chart windows. For scalpers on the 5-minute, it means confirming that 15-minute and 1-hour trends aren't about to reverse into your position. The time saved is significant-maybe 30-40 seconds per setup evaluation-but over a full trading session that compounds into staying ahead of moves instead of chasing them after they've started.
Order Flow Integration
Price charts show you the result of transactions. Order flow shows you the transactions themselves-where big players are actually placing their orders, how much size is hitting the bid versus the offer, and where absorption is happening that will turn into reversals. Newer trading indicators are integrating order flow metrics so retail traders can see the same institutional footprints that were previously hidden behind expensive platforms.
When you see price making new highs but order flow showing net selling, you have divergence that predicts reversal before any price-based indicator can catch it. When price is consolidating but heavy buy orders are stacking at a specific level, you know that's where institutional traders are building positions, and a breakout from that zone has higher probability because real capital is behind it. Traditional volume analysis can't tell you this because volume alone doesn't distinguish between aggressive buying and passive selling.
The challenge is that raw order flow data is overwhelming. Good indicators filter it down to actionable signals-color-coded zones showing where institutional orders are concentrated, alerts when delta (buy volume minus sell volume) diverges from price movement, and visual markers when absorption patterns suggest a reversal is forming. You're not watching every tick; you're getting the insights that matter for your trading decisions.
Session-Based Timing Indicators
Not all trading hours are equal. The edge you have during London open volatility disappears during the dead zone between New York close and Tokyo open. New trading indicators track trading sessions and liquidity windows, giving you visual cues about when high-probability setups are most likely to develop and when you should simply stay out.
These indicators color-code your chart based on active sessions-London in green, New York in blue, Asian session in yellow-and they mark the overlap periods where two major sessions trade simultaneously and liquidity peaks. More importantly, they adjust signal generation based on which session is active. A breakout signal during London-New York overlap has statistical edge. The same technical setup during Sydney session often fails because there isn't enough volume to sustain momentum.
You improve your win rate not by finding better setups but by taking the same setups during better timing windows. If your current strategy wins 50% of the time overall, filtering trades to only London and New York hours might push that to 58% without changing anything else about your approach. Session-based indicators make that filtering automatic. You see fewer signals, but the ones you see have higher probability because they occur when the market structure supports follow-through.
Reinforcement Learning Decision Systems
The most advanced new trading indicators use reinforcement learning to improve their own performance over time. Unlike static systems programmed with fixed rules, these indicators learn from outcomes-which signals led to winners, which led to losers, and how to adjust future signal generation to maximize edge. Multi-indicator guided reinforcement learning systems can process years of market data and optimize signal accuracy beyond what manual backtesting ever achieves.
This doesn't mean the indicator is trading for you. It means the indicator is getting better at identifying which price patterns, momentum setups, and confluence scenarios actually work in current market conditions. The system might discover that during high-volatility regimes, your standard entry rules need tighter confirmation, or that certain candlestick patterns on the 1-hour chart only work when daily ATR is above 80 pips. These are insights you'd never catch manually, but the learning algorithm finds them by testing thousands of variations.
For traders, this manifests as increasing win rates over time as the indicator refines its filters. A system you install in January might generate 15 signals per week with 52% accuracy. By June, it's generating 11 signals per week with 59% accuracy because it learned which six signals per week were statistical noise. Your job stays the same-execute the signals the indicator provides-but your results improve because the indicator itself is evolving.
Practical Integration Strategy
You don't need to abandon every tool you currently use. The smartest approach is layering new trading indicators on top of your existing foundation to add what's missing. If you trade a moving average crossover system, add an AI-powered pattern filter that only allows signals when higher timeframes confirm. If you use support and resistance zones, add a sentiment indicator that tells you whether buyers or sellers are actually showing up at those levels.
Start with one new indicator and measure its impact on your next 30 trades. Track whether it helped you avoid losers, catch bigger winners, or stay out during choppy conditions where you would have taken heat. If it doesn't improve your results measurably, it's not adding edge-it's adding complexity. The goal isn't to have more indicators on your screen; it's to have better information feeding your trading decisions.
Many traders using the PipTrend AI Trading Indicator report that the multi-timeframe confirmation table alone cut their losing trades by roughly 40% because they stopped taking setups that only looked good on one chart period. The trend clarity dashboard removed the guesswork about whether the market was actually trending or just chopping, preventing them from forcing momentum trades into range conditions. These aren't revolutionary changes to strategy-they're incremental improvements in execution quality that compound into significantly better monthly returns.
 AI Trading Indicator - PipTrend">
Avoiding Indicator Overload
More indicators don't equal more profit. They equal more confusion and paralysis when signals conflict. The entire point of new trading indicators is that they consolidate multiple analytical functions into unified outputs, reducing screen clutter while increasing informational value. If you're running eight separate windows and trying to mentally synthesize what they're all saying, you've missed the point.
Limit yourself to three core functions: trend identification, momentum confirmation, and risk level assessment. Everything else is supplementary. Your trend tool tells you the primary direction you should be trading. Your momentum tool tells you when the trend is strong enough to justify entry. Your risk tool tells you where the setup invalidates and you should exit. New trading indicators can handle all three functions in a single interface, but you need to actually trust the synthesis instead of second-guessing it with ten additional oscillators.
The traders who succeed with modern tools are the ones who simplify their decision-making process, not complicate it. You want to look at your chart and know in three seconds: Is there a trade here? Yes or no. If you can't answer that quickly, you have too much noise and not enough signal. Cut ruthlessly until your setup identification is fast and your execution is confident.
New trading indicators aren't replacing traditional technical analysis-they're completing it by adding the dimensions that classic tools were never designed to handle. When you combine adaptive systems, multi-timeframe confirmation, sentiment analysis, and AI-powered pattern recognition, you stop trading on incomplete information and start trading with genuine statistical edge. PipTrend delivers exactly that kind of clarity by filtering out low-probability setups and showing you only the trades where all the pieces align across timeframes, trend structure, and momentum. Stop second-guessing every decision and start trading with the conviction that comes from knowing the market's true direction.