
Most traders blow their accounts because they use daily chart indicators on 5-minute charts and wonder why every signal fails. Intraday technical indicators demand different rules, different settings, and a completely different interpretation than swing trading tools. The market moves fast when you're trading multiple times per day, and lag kills profits faster than any directional mistake. You need indicators that respond to real-time momentum shifts without whipsawing you out of every quality setup.
Why Standard Indicators Fail Intraday Traders
The 14-period RSI your favorite analyst recommends works beautifully on the daily timeframe. On a 1-minute chart, it oscillates so violently you'll enter overbought and exit oversold twenty times before lunch. Intraday trading indicators require faster lookback periods and tighter confirmation windows because you're dealing with price action that refreshes every 60 seconds, not every 24 hours.
Standard moving averages smooth out too much information on lower timeframes. A 50-period SMA on a 5-minute chart only covers four hours of data, barely enough to establish meaningful trend context. You miss the overnight gaps, the session opens, and the institutional flows that actually drive intraday movements. This creates false trend readings exactly when you need precision most.
Volume behaves differently intraday too. The first 30 minutes of the New York session might see more volume than the entire Asian session combined. If your volume indicators don't account for these natural ebbs and flows, you'll interpret normal midday quiet as bearish divergence and miss continuation setups all afternoon.

VWAP: The Institutional Anchor Point
Volume-weighted average price gives you the one reference point every institutional desk watches. Unlike moving averages that weight each period equally, VWAP calculates the average price weighted by volume at each price level since the market opened. When price trades above VWAP, the session trend leans bullish. When price trades below it, sellers control the tape.
The real edge comes from how institutions use VWAP to measure execution quality. A buy-side desk accumulating 50,000 shares wants an average entry below VWAP. They're not chasing price above that line, which creates natural resistance. When you see price approaching VWAP from below with declining momentum, that's often your short entry as the desk stops buying.
VWAP bands add standard deviation levels above and below the core line, similar to Bollinger Bands but volume-weighted. The first standard deviation band typically sits around 0.5% from VWAP on liquid pairs. When price reaches the second deviation band (roughly 1% away), you're at statistical extremes where mean reversion becomes likely. These aren't automatic entries but they tell you where the odds shift.
Most traders don't realize VWAP resets daily, which makes it perfect for day trading but useless for swing trades. The calculation starts fresh at the session open and runs until the close. This daily reset keeps VWAP responsive to current session dynamics rather than dragging historical bias into today's tape. You're trading today's auction, not last week's price action.
VWAP Strategy Setup
You want price to pull back to VWAP after establishing a directional move away from it. Say EUR/USD gaps up at the London open and trades 40 pips above VWAP for the first hour. When price dips back to test VWAP around 9:30 AM ET, that's your long entry with a tight stop below VWAP. Your target becomes the morning high or the second deviation band, whichever comes first. Risk-reward typically runs 1:2 or better on clean VWAP bounces.
The key filter is volume confirmation. If price approaches VWAP on declining volume, the test lacks conviction and often fails. You want to see volume pickup as price reaches VWAP, signaling genuine buying interest defending that level. Without volume, you're catching a falling knife dressed up as a bounce.
Momentum Oscillators With Intraday Settings
RSI works intraday when you adjust the period length and interpretation. Drop from 14 periods to 7 or 9 periods for faster response to momentum shifts. On a 5-minute chart, a 9-period RSI gives you meaningful overbought/oversold readings without the constant whipsaw of ultra-short settings. You're capturing the last 45 minutes of price action, enough context without excessive lag.
Forget the standard 70/30 overbought/oversold levels for trending intraday markets. In a strong trend, RSI will sit above 70 for hours while price continues higher. Instead, use RSI to identify momentum pullbacks within the trend. When the broader timeframe shows uptrend and RSI on your entry timeframe dips to 40, that divergence from extreme readings often marks your entry point.
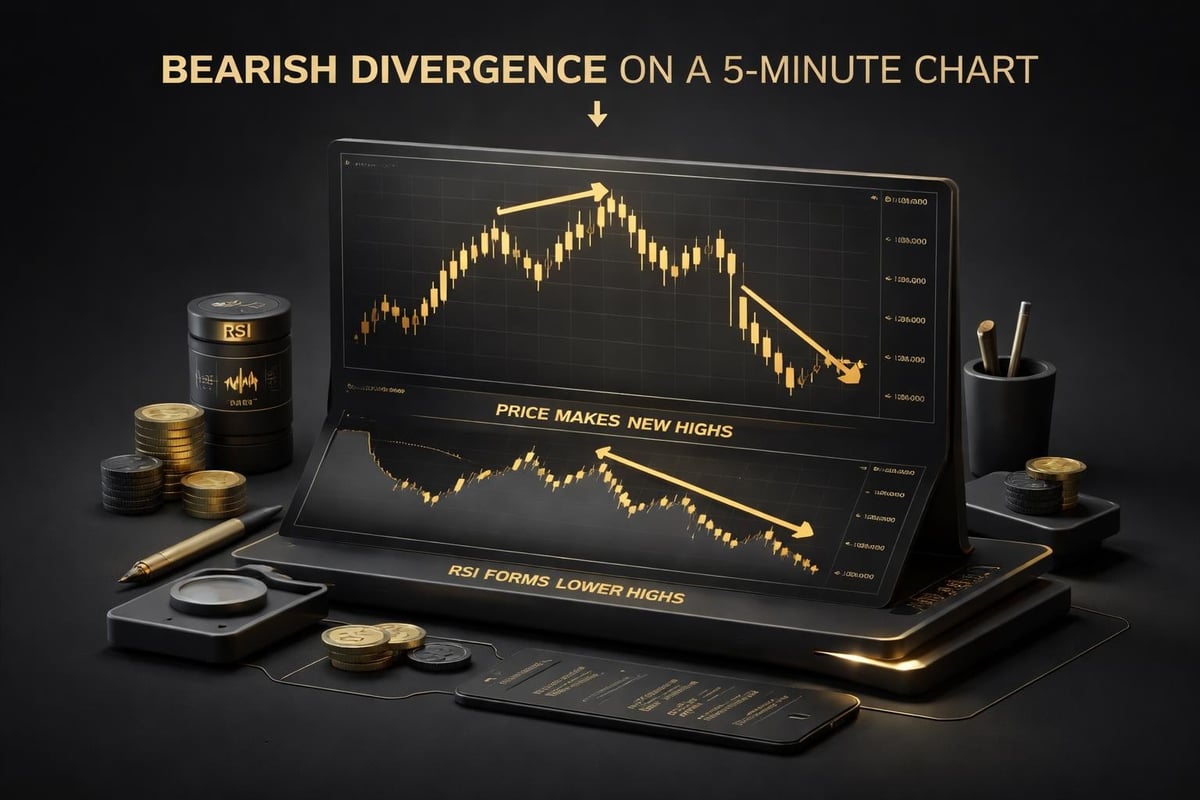
MACD histogram tells you when momentum is expanding or contracting better than the MACD line crossovers everyone watches. When the histogram makes higher highs while price makes higher highs, momentum is accelerating. When the histogram peaks and starts declining while price continues higher, that's bearish divergence warning you the move is exhausting. This works particularly well on 15-minute charts where you need advance warning before reversals.
Moving Average Configurations That Don't Lag
The problem with simple moving averages intraday is they tell you what happened, not what's happening. Exponential moving averages weight recent price action heavier, which helps, but you still need the right combination. The 9 EMA and 21 EMA pairing on 5-minute charts gives you fast and slow averages with enough separation to identify crossovers early.
When the 9 EMA crosses above the 21 EMA, you've got bullish momentum building. But the cross alone isn't your entry. You wait for price to pull back and test the 9 EMA as support. If price bounces off the 9 EMA with a strong rejection candle, that's confirmation. Your stop sits just below the 21 EMA and your target aims for the next obvious resistance level or a 1.5:1 risk-reward minimum.
The 200 EMA on lower timeframes acts as the trend filter most traders ignore. Even on a 5-minute chart, the 200 EMA shows you the dominant 16-hour trend direction. You only take long setups when price trades above the 200 EMA. You only short when price trades below it. This one filter eliminates the majority of low-probability counter-trend trades that bleed accounts slowly.
Hull Moving Average deserves mention because it reduces lag more aggressively than standard EMAs while maintaining smooth trend representation. The calculation uses weighted moving averages and square root periods to nearly eliminate lag. On choppy intraday markets, HMA gives you earlier trend change signals, though you pay for that speed with slightly more false signals during consolidation.
Volume Analysis Beyond the Basics
On-balance volume tracks cumulative volume flow by adding volume on up days and subtracting volume on down days. The resulting line shows you whether volume is accumulating during rallies or during selloffs. When price makes new highs but OBV doesn't confirm with new highs, you've got bearish divergence suggesting the rally lacks institutional support.
Volume-weighted moving averages give more weight to periods with higher volume, which matters when a single high-volume 5-minute bar contains more trading activity than the previous hour combined. This creates a more accurate average price level where the bulk of institutional money changed hands. You're identifying value areas, not just price averages.
Comparing current bar volume to the 20-period average volume tells you when unusual activity enters the market. When volume spikes to 2x or 3x the average, someone's making a directional bet worth following. These volume surges often occur right before breakouts from consolidation patterns or at the start of major trend moves. Understanding which indicators matter for your specific strategy separates profitable traders from those just adding more lines to their charts.
| Indicator | Optimal Timeframe | Primary Use | Key Setting |
|---|---|---|---|
| VWAP | 5-min to 15-min | Institutional reference | Daily reset |
| RSI | 5-min | Momentum pullbacks | 7-9 period |
| EMA Cross | 5-min | Trend confirmation | 9/21 pair |
| Volume | All timeframes | Confirmation filter | 20-period average |
Multi-Timeframe Indicator Alignment
Your entry timeframe gives you precision but your confirmation timeframe gives you direction. Most successful intraday traders use a 3:1 or 5:1 ratio between timeframes. If you enter on 5-minute charts, you confirm on 15-minute or 25-minute charts. If you enter on 1-minute charts, you confirm on 5-minute charts. This ensures your trade aligns with the larger momentum wave.
All your intraday technical indicators should agree across both timeframes before you risk money. Say the 15-minute chart shows price above VWAP, RSI at 45 (neutral with room to run), and the 9 EMA above the 21 EMA. Now you drop to the 5-minute chart and wait for a pullback setup. When the 5-minute RSI dips to 35 and price tests the 9 EMA, you've got multi-timeframe alignment and a high-probability entry.
The mistake is taking every 5-minute setup regardless of the 15-minute context. That's how you catch perfect entries that reverse 3 minutes later because you traded against the bigger trend. Multi-timeframe analysis doesn't mean watching six charts simultaneously. It means checking your confirmation timeframe once, identifying the trend and key levels, then working your entries on the faster timeframe within that context.
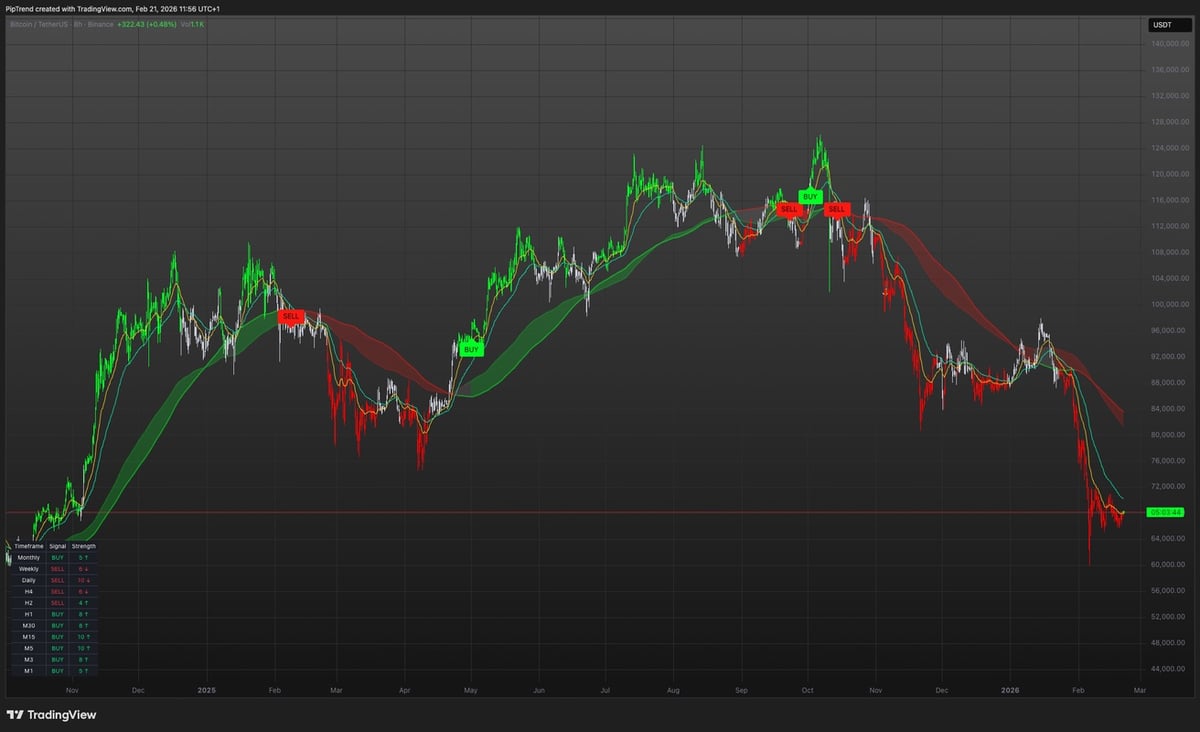
For day trading, tools like PipTrend AI Trading Indicator automatically display multi-timeframe trend alignment in a single table, eliminating the need to manually check three different chart windows before every trade. You see instantly whether the 5-minute, 15-minute, and 1-hour trends all point the same direction, which dramatically improves setup quality.
Volatility Indicators for Position Sizing
Average True Range measures recent price volatility, which directly impacts your stop placement and position size. A pair with an ATR of 50 pips on the 5-minute chart needs wider stops than a pair with 20-pip ATR. If you use fixed 10-pip stops across all pairs regardless of volatility, you'll get stopped out on normal price noise.
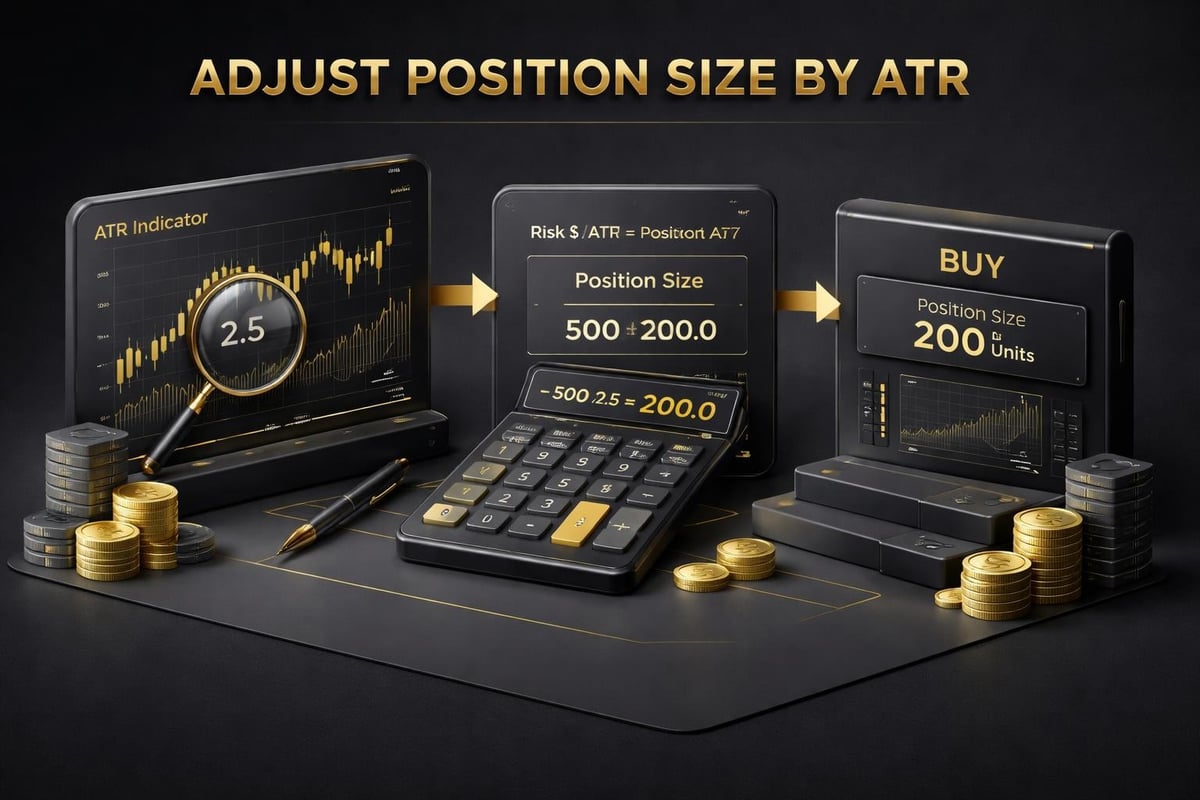
Calculate position size based on ATR to maintain consistent dollar risk. If your risk tolerance is $100 per trade and the current ATR is 25 pips, you can trade 4 micro lots with a 25-pip stop (100 trades at $1/pip each). When ATR expands to 50 pips, you drop to 2 micro lots. This keeps your actual risk constant while letting market volatility dictate your technical stop placement.
Bollinger Band width shows you when volatility is contracting or expanding. When the bands squeeze together, volatility is low and a breakout becomes likely. When the bands widen dramatically, volatility is high and mean reversion setups work better than breakout trades. This context prevents you from chasing breakouts right as volatility peaks and reversal odds increase.
Standard Bollinger Band settings (20 period, 2 standard deviations) work fine on 5-minute charts, but consider dropping to 1.5 standard deviations on faster timeframes. The tighter bands give you earlier signals of price reaching statistical extremes without widening so much that price constantly trades outside them.
Session-Based Indicator Interpretation
The same indicator reading means different things during different trading sessions. An RSI reading of 65 during the London session might signal continuation as European institutions push through stops. That same 65 reading during the Asian session often marks exhaustion because volume and momentum can't sustain the move.
VWAP becomes less reliable after the New York close when volume drops significantly. The calculation still runs but with lower volume, a few large trades can distort VWAP away from true institutional value. Focus your VWAP strategies on the first six hours of the New York session when volume is heaviest and the indicator most accurately reflects institutional activity.
Moving average crossovers generate more false signals during low-volume sessions. The 9/21 EMA cross that works beautifully from 8 AM to 12 PM ET will whipsaw you constantly during the overnight session when price drifts rather than trends. Adjust your indicator sensitivity based on session volume or simply avoid trading the slowest six hours of the day.
Volume spikes also require session context. A volume surge at 9:30 AM ET is normal as New York opens. A volume surge at 2 AM ET signals actual unusual activity worth investigating. The best technical indicators for intraday trading don't just show you data, they help you interpret what that data means given current market conditions.
Combining Trend and Momentum Indicators
Trend indicators tell you direction. Momentum indicators tell you strength. You need both to trade intraday effectively. The classic combination is moving averages for trend plus RSI for momentum. When price trades above the 200 EMA (trend) and RSI pulls back from overbought to 50 (momentum reset), you've got the setup that produces the highest win rates.
Using only trend indicators leaves you entering exhausted moves right before reversals. Using only momentum indicators has you fading trends that run far beyond historical norms. The combination provides checks and balances where one confirms or contradicts the other's signal.
MACD gives you both trend and momentum in one indicator through its dual components. The MACD line crossing the signal line shows trend change. The histogram height shows momentum strength. When the MACD line crosses bullish while the histogram makes higher lows, you've got a high-conviction setup. When the MACD crosses bullish but the histogram barely moves, that's a low-conviction signal you skip.
Creating an indicator checklist prevents emotional trading. Before entering any position, verify your trend indicator confirms direction, your momentum indicator confirms strength, and your volume indicator confirms participation. Three green lights, you trade. Two or fewer, you wait. This systematic approach removes the gut-feel decisions that destroy consistency.
Indicator Pitfalls That Cost Money
Repainting indicators change their historical signals after the bar closes, making backtests look perfect while live trading results disappoint. Many custom indicators marketed to retail traders repaint aggressively. Unlike tools that repaint their signals, the standard intraday technical indicators covered here display final values that don't change once the bar closes. VWAP doesn't repaint. RSI doesn't repaint. Moving averages don't repaint.
Too many indicators create analysis paralysis and conflicting signals. You'll find setups where five indicators scream buy and three scream sell, leaving you frozen. Stick to three or four core indicators you understand deeply rather than fifteen you barely comprehend. Mastery beats quantity every time in trading.
Optimizing indicator settings to past data creates curve-fitted systems that fail going forward. Yes, a 13-period RSI might have worked better than 9-period last month. But switching settings monthly means you're always trading last month's optimal configuration on this month's different market. Pick settings based on sound logic, not optimization, then leave them alone.
Ignoring price action while obsessing over indicators is the fastest way to lose money. Indicators are derived from price, not the other way around. When price shows a clear rejection pattern but your indicator hasn't crossed yet, trust price. Indicators confirm what price already told you. They're not crystal balls predicting the future.
| Common Mistake | Impact | Solution |
|---|---|---|
| Using daily settings on 5-min charts | Excessive lag and missed entries | Reduce lookback periods by 50-70% |
| Trading every indicator signal | Overtrading and increased commissions | Require multi-timeframe confirmation |
| Ignoring session volume patterns | False signals during quiet hours | Avoid trading during lowest volume sessions |
| Constant setting optimization | Curve-fitting and forward failure | Use logical settings and maintain consistency |
Building Your Intraday Indicator Stack
Start with VWAP as your anchor point for institutional reference. Add the 9/21 EMA crossover on your entry timeframe for trend direction. Include a 7-period RSI for momentum confirmation. Finish with volume comparison to 20-period average for participation confirmation. That's four indicators covering trend, momentum, institutional levels, and volume.
Test your stack on replay data or a demo account for at least 50 trades before risking real money. Track which indicator combinations produce the highest win rate and best risk-reward. You'll likely find certain setups work better on certain pairs or during certain sessions. That's valuable data worth documenting.
Create written rules for your indicator interpretation. "I only take long setups when price is above VWAP and the 200 EMA, RSI is between 30-50, and volume exceeds 1.5x average." Specific rules eliminate decision-making during the heat of the trade. You either have your setup or you don't.
Evolve your stack slowly based on real trading results, not theoretical improvements. If you're profitable with your current indicators, resist the temptation to add "just one more" signal filter. Complexity doesn't improve results once you've achieved consistency. Day trading guides often push indicator variety over mastery, but professional traders typically use fewer indicators better rather than more indicators poorly.
Risk Management Through Indicator Signals
Your indicators should inform your stop placement, not arbitrary pip amounts. If you enter long at a VWAP bounce, your stop belongs below VWAP. If you enter on a moving average cross, your stop sits below the slower moving average. This creates logical invalidation points where the technical setup has definitively failed.
Scale position size based on indicator strength. A setup where all indicators align strongly might justify 1.5% account risk. A marginal setup where indicators barely meet your criteria deserves only 0.5% risk or possibly no trade at all. Not every signal deserves equal commitment.
Use indicator divergence as early warning for exits. When price makes new highs but RSI makes lower highs, that's your signal to move stops to breakeven or take partial profits. You don't need to exit completely but you should reduce exposure when momentum warns of potential reversal.
Time-based stops matter intraday as much as price-based stops. If your setup hasn't moved in your favor within 30 minutes on a 5-minute chart, something's wrong with the trade. The expected catalyst didn't materialize. Exit at breakeven or a small loss rather than hoping dead trades eventually work. Your capital is better deployed in the next high-probability setup.
Intraday technical indicators work when you respect timeframe differences, session dynamics, and the relationship between trend and momentum. The traders who succeed don't use exotic proprietary indicators, they use standard tools with precise interpretation and strict risk management. If you're ready to trade with indicators that provide instant trend clarity and filter out low-probability noise, PipTrend delivers multi-timeframe confirmation and institutional timing in one clean interface designed for traders who want conviction, not confusion.