Momentum Indicator: A Trader's Guide to Reading Price Strength
On this page
Why Momentum Confuses More Traders Than It Helps
Ask ten traders what a momentum indicator tells them and you’ll get ten different answers. Some say it flags reversals. Others say it confirms trends.
Both groups are half right, which is exactly the problem.
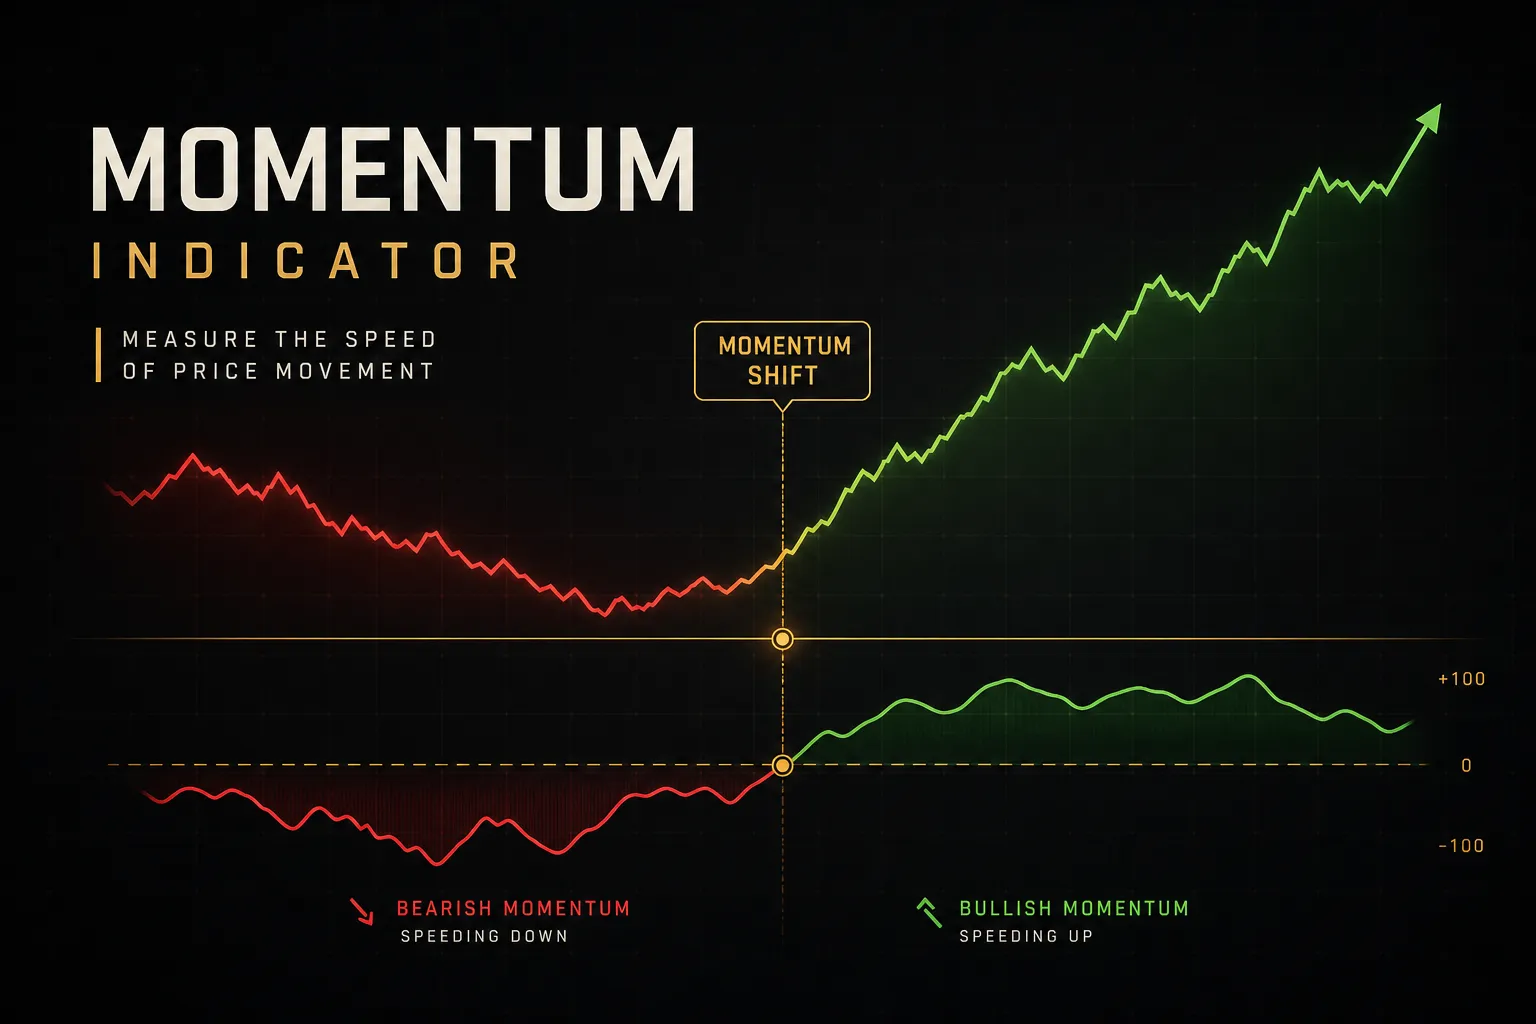
Momentum measures the speed and acceleration behind price movement.
Not direction. Not value. Speed.
A stock can be rising while its momentum falls, and that combination means something entirely different from a stock rising with momentum expanding.
The confusion multiplies because most guides collapse two separate things into one word. There’s the classic Momentum indicator (sometimes labeled MTM), a specific formula comparing current price to price N periods ago. And there’s the broader category of momentum oscillators: RSI, MACD, Stochastic, Rate of Change.
Related cousins, not identical twins.
Traders who blur those lines end up stacking three indicators that measure the same thing, then wonder why “confirmation” keeps failing them. Three tools agreeing on the same input is not confirmation.
It’s an echo.
This guide separates them properly. You’ll learn how the core calculation works and why platforms display it differently, how the same reading flips meaning between trending and range-bound markets, how regular divergence differs from hidden divergence, and how to build a confirmation workflow you can repeat instead of improvising.
By the end, momentum stops being a mystery signal and becomes what it should have been all along: one measurable input in a structured decision process.
What a Momentum Indicator Actually Measures
Imagine a car accelerating from a stoplight. Its speedometer tells you how fast it’s going. Momentum, in market terms, tells you whether that speed is increasing or decaying.
Price can still be climbing while momentum collapses, the same way a car still moves forward after the driver lifts off the gas.
That distinction is everything.
Direction and price acceleration are separate pieces of information, and momentum only reports on the second one.
The Core Formula
The classic momentum calculation is refreshingly simple. Take today’s closing price and subtract the closing price from N periods ago.
Momentum = Current Close − Close N periods ago
With a 14-period setting, if EUR/USD closes at 1.0950 today and closed at 1.0900 fourteen sessions back, momentum reads +0.0050. Positive number, price is higher than it was.
Simple subtraction, nothing more.
The variant version divides instead of subtracts, then multiplies by 100:
Momentum = (Current Close ÷ Close N periods ago) Ã, 100
Same underlying comparison, different presentation.
That single formatting choice creates most of the confusion traders run into when they switch platforms.
Zero or 100? Platform Differences
Subtraction-based momentum oscillates around zero. Above zero means price is higher than N periods ago, below zero means lower, and a zero-line crossover marks the moment that comparison flips.
Ratio-based momentum oscillates around the 100 baseline instead.
A reading of 102 means price is 2% above where it sat N periods ago. A reading of 97 means it’s 3% below.
Functionally identical. Cosmetically confusing.
A trader who learned “cross above zero” on TradingView and then opens a platform centered on 100 will stare at readings of 99.4 and wonder what broke.
The ratio version has one practical advantage: it normalizes across instruments. A 50-point move means something different on a $30 stock than on a $3,000 index, but a reading of 103 means the same 3% shift either way.
Momentum vs Rate of Change
Rate of Change (ROC) is the percentage-expressed sibling of classic momentum, calculated as the difference divided by the older price, times 100. It centers on zero and reads in percentage terms.
So you have three near-identical tools wearing different clothes.
Classic Momentum reports an absolute price difference. Ratio momentum reports a normalized index around 100. Rate of change reports a percentage around zero.
Running Momentum and ROC side by side is not confirmation. It’s the same measurement displayed twice.
Whichever version your platform serves, the interpretation logic holds. Readings above the baseline signal upward acceleration. Below the baseline signals downward acceleration.
And crossing the baseline signals a change in speed relationship, not an automatic change in trend direction.
That last point trips up more traders than any other. A zero-line cross means today’s price finally overtook the price from N bars ago. In a choppy market, that can happen four times in a week while the underlying trend goes nowhere.
Context decides whether the cross matters.
Momentum, RSI, MACD, Stochastic: The Overlap Problem
Here’s an uncomfortable truth about most indicator panels: half the tools on the chart are computing variations of the same number. RSI, Stochastic, MACD, and classic Momentum all trace back to comparing recent price against earlier price.
They differ in scaling and smoothing, not in source material.
Understanding those differences is what lets you build a panel that actually adds information.
| Indicator | Input Data | Scale | Smoothing Method | Typical Lookback |
|---|---|---|---|---|
| Momentum (MTM) | Close vs close N periods ago | Unbounded (0 or 100 centered) | None (raw difference) | 10 to 14 |
| Rate of Change (ROC) | Close vs close N periods ago | Unbounded, zero-centered % | None | 9 to 14 |
| Relative Strength Index | Average gains vs average losses | Bounded 0 to 100 | Wilder’s smoothed average | 14 |
| Stochastic Oscillator | Close relative to high-low range | Bounded 0 to 100 | 3-period SMA on %K | 14, 3, 3 |
| MACD | Difference of two EMAs | Unbounded, zero-centered | Double exponential + signal line | 12, 26, 9 |
Read that table column by column and the family resemblance jumps out. Every one of them is a momentum oscillator in the technical sense.
What separates them is how aggressively they smooth and whether they cap their output.
The relative strength index compares the magnitude of recent gains against recent losses, then compresses the result into a 0-100 range. That bounding is why RSI can pin at 78 for three weeks in a strong uptrend while classic Momentum keeps expanding without limit.
Same market, two different stories about what “extreme” means.
The stochastic oscillator asks a narrower question: where does the current close sit inside the recent high-low range? It reacts faster than RSI, which makes it noisier and more prone to whipsaw in trending conditions.
MACD sits apart because it derives from moving averages rather than raw price comparison. That extra smoothing layer makes it slower to fire and better suited to trend strength assessment than to spotting short-term exhaustion.
The Redundancy Risk of Stacking Oscillators
Load RSI and Stochastic on the same chart and watch them. They turn at nearly the same bars, hit extremes together, and diverge together. When both flash oversold, you haven’t received two votes.
You’ve received one vote, counted twice.
That false sense of agreement is dangerous because it inflates confidence right when caution matters most. Correlated indicators fail together, usually during exactly the regime shift you needed warning about.
Real confirmation comes from tools measuring different dimensions of the same move:
- Momentum plus trend: pair an oscillator with a 50 or 200-period moving average confirmation, or with ADX to gauge whether a trend has enough strength to sustain continuation signals.
- Momentum plus volatility: average true range tells you whether the current move is large relative to normal conditions, which affects stop placement and position sizing far more than another oscillator would.
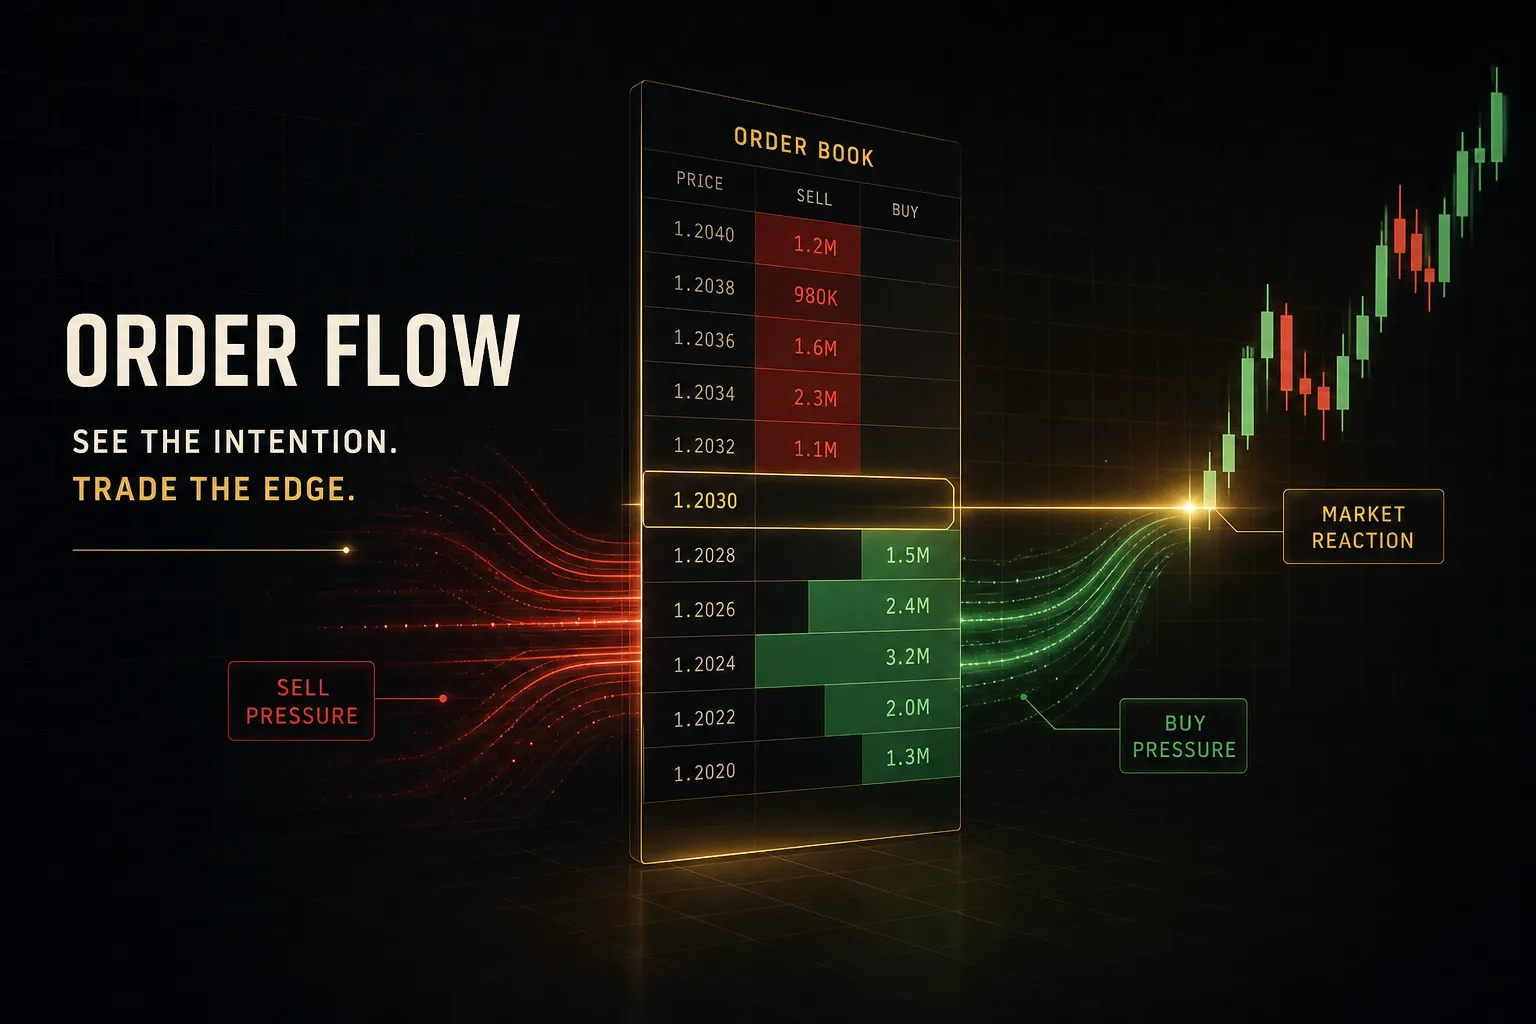
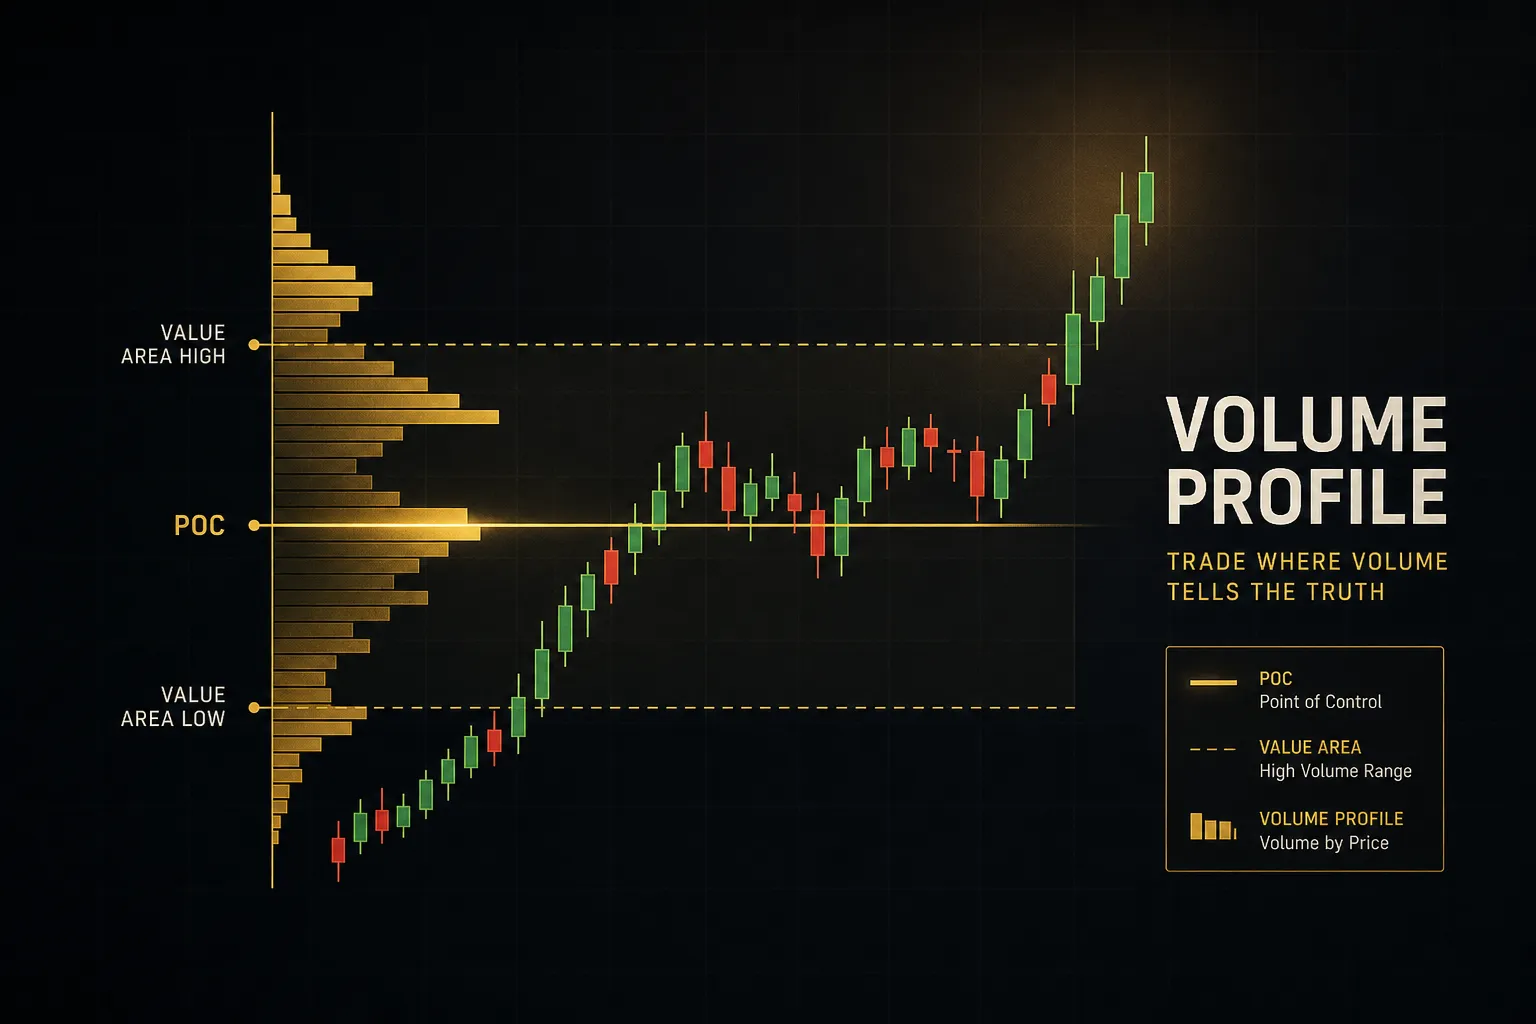
- Momentum plus participation: volume or order flow reveals whether real capital is behind the acceleration or whether it’s a thin-liquidity drift.
- Momentum plus structure: support and resistance levels give a momentum reading somewhere to fail or break, which is where the actual trade decision lives.
One momentum tool is usually enough.
What you add next should answer a question the first tool cannot.
Reading Momentum in Real Market Conditions
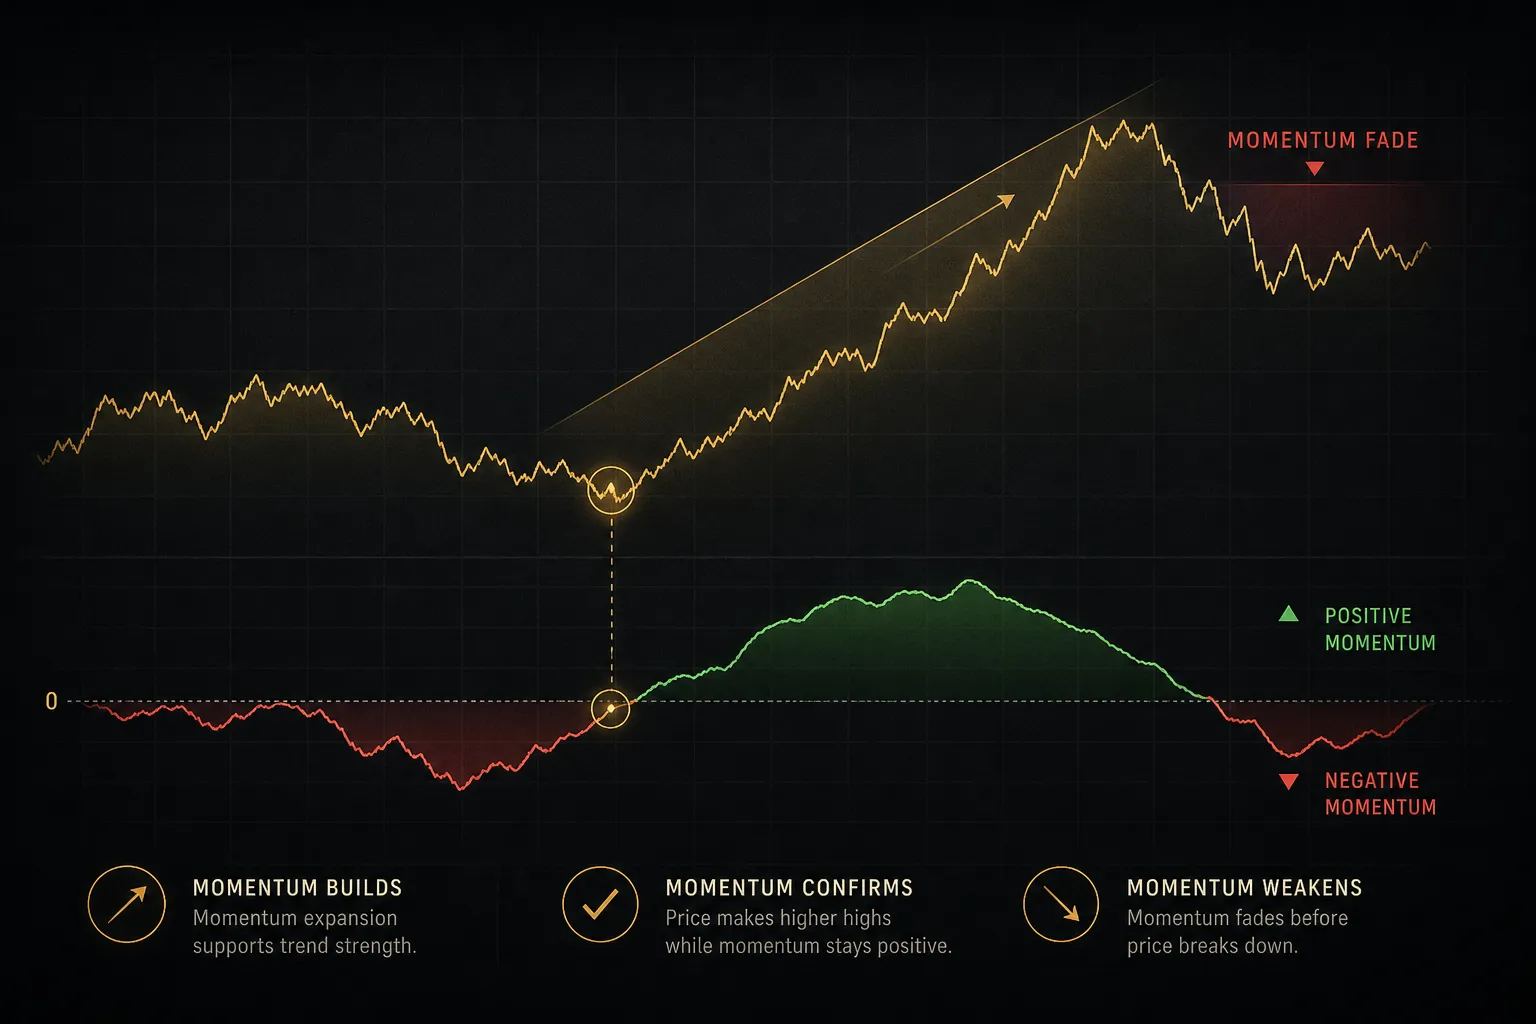
A trader shorts a stock because RSI hit 75. The stock rallies another 22% over six weeks while RSI never drops below 65.
This is not a rare edge case.
It’s the single most common way traders lose money with oscillators.
Overbought does not mean overpriced.
It means the recent rate of gains has been unusually strong relative to recent losses. In a powerful trend, that condition is the norm, not the anomaly.
Trend vs Range: Same Reading, Different Meaning
The identical momentum reading carries opposite implications depending on market regime.
This is the concept most guides skip entirely.
In a trending market, elevated momentum signals continuation. Strong readings confirm that buyers keep stepping in at higher prices. Pullbacks toward the baseline become entry opportunities rather than reversal warnings.
Overbought and oversold conditions in this environment are noise you learn to ignore.
In a range-bound market, the same elevated reading signals exhaustion. Price is pressing the upper boundary of a channel with no fresh supply of buyers behind it.
Here, mean reversion works, and oscillator extremes have genuine predictive value.
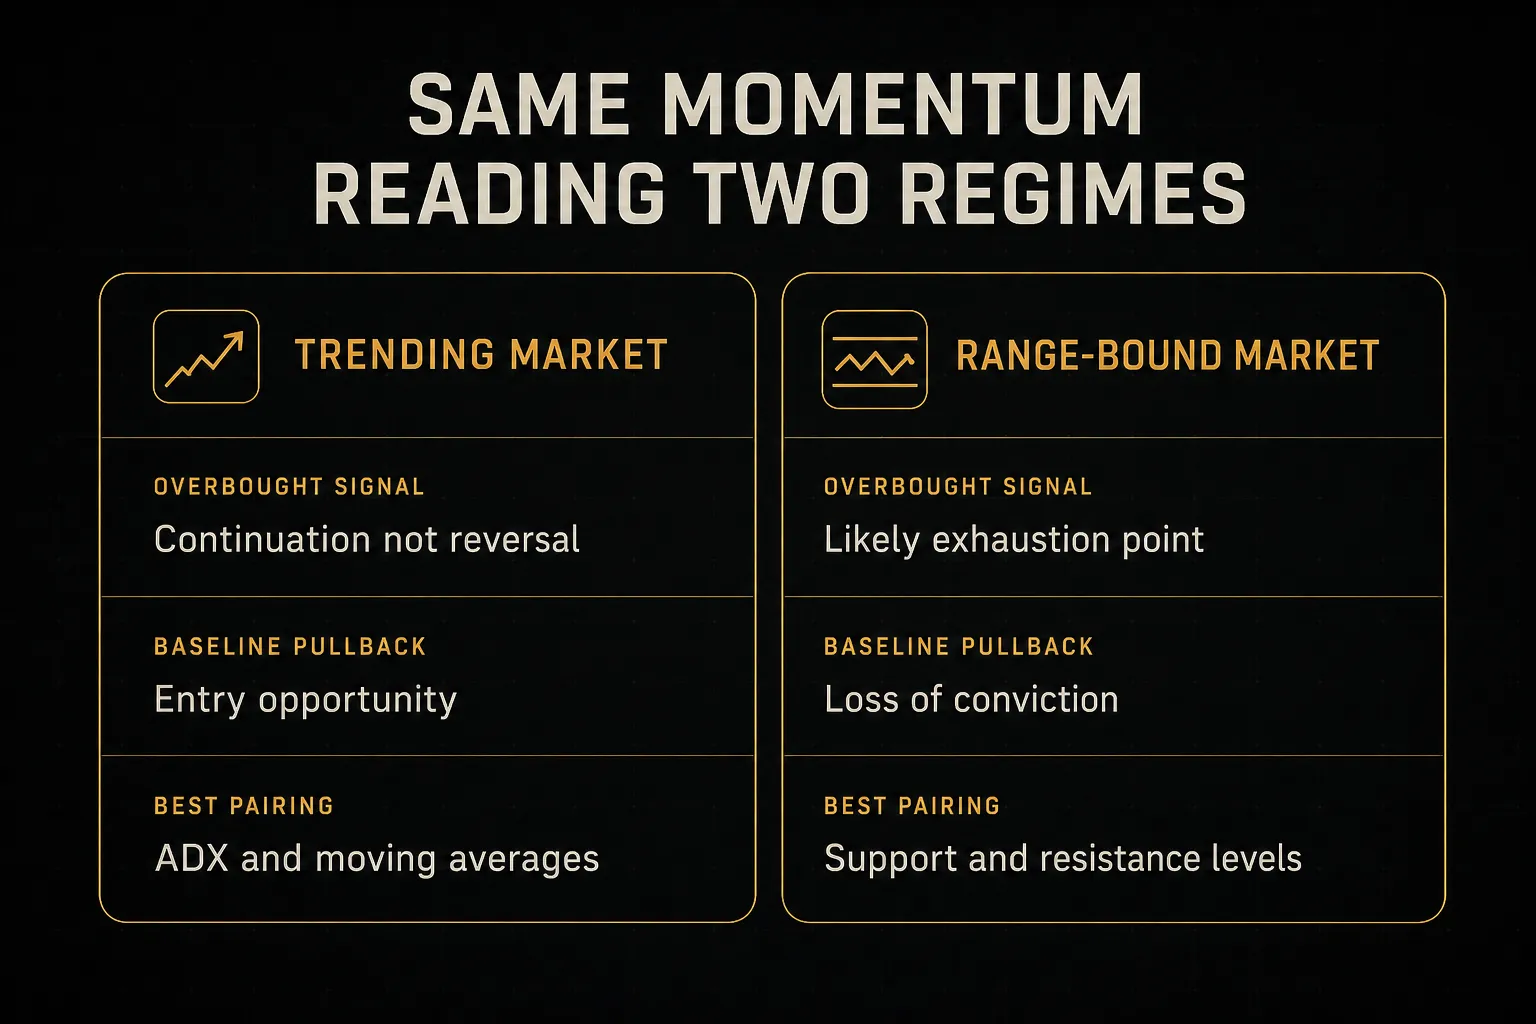
So the first question is never “what does momentum say?” It’s “what regime am I in?” ADX above 25 typically indicates a trend worth respecting. Below 20 suggests range conditions where mean reversion logic applies.
That single filter changes how you read every subsequent signal.
Divergence: Regular vs Hidden
Divergence occurs when price and the momentum oscillator disagree. There are two flavors and they point in opposite directions.
Regular divergence warns of potential reversal.
Regular bearish divergence appears when price prints a higher high but momentum prints a lower high, meaning the new high came with less force behind it. Regular bullish divergence is the mirror: price makes a lower low while momentum makes a higher low, suggesting selling pressure is drying up.
Hidden divergence signals trend continuation.
Hidden bullish divergence shows price making a higher low while momentum makes a lower low, typical of a healthy pullback within an uptrend. Hidden bearish divergence shows price making a lower high while momentum makes a higher high, common in downtrend rallies that fail.
Both patterns share one hard requirement: price structure must confirm before you act.
Divergence alone has no timing value. Momentum can diverge for twenty bars while price grinds higher, and traders who fade every divergence bleed out slowly.
Divergence tells you a move is losing energy. It does not tell you when the move stops.
Wait for the structural break.
A failed higher high, a break of the swing low, a close below a rising trendline.
Divergence is the setup.
Structure is the trigger.
Confirming with Volume and Liquidity
A momentum spike on thin volume is a rumor. A momentum spike on expanding volume is news.
Volume confirmation separates moves backed by real participation from moves that happened because nobody was there to push back. Late-session drifts, holiday sessions, and pre-market gaps routinely produce dramatic momentum readings that evaporate the moment normal liquidity returns.
Check three things when momentum surges:
- Volume relative to its own average. A momentum breakout on 40% of average volume deserves skepticism regardless of how clean the chart looks.
- Spread and depth conditions. Wide spreads during off-hours inflate apparent price moves and make the momentum calculation misleading.
- Whether the move survives the session change. Momentum built during a low-liquidity window often reverses when the primary session opens and real order flow arrives.
In leveraged products, this matters twice over. Slippage on a thin-liquidity false breakout compounds the loss beyond what your stop level suggested.
The chart said one thing.
The fill said another.
Building a Repeatable Confirmation Workflow
Most traders don’t lose because their indicator is wrong. They lose because they apply it differently every time, then evaluate the results from memory.
A workflow fixes both problems.
Matching Settings to Your Trading Style
The lookback period controls sensitivity.
Shorter settings react faster and produce more signals, most of which are noise. Longer settings react slower and produce fewer signals, some of which arrive too late.
- Scalping and intraday: 5 to 9 periods. Fast enough to catch intrasession swings on 1-minute to 15-minute charts, but expect a high false-signal rate that demands tight risk control.
- Swing trading: 14 periods. The default for a reason. On 1-hour to daily charts it balances responsiveness against noise for holds lasting days to weeks.
- Position trading: 20 periods or more. Smooths out weekly volatility so you’re reading the underlying trend rather than every news-driven wobble.
- Adjust for instrument volatility. A high-beta small cap or a crypto pair needs a longer lookback than a large-cap index to produce comparable signal quality. Check ATR relative to price before locking in a setting.
Resist the urge to optimize this to three decimal places. A setting that only works at exactly 13 periods and breaks at 12 or 14 is curve-fitted, not discovered.
Multi-Timeframe Confirmation
The most reliable way to reduce false entries costs nothing: check whether your signal agrees with the timeframe above it.
- Establish trend on the higher timeframe first. If you trade the 15-minute chart, define direction on the 1-hour or 4-hour. A 15-minute bullish momentum cross inside a 4-hour downtrend is usually a countertrend bounce, not a reversal.
- Use the entry timeframe only for timing. Once higher-timeframe direction is set, the lower chart answers “when,” never “which way.”
- Count how many timeframes agree. Multi-timeframe analysis tools like PipTrend’s 12-timeframe confirmation table let you scan alignment across the full range at a glance, which is one practical way to check agreement before committing. Not a requirement, just faster than flipping charts manually.
- Set a minimum alignment threshold. Many traders require agreement across at least three consecutive timeframes before taking a signal, which filters out the majority of noise-driven entries.
- Wait for candle-close confirmation. Mid-candle momentum readings change constantly. A signal that appears at bar 40% completion and vanishes by close was never a signal. Candle-close confirmation eliminates an entire category of self-inflicted losses.
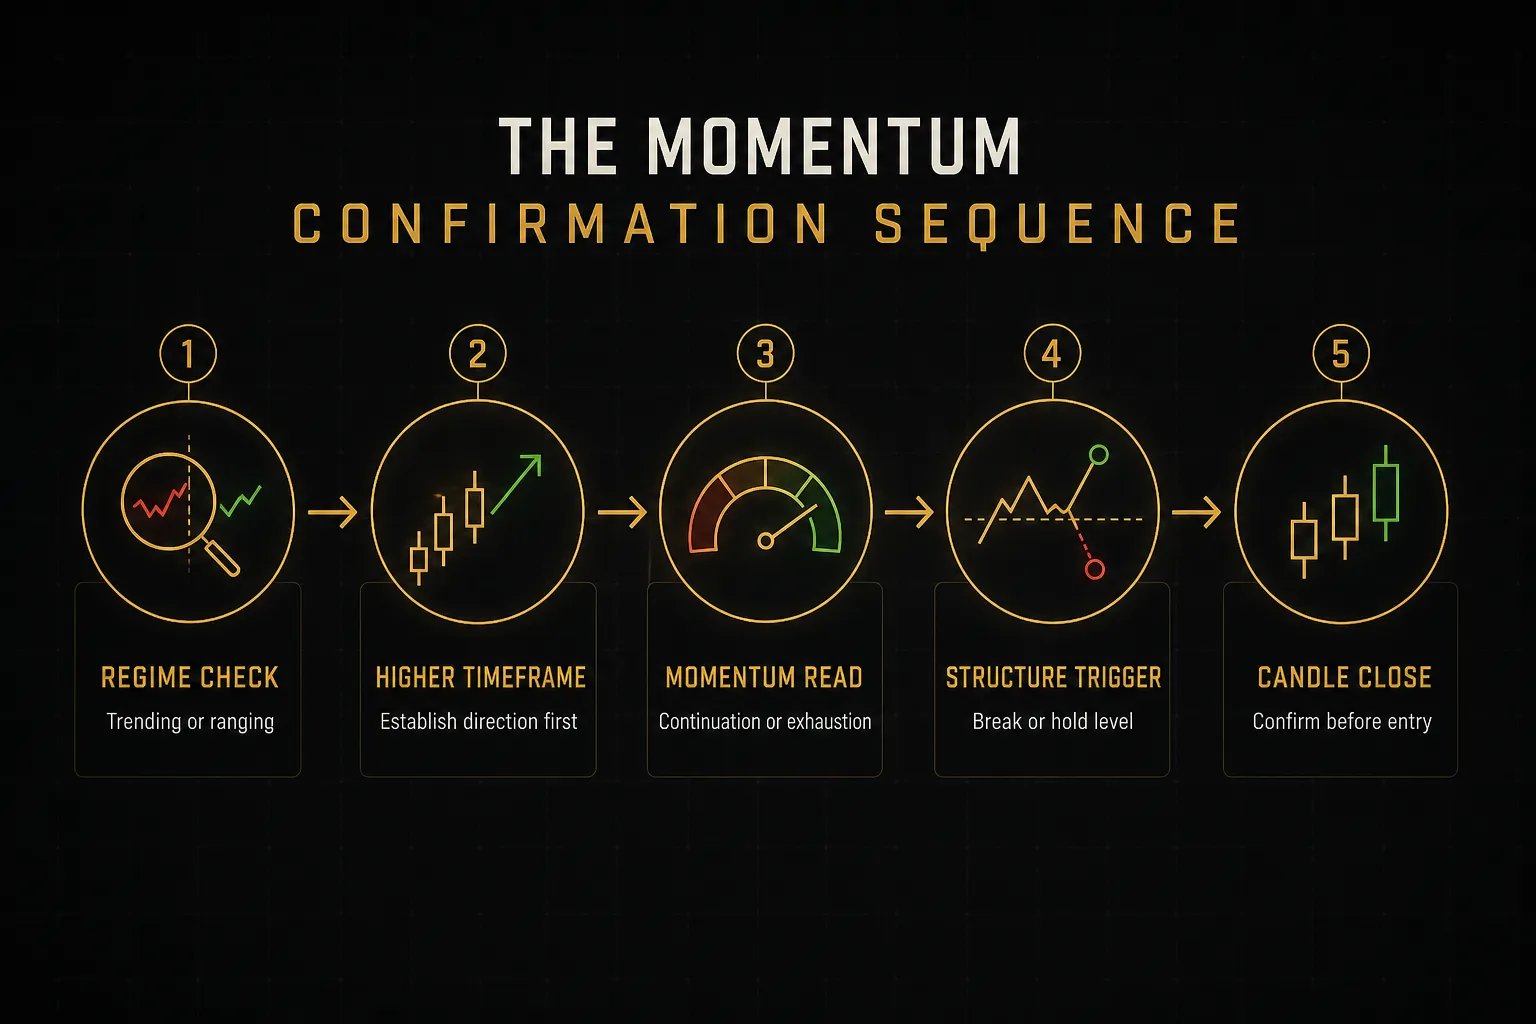
Beyond alignment, know the conditions that manufacture false signals. Scheduled news releases distort momentum within seconds. Session opens produce gaps that register as acceleration when they’re really repricing. Wide spreads on exotic pairs corrupt the calculation.
And repainting indicators, which redraw historical signals after the fact, will show you a flawless backtest that was never tradeable in real time.
Backtesting Before You Trust a Signal
Three winning screenshots prove nothing.
Any strategy produces three winning screenshots. Judging a system that way is how traders end up confident in something that loses money over 200 trades.
- Measure trade expectancy. Multiply win rate by average win, subtract loss rate times average loss. A 35% win rate with a 3:1 risk-to-reward ratio beats a 65% win rate at 0.5:1. Expectancy is the only number that decides whether an edge exists.
- Track maximum drawdown. The deepest peak-to-trough decline tells you whether you could actually hold the strategy through its worst stretch. A system with 40% drawdown is untradeable for most people regardless of final returns.
- Calculate profit factor. Gross profit divided by gross loss. Anything below 1.0 loses money. Between 1.2 and 1.5 is workable; anything claiming above 3.0 in backtest usually means overfitting or a data error.
- Demand sample size. Fewer than 100 trades gives you noise, not evidence. Aim for 200 or more spanning at least one full trending phase and one ranging phase.
- Reserve out-of-sample data. Build on 70% of your data, then test on the untouched 30%. If performance collapses, you optimized to history instead of finding a real edge.
Once the numbers hold up, the live decision compresses into a short checklist. Does the reading suggest continuation (momentum aligned with higher-timeframe trend)? A pullback opportunity (momentum easing toward baseline inside an intact trend)? Exhaustion (regular divergence plus a structural break in a ranging regime)? Or no-trade conditions (conflicting timeframes, thin volume, pending news)?
Four outcomes.
One of them is doing nothing, and on most days that’s the correct answer.
Common Momentum Questions Answered
What is the most accurate momentum indicator?
No momentum indicator is most accurate independent of context. Accuracy depends on market regime, timeframe, instrument volatility, and what you pair the indicator with. RSI performs well for divergence spotting on swing timeframes, MACD suits trend continuation on daily charts, and classic Momentum works cleanly for raw acceleration reads.
The confirmation process around the tool matters more than the tool itself.
How do you read a momentum indicator?
Read momentum relative to its baseline, which is zero for difference-based versions and 100 for ratio-based versions. Readings above the baseline mean price is higher than N periods ago and accelerating upward; readings below mean the opposite. A baseline crossover marks a shift in speed relationship, not a guaranteed change in trend direction.
Always interpret the reading against the prevailing regime before acting on it.
Is RSI a momentum indicator?
Yes, RSI is a momentum oscillator.
It compares the average magnitude of recent gains against recent losses over a lookback period, typically 14, and compresses the output into a bounded 0 to 100 scale. That makes it a momentum measure by definition, even though its calculation differs substantially from the classic Momentum formula.
What is the difference between momentum and RSI?
The main differences are scale and smoothing.
Classic Momentum is an unbounded raw difference between current price and price N periods ago, with no smoothing applied. RSI applies Wilder’s smoothing to average gains and losses, then bounds the result between 0 and 100.
Because RSI is capped, it can sit at extreme readings for weeks during a strong trend, while unbounded momentum keeps expanding to reflect the actual size of the move.
What does it mean when momentum is above 100?
A reading above 100 on ratio-based momentum simply means current price is higher than it was N periods ago. A value of 103 indicates price is 3% above the reference point.
This is not a reversal signal and not an overbought warning.
It confirms upward acceleration, and in a confirmed uptrend, sustained readings above 100 typically support continuation rather than reversal.
What is the best momentum indicator for scalping?
Fast-reacting oscillators with short lookbacks work best for scalping, typically Stochastic at 5-3-3 or Momentum at 5 to 9 periods. The tradeoff is a high false-signal rate, so scalping momentum requires strict candle-close confirmation, awareness of spread conditions, and tight position sizing.
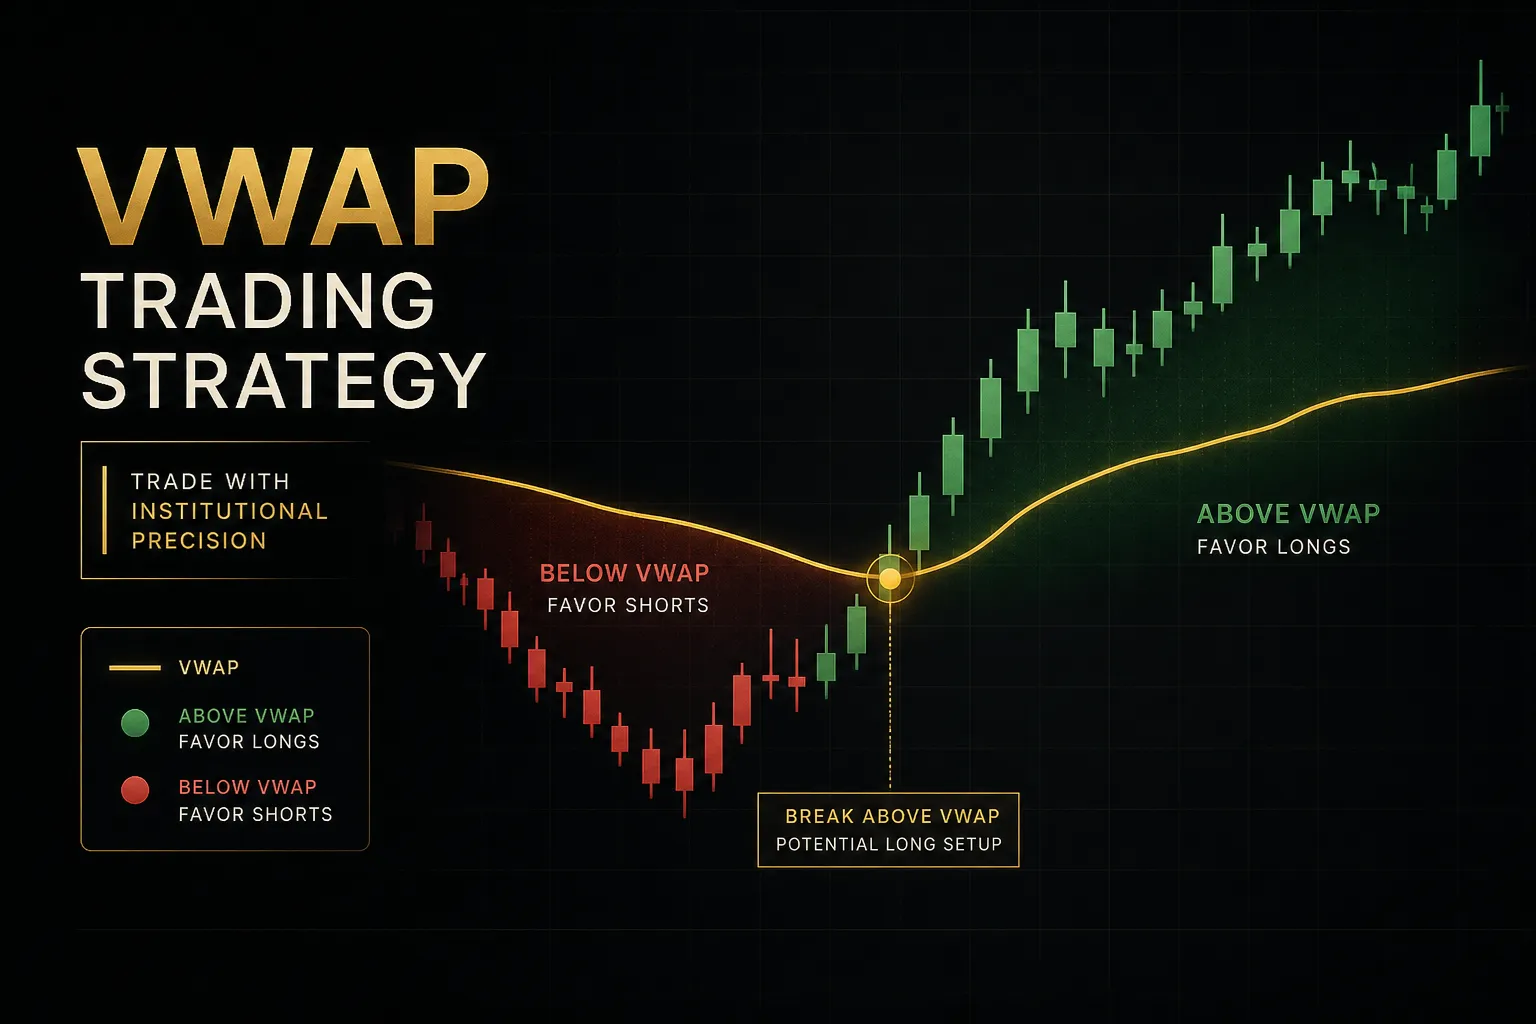
Pairing the oscillator with a short-term moving average or VWAP filters out a meaningful share of the noise.
How do you use momentum indicators in a strong trend?
In a strong trend, use momentum to time entries on pullbacks rather than to call tops or bottoms. Overbought and oversold readings lose reversal value once ADX confirms trend strength above 25.
Watch for momentum easing toward the baseline and then turning back in the trend direction, and look for hidden divergence, which specifically signals continuation rather than reversal.
Can momentum indicators be used for buy and sell signals?
Momentum can generate signals, but it should not generate them alone.
A baseline crossover or divergence works as a setup condition, while the actual trigger should come from price structure such as a break of a swing level or a close beyond resistance. Combined with higher-timeframe alignment and volume confirmation, momentum becomes a reliable component of an entry rule rather than a standalone system.
Momentum Is a Clue, Not a Verdict
Momentum measures acceleration.
That’s the whole job.
It doesn’t know where support sits, whether volume is participating, or what the weekly chart is doing.
Which is why it only works as one input among several.
Trend context tells you whether an extreme reading means continuation or exhaustion. Structure gives the signal a place to trigger.
Volume tells you whether the move has backing. Timeframe alignment filters out the noise that generates most whipsaw losses.
Before your next trade, do one thing: check whether the momentum reading on your entry chart agrees with the trend on the timeframe above it. If it doesn’t, you’re either taking a countertrend trade on purpose or you’re about to take one by accident.
Those are very different situations.
The traders who compound consistently aren’t running a secret setting. They’re running the same five checks in the same order, logging the results, and letting expectancy do the work over hundreds of trades.
Process beats parameters.
Every time.
Sources
Risk Disclaimer: Trading involves risk. Past performance doesn't guarantee future results. Only trade with money you can afford to lose. PipTrend is a tool to assist your trading decisions, not financial advice.