
You opened your EUR/USD chart this morning and three different indicators screamed conflicting signals. The moving average pointed up. The RSI flashed overbought. A third tool showed a sell arrow that appeared after you entered long. You closed the position for a 15-pip loss, only to watch price run 80 pips in your original direction. This scenario repeats because most traders misunderstand what a buy and sell indicator actually tells you and what it doesn't.
What a Buy and Sell Indicator Actually Measures
A buy and sell indicator gives you a signal based on price data, volume, or mathematical formulas applied to historical candles. That signal represents a calculation, not a prediction. When you see a BUY arrow on your chart, you're looking at the output of an algorithm that identified specific conditions based on rules you chose or the developer programmed.
The indicator doesn't know what price will do next. It tells you what price did relative to its own parameters. This distinction separates profitable traders from those who bounce between tools every month.
Oscillators vs Trend-Following Tools
Oscillators measure momentum and identify overbought or oversold conditions. The RSI, Stochastic, and CCI fall into this category. When the RSI drops below 30, it signals oversold conditions that might precede a bounce. When it climbs above 70, it suggests overbought territory.
Trend-following indicators track directional movement. Moving averages, MACD, and directional systems show whether price is trending up, down, or consolidating. A 200-period moving average slopes upward when the trend favors longs over a longer timeframe.
You need both, but they serve different functions. Oscillators help with timing. Trend tools establish direction. Most traders lose because they use oscillators for direction decisions or trend tools for precise entries.
Why Most Buy and Sell Indicators Fail Traders
The problem isn't the indicator. The problem is how you apply it. Here's what goes wrong in order of frequency.
Repainting Signals That Disappear
You enter a trade because a BUY signal appeared on the current candle. You set your stop loss, walk away, then return an hour later to find the signal vanished. The indicator repainted. It changed its historical output after new price data arrived.
Repainting indicators show you what looks perfect in hindsight but unreliable in real-time. The signal appeared at 1.0850, but after the candle closed at 1.0840, the indicator decided the signal should have triggered at 1.0835. Your actual entry at 1.0850 never had an edge because the signal itself wasn't confirmed.
Non-repainting indicators only show signals after the candle closes. The signal locks in place. You can backtest accurately because what you see is what you would have gotten trading live. This requirement isn't optional if you want consistent results.
Confusing Direction with Entry Timing
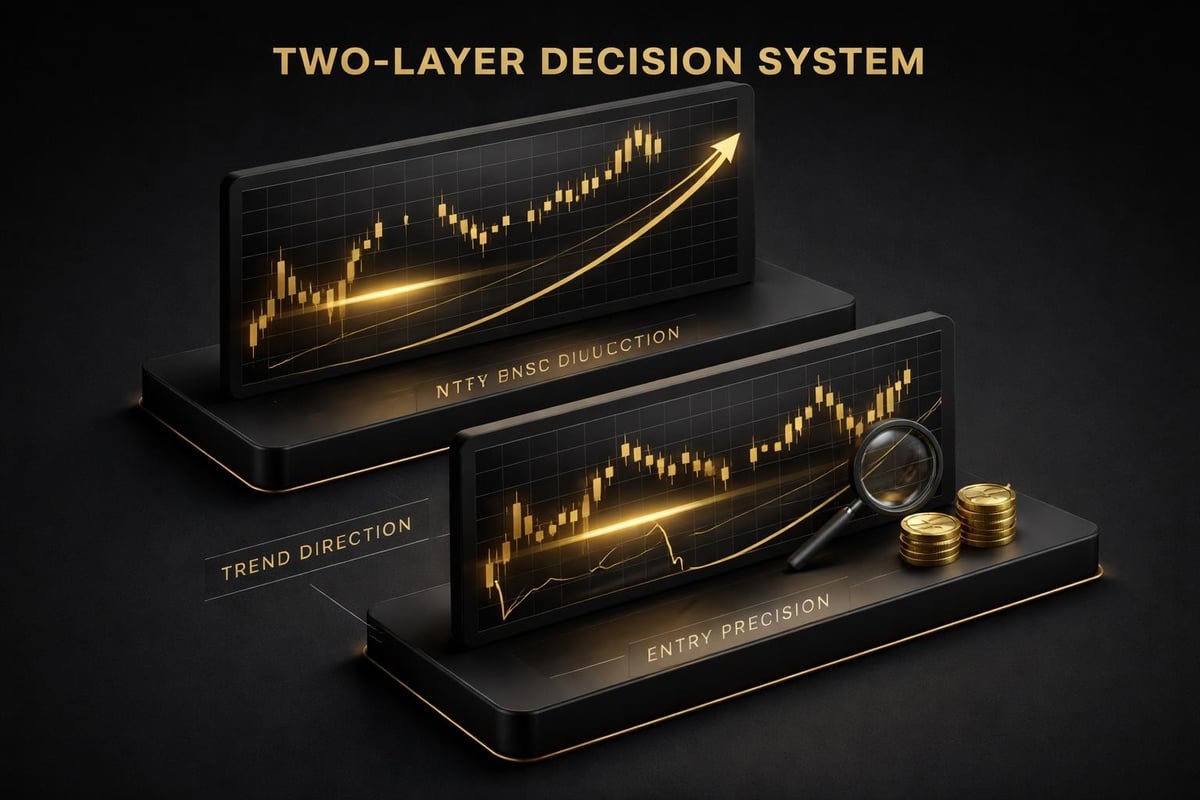
Most free indicators show direction. They tell you the trend is up on the Daily chart or down on the H4. That information matters, but it doesn't tell you where to enter or when.
You know EUR/USD is bullish on the H4 timeframe. Perfect. Do you enter now at 1.0920? Wait for a pullback to 1.0880? Enter at the Asian session low or wait for London? Direction alone leaves you guessing at entries, and guessing creates inconsistent results.
Entry timing requires a second decision layer. You need price levels, session data, or liquidity zones that tell you where institutional orders sit. The best directional signal in the world still loses money if you enter at random prices.
The Three-Part Framework for Using Buy and Sell Indicators
You need three separate decisions working together. Direction, entry, and management. Each decision uses different data and different timeframes.
Step One: Establish Direction Across Timeframes
Start on the Daily chart. Identify whether price is trending up, trending down, or consolidating. Use a consistent method. A simple moving average slope, a directional system, or confirmed price structure.
Then drop to H4 and repeat. If Daily shows uptrend and H4 shows uptrend, you have alignment. You only take long setups. If Daily is up but H4 is down, you wait or skip the pair entirely.
Check the H1 timeframe for additional confirmation. When Daily, H4, and H1 all align, your directional bias is clear. This process takes 30 seconds once you systematize it. Write down your directional bias before you look at entries.
Never enter a trade without knowing your directional bias on at least two timeframes. This rule alone eliminates half your losing trades.
Step Two: Time Your Entry with Price Levels
Now you know direction. You're looking for longs on EUR/USD. Don't enter at market. Wait for price to reach a specific level where probability tilts in your favor.
Institutional traders leave liquidity at predictable zones. VWAP shows the average price institutions paid during a session. High of day and low of day (HOD/LOD) act as magnets and reversal points. Supply and demand zones mark where large orders entered previously.
When price pulls back to VWAP during an uptrend, you get a high-probability long entry. When price reaches the Asian session low during London open, you're entering where stop hunts complete and reversals begin.
Your buy and sell indicator should trigger at these levels, not random prices. If your tool fires signals in the middle of ranges with no support or resistance nearby, you're trading noise.
Step Three: Manage with Multi-Timeframe Confirmation
You entered long at 1.0880 when price bounced off VWAP on the H1 chart. Your stop sits at 1.0860, giving you 20 pips of risk. You're targeting 1.0940 for a 60-pip reward, creating a 3:1 risk-to-reward ratio.
But when do you exit? Price hits 1.0920, up 40 pips. Do you take profit early or hold for the full target?
Check higher timeframes. If the H4 still shows bullish structure and no resistance until 1.0950, you hold. If the Daily timeframe is approaching a major supply zone at 1.0930, you tighten your stop and prepare to exit.
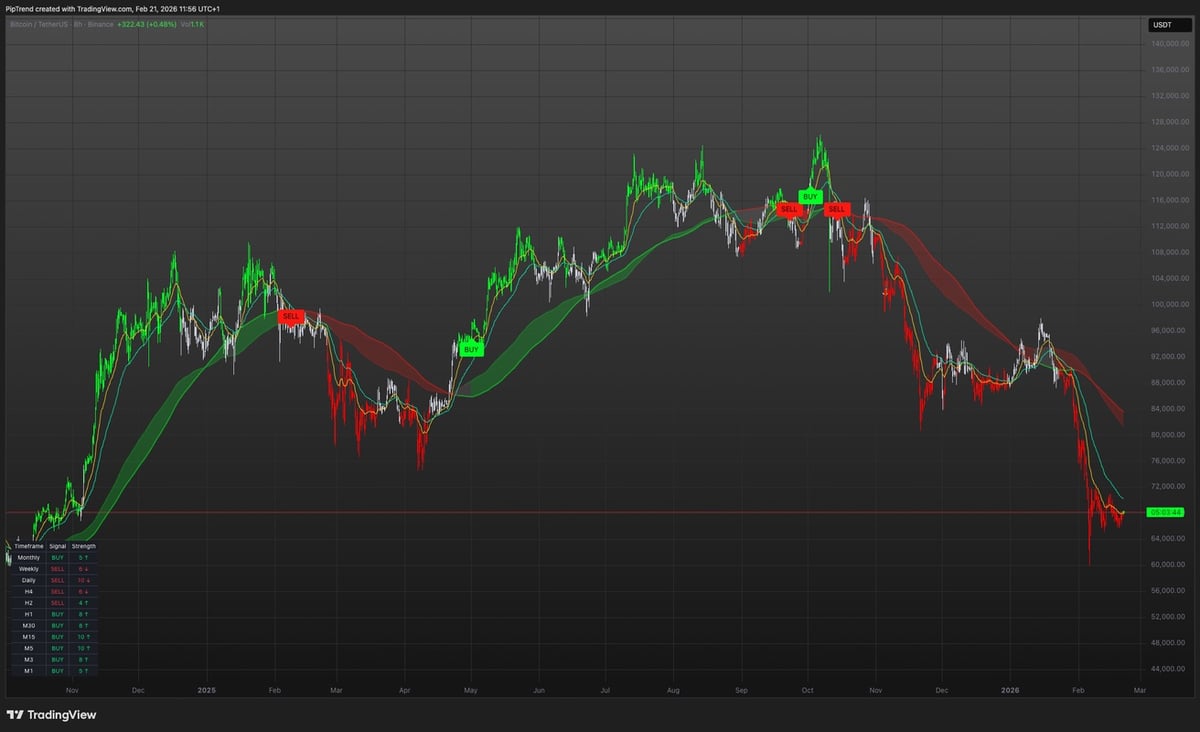
Multi-timeframe confirmation tells you when to hold and when to exit. Watching 1-minute candles creates emotional decisions. Watching the H4, Daily, and Weekly gives you perspective. Many systematic traders use a table showing signals across 12 timeframes simultaneously, from 1-minute to Monthly, updating after every candle close.
How to Test a Buy and Sell Indicator Before Risking Capital
You found a new indicator. It shows BUY and SELL arrows. The marketing screenshots look clean. Now what?
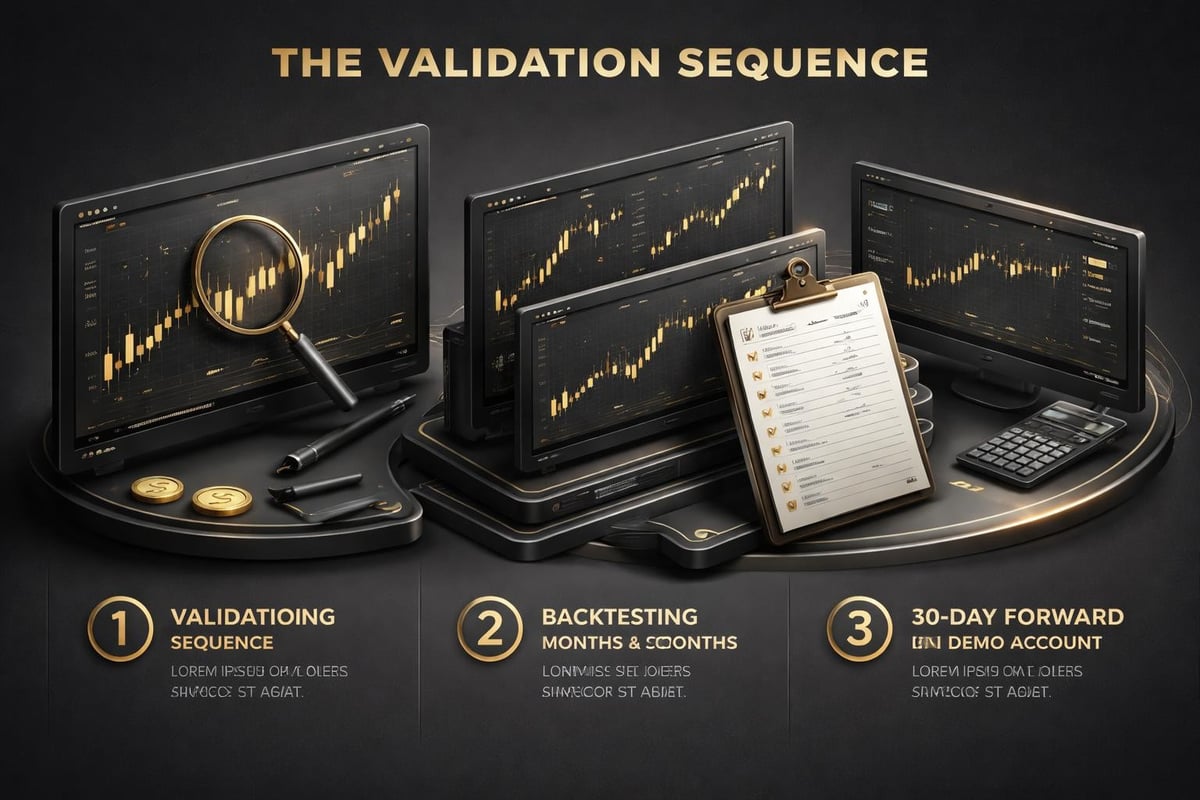
Step One: Check for Repainting
Load the indicator on a chart. Note where the most recent signal appeared. Write down the exact price and time. Wait for the next candle to close. Refresh your chart or switch timeframes and return.
Did the signal stay in the same place? If it moved, disappeared, or changed color, the indicator repaints. Delete it. You can't trade something that changes its mind after the fact.
Step Two: Backtest Manually on Multiple Pairs
Scroll back 6 months on EUR/USD. Mark every BUY signal. Note the entry price, where you'd place a stop based on recent structure, and where price went in the following 20-50 candles.
Calculate win rate and average risk-to-reward. If the indicator wins 40% of the time but the average winner is 2x the average loser, that's tradeable. If it wins 60% but winners equal losers after spread and commissions, it's breakeven at best.
Repeat this process on GBP/USD, USD/JPY, and one crypto pair like BTC/USD. The Commodity Channel Index and similar oscillators behave differently across asset classes. A tool that works on Forex might fail on indices. You need proof across multiple markets.
Step Three: Forward Test on a Demo Account
Backtest results don't guarantee live performance. Spread, slippage, and execution speed change everything. Run the indicator on a demo account for 30 days minimum.
Take every signal that aligns with your rules. Track each trade in a journal. Note entry price, exit price, timeframe, pair, and whether higher timeframes confirmed direction.
After 30 days, calculate your metrics. What's your win rate? Average RR? Maximum drawdown? If you're down 8% after 30 days, the indicator isn't ready. If you're up 4% with a 2% max drawdown, you have something worth testing with small live capital.
Practical Settings and Timeframe Combinations
Your buy and sell indicator has settings. Period length, sensitivity, smoothing factors. Most traders never adjust defaults. That's a mistake.
Scalping on 1-Minute and 5-Minute Charts
Scalpers need fast signals with tight stops. On the 1-minute chart, set your directional indicator to a shorter period. A 20-period moving average reacts faster than a 200-period.
Your entry signals should trigger at clear S/R levels even on fast timeframes. The 5-minute chart offers cleaner price action than the 1-minute. If you're scalping, use the 5-minute for entries and the 15-minute for directional bias.
Expect a 45% to 55% win rate with RR ratios between 1.5:1 and 2:1. Scalping wins through volume and consistency, not home runs. Your maximum stop loss should stay under 10 pips on major Forex pairs to keep drawdowns tight.
Day Trading on H1 and H4 Charts
Day traders hold positions from 2 hours to 24 hours. The H1 chart provides enough candles to see intraday structure without noise. Use the H4 for directional bias and the H1 for entries.
When the H4 shows a BUY signal and price pulls back to a key level on the H1, you enter long. Your stop sits below the H1 swing low. Your target is the next H4 resistance or a 2:1 RR minimum.
Day trading works well for prop firm challenges. You can hit profit targets quickly while keeping drawdown under 4% if you respect your stop losses. Many prop firms require 10% profit with max 5% daily drawdown. Tight execution on the H1 with H4 confirmation keeps you inside those boundaries.
Swing Trading on Daily and Weekly Charts
Swing traders hold positions for days or weeks. The Daily chart is your primary timeframe. The Weekly chart provides the bigger picture.
When the Weekly chart shows an uptrend and the Daily chart pulls back to a support zone, you wait for a BUY signal on the Daily close. Your stop sits below the Daily swing low, often 50 to 100 pips depending on the pair.
Your target is the next Weekly resistance or a measured move based on the previous impulse. Swing trading offers 3:1 to 5:1 RR ratios regularly. Win rates around 40% still produce consistent profits when you let winners run.
Combining Multiple Indicators Without Creating Confusion
You've heard the advice: keep your charts clean. But does that mean one indicator only?
No. It means one decision per indicator. Your directional tool shows trend. Your entry tool shows precise levels. Your management tool shows timeframe alignment. Each serves a separate function.
The Problem with Indicator Stacking
Traders add RSI, MACD, Stochastic, and Bollinger Bands to the same chart. Then they wait for all four to agree before entering. This approach sounds disciplined but creates two problems.
First, you miss most opportunities. Waiting for four indicators to align perfectly means sitting out 80% of valid setups. Second, when all four agree, you're often late. The move already happened.
Choose one tool per decision type. One for direction, one for entry timing, one for management. When those three align, you trade. When they don't, you wait.
How Unified Systems Solve the Clutter Problem
A unified system uses three indicator categories working as one framework. You get directional signals from a non-repainting core system. You get entry precision from session liquidity and institutional levels. You get management confirmation from a multi-timeframe table showing all relevant periods at once.
This setup replaces six separate tools with one systematic approach. You follow the same rules on every trade. Direction check, entry confirmation, timeframe alignment. Same process on 1-minute, same process on Daily.
When you trade EUR/USD, GBP/JPY, or BTC/USD, the rules don't change. When you switch from day trading to swing trading, the process stays identical. You're just looking at different timeframes.
For traders who struggle with consistency, conflicting signals, or emotional decisions, a unified approach eliminates the guesswork. You're not interpreting multiple tools. You're following a clear sequence backed by real results, not backtests. PipTrend AI Trading Indicator offers this exact structure with non-repainting signals, session liquidity entries, and a 12-timeframe confirmation table, designed specifically for intermediate traders and prop firm participants who need repeatable precision across any pair or asset class.
Common Mistakes When Using Buy and Sell Indicators
Even experienced traders make these errors. Catch them early and your results improve immediately.
Ignoring Timeframe Conflicts
Your H1 chart shows a BUY signal. You enter long. But the H4 chart shows a clear downtrend with price rejecting resistance. You just traded against the larger trend.
Always check at least two timeframes above your entry chart. If you enter on H1, check H4 and Daily. If you enter on 5-minute, check 15-minute and H1. Timeframe alignment isn't optional.
Taking Every Signal
A good buy and sell indicator might generate 15 signals per day on a single pair. That doesn't mean you take all 15. Your job is filtering.
Only trade signals that align with higher timeframe direction. Only enter at key price levels. Only take setups that offer at least 2:1 RR. These filters cut your trade count by 70% but double your win rate.
Moving Stops to Avoid Losses
Price moves against you. Your stop is 20 pips away. Instead of taking the loss, you move your stop to 40 pips. Then 60 pips. Eventually, you take a 100-pip loss instead of the planned 20-pip loss.
This behavior destroys accounts. Your stop loss placement is part of your system. If the system says stop at 20 pips, you stop at 20 pips. No exceptions. The indicator gave you a signal based on probabilities. Some trades lose. That's math, not failure.
Overtrading During Low-Probability Hours
Not all trading hours offer the same quality. The Asian session on Forex pairs often consolidates. Crypto can go dead during US afternoons. Indices barely move outside regular market hours.
Your buy and sell indicator doesn't know when liquidity is low. It fires signals based on price calculations. You need to filter by session. Trade EUR/USD during London and New York overlap. Trade BTC/USD when US markets are active. Trade indices during the first two hours after open and the last hour before close.

Real Numbers: What to Expect from Buy and Sell Indicators
Let's talk realistic performance. No hype. Just numbers based on transparent testing.
Win Rate Expectations
A trend-following buy and sell indicator typically wins 35% to 45% of trades. That sounds low until you factor in RR ratios. When your average winner is 3x your average loser, a 40% win rate produces steady growth.
Mean-reversion indicators that trade bounces from oversold/overbought levels win 55% to 65% of trades but offer smaller RR ratios, usually 1:1 to 1.5:1. The Ultimate Oscillator combines multiple timeframes to improve accuracy, but even advanced oscillators rarely exceed 65% win rates across diverse market conditions.
If someone shows you a 90% win rate, ask about average losers. Chances are they're letting losers run and cutting winners early, creating terrible RR ratios that guarantee eventual blowup.
Risk-Reward Ratios by Trading Style
Scalpers target 1.5:1 to 2:1 RR. You're taking 8 to 15 pips with a 5 to 7 pip stop. High frequency, small gains.
Day traders target 2:1 to 3:1 RR. You're risking 20 pips for 40 to 60 pips. Moderate frequency, moderate gains.
Swing traders target 3:1 to 5:1 RR. You're risking 50 pips for 150 to 250 pips. Low frequency, large gains.
Your indicator should support the RR ratios your style requires. If you're swing trading but your signals only offer 1:1 RR setups, you're using the wrong tool for your timeframe.
Drawdown Tolerances
Expect maximum drawdowns between 10% and 20% annually if you're managing risk correctly. A 2% risk per trade with proper position sizing should keep monthly drawdowns under 8%.
Prop firms often require staying within 5% daily drawdown and 10% total drawdown. This constraint demands tight execution. You can't risk 5% per trade and stay within those limits. You risk 0.5% to 1% per trade, take high-probability setups only, and cut losers immediately.
If your indicator creates 25% drawdowns regularly, either your risk management is broken or the indicator itself doesn't have an edge.
How to Interpret Signals Across Different Asset Classes
Your buy and sell indicator works on Forex. Does it work on crypto? Stocks? Indices?
Forex Pairs: Trending and Range-Bound Behavior
Major Forex pairs like EUR/USD and GBP/USD trend cleanly during high-impact news and major sessions. They range during low liquidity hours. Your indicator needs to identify both environments.
Trend-following signals work during London/New York sessions. Mean-reversion signals work during Asian consolidation. If your tool fires the same signal type regardless of market structure, you'll win during trends and lose during ranges.
Exotic pairs like USD/TRY or USD/ZAR show wider spreads and more erratic movement. Your stop losses need adjustment. A 20-pip stop on EUR/USD might need to become 40 pips on USD/ZAR to account for volatility.
Crypto: High Volatility and 24/7 Markets
Bitcoin, Ethereum, and altcoins move 5% to 10% daily. That volatility creates opportunity but demands wider stops and smaller position sizes.
Your buy and sell indicator will generate more signals on crypto than Forex because price moves faster. Don't overtrade. Filter signals the same way. Direction, entry level, timeframe confirmation.
Crypto doesn't sleep. Signals can trigger at 3 AM. Set alerts. Don't sit in front of charts 24/7. Let your system notify you when all three conditions align, then execute.
Indices and Stocks: Session-Dependent Movement
Indices like SPX, NAS100, and US30 move primarily during US market hours. Pre-market and after-hours offer lower volume and wider spreads.
Your indicator should focus on regular trading hours, 9:30 AM to 4:00 PM EST. Signals outside these windows carry higher risk.
Individual stocks require additional filters. Check earnings calendars. Avoid trading setups the day before earnings releases. Price can gap 10% to 20% overnight, blowing past your stop loss before you can react.
Advanced Techniques for Signal Confirmation
You're beyond beginner level. You understand direction, entries, and management. Now you want refinement.
Volume Analysis with Price Signals
When your buy and sell indicator triggers, check volume. A BUY signal on heavy volume carries more weight than one on declining volume.
Volume confirms conviction. Institutions move size. Retail traders move small lots. When volume spikes during a signal, larger players are participating. When volume is flat, the move might fail quickly.
Identifying reliable buy and sell trading signals often requires combining price-based indicators with volume analysis, giving you a clearer picture of institutional participation and market pressure.
Divergence Between Price and Indicator
Price makes a new high but your oscillator makes a lower high. That's bearish divergence. It warns that momentum is weakening even as price climbs.
When you see divergence, don't take new signals in the diverging direction. If price is making new highs but your indicator shows weakness, skip the BUY signals. Wait for price to confirm the reversal or for divergence to resolve.
Divergence doesn't predict exact turning points. It tells you to tighten stops on existing positions and avoid new entries until clarity returns.
Correlation Checks Across Related Pairs
EUR/USD and GBP/USD often move together. If your indicator shows a BUY on EUR/USD but a SELL on GBP/USD, something's off. Either the signals are false, or one pair is lagging.
Check DXY (US Dollar Index). If DXY is falling, both EUR/USD and GBP/USD should rise. If only one pair shows a BUY signal, the other might follow soon, or the first signal is weak.
Correlation analysis prevents you from taking conflicting trades. You don't want to be long EUR/USD and short GBP/USD simultaneously unless you're hedging intentionally.
Why Discipline Matters More Than the Indicator Itself
The best buy and sell indicator in the world fails if you don't follow it consistently. You need rules, and you need to execute those rules without exception.
Creating a Trade Checklist
Write down your entry criteria. Direction confirmed on H4 and Daily? Check. Entry at key liquidity level? Check. Multi-timeframe table shows alignment? Check.
If all boxes are checked, you trade. If one box is unchecked, you wait. This removes emotion. You're not deciding if the trade feels good. You're verifying that all system requirements are met.
Many prop firm traders print their checklist and mark it physically before entering. That extra step creates discipline. You can't skip a requirement if you have to physically mark a box.
Tracking Every Trade
Keep a journal. Not just entry and exit prices. Track timeframe, pair, direction bias, entry reason, RR ratio, and how you felt emotionally.
After 50 trades, patterns emerge. You'll notice you win more on EUR/USD than GBP/JPY. You'll see that trades taken during London session outperform Asian session trades. You'll spot emotional trades where you skipped your checklist and paid the price.
Interpretation of signals requires understanding both the visual output and the market context behind each signal, which your journal helps you refine over time.
Building Confidence Through Repetition
Your buy and sell indicator is just a tool. You build confidence by using it the same way, every single trade, until the process becomes automatic.
Start with one pair. EUR/USD or your preferred major. Trade only that pair for 90 days. Learn how it moves during different sessions. Notice how it respects VWAP during London open. See how it reacts to US news releases at 8:30 AM EST.
After 90 days on one pair, add a second. Apply the exact same rules. Same timeframes, same entry logic, same risk management. You'll notice similarities and differences. Both pairs respect key levels, but GBP/USD moves faster and requires wider stops.
Expand slowly. Three months per pair. This approach builds deep pattern recognition. You're not chasing signals across 20 pairs. You're mastering the behavior of a few instruments, making your decisions faster and more accurate.
When you can look at a chart and know within 10 seconds whether a valid setup exists, you've built real skill. The indicator confirms what you already see. It's not telling you what to think. It's validating your analysis with objective data.
A buy and sell indicator is only as good as the system you build around it. Direction, entry precision, and multi-timeframe management work together to create repeatable results. PipTrend gives you all three in one unified system: non-repainting directional signals, institutional-level entries at VWAP and session liquidity zones, and a 12-timeframe confirmation table that removes guesswork from every trade. Start your 3-day free trial and see how a systematic approach changes your consistency across Forex, crypto, indices, and stocks.