
You load up TradingView and add RSI. Then Bollinger Bands. Then MACD. Stochastic. Volume Profile. Within minutes your chart looks like a Christmas tree and you still can't tell if you should take the trade. The problem isn't that you lack indicators. The problem is you're asking one indicator to do three separate jobs it was never designed to handle. Direction is not the same thing as entry. Entry is not the same thing as exit. Until you separate these decisions, you'll keep second-guessing every setup.
Understanding What Indicators Actually Tell You
Most traders treat indicators like fortune-telling devices. You want one tool that screams BUY or SELL and handles everything. That tool doesn't exist. Every indicator was built to measure something specific: momentum, trend strength, volume, price deviation, support and resistance. When you understand what each indicator measures, you stop asking it questions it can't answer.
RSI measures momentum. It tells you when price has moved too far too fast. That's useful for exits or filtering bad entries, but RSI won't tell you the trend direction on the Daily chart when you're trading the 5-minute. Moving averages smooth price action and show trend over your chosen period. They lag because they're backward-looking. MACD combines multiple moving averages to spot momentum shifts. Bollinger Bands show volatility and price deviation from the mean.
None of these tools were designed to work alone. When traders ask "what are the best TradingView indicators," they're really asking "which indicators solve my specific trading problem right now?" You need to know what problem you're solving before you add anything to your chart.
Indicators for Trend Direction
Your first job as a trader is knowing which direction the market wants to move. Not where it is right now, but where momentum is building. This is where you determine whether you're looking for longs or shorts. Get this wrong and nothing else matters. Your 3:1 risk-reward setup means nothing if you're buying into a downtrend on the higher timeframe.
Moving averages are still the cleanest directional tool most traders use. A 20-period EMA on the H1 chart tells you short-term bias. A 50-period EMA on the H4 or Daily tells you intermediate trend. When price sits above both and both are sloping upward, you have directional clarity. You only look for long entries. When price is below and both slope down, you only short. This simple filter eliminates half your losing trades.
MACD adds momentum confirmation to moving average crossovers. When the MACD line crosses above the signal line while both are below zero, you're seeing early bullish momentum in a downtrend. That's your heads-up that direction might shift. When MACD crosses above zero entirely, the trend shift is confirmed. Use the Daily or H4 timeframe for this. Lower timeframes give too many false signals.
The Supertrend indicator draws a line above or below price based on ATR (Average True Range). When the line flips from red to green and moves below price, trend is up. When it flips to red above price, trend is down. It's visual and clean. Set it to 10-period ATR with a multiplier of 3.0 on the H1 or H4 chart. This gives you fewer flips and better trend persistence.
But here's what none of these tools tell you: where to enter. They show direction. They don't show you the institutional liquidity level where smart money is likely to provide support or resistance. They don't show you VWAP or session highs and lows. Direction and entry are separate decisions.
Indicators for Entry Timing
You know the trend is up. Now you need to know where to enter without giving up 50 pips of drawdown before the trade moves in your favor. This is where most traders fail. They see a bullish trend and buy at random price levels, then watch price drop 30 pips into their stop before reversing. You need entry precision, not just directional bias.
Volume Profile shows where the most volume traded at specific price levels. High volume nodes act as support in uptrends and resistance in downtrends. When price pulls back to a high volume node in an uptrend, that's your entry zone. Set Volume Profile to "Visible Range" and look for the point of control (POC) line. That's the price level with the most volume. Price tends to return to it.
VWAP (Volume Weighted Average Price) is the average price weighted by volume. Institutions use it to gauge whether they're getting good fills. When price is above VWAP and pulls back to touch it, that's often a high-probability long entry in an uptrend. When price is below VWAP and rallies to touch it, that's a short entry in a downtrend. VWAP resets daily, so it works best on intraday timeframes like 5-minute, 15-minute, and H1 charts.
Support and resistance zones marked manually or with tools like pivot points and institutional levels give you structure. You're not entering randomly. You're entering where price historically respected a level. Combine this with your directional bias from higher timeframes and you have a systematic entry model.
Fibonacci retracement levels (38.2%, 50%, 61.8%) help you find pullback entries in trending markets. Draw from swing low to swing high in an uptrend. When price pulls back to the 50% or 61.8% level and starts forming bullish candles, that's your entry signal. The key is waiting for price action confirmation at the level, not just buying because price touched a Fib line.
The problem is coordinating all of this in real time. You're flipping between the Daily chart for direction, the H4 for momentum confirmation, the H1 for VWAP, and the 5-minute for entry. You're managing three to five separate indicators and trying to make a decision in seconds. This is where traders get paralyzed or take bad trades because they miss a signal on one timeframe.
Indicators for Trade Management and Exits
You're in the trade. Now you need to know when to take profit, when to move your stop, and when to cut it loose. Most traders spend 90% of their energy on entries and 10% on exits. That ratio should be reversed. Your exit determines whether you make 1R, 3R, or get stopped out for a loss.
ATR (Average True Range) tells you how much the pair typically moves in a given period. If EUR/USD has a 70-pip Daily ATR, your profit target should account for that. Setting a 100-pip target on a pair that moves 50 pips per day is unrealistic. Set ATR to 14 periods on your chart and use it to calibrate targets. A conservative profit target is 1x ATR. An aggressive target is 2x ATR.
Trailing stops based on moving averages or the Parabolic SAR keep you in winning trades longer. When you're long and price is running, move your stop to just below the 20-period EMA on the timeframe you entered. As the EMA rises, your stop rises with it. You lock in profit without capping your upside. Parabolic SAR dots appear below price in uptrends and above price in downtrends. When the dots flip, your trend is likely over.
Bollinger Bands help you spot exhaustion. When price reaches the upper band in an uptrend, momentum is stretched. That's often a place to take partial profit or tighten your stop. When price reaches the lower band in a downtrend, same logic applies. Use 20-period Bollinger Bands with 2 standard deviations on the H1 or H4 chart.
RSI divergence is your early warning system for reversals. If price makes a higher high but RSI makes a lower high, momentum is fading. That's bearish divergence and a signal to exit longs or prepare for a reversal. If price makes a lower low but RSI makes a higher low, that's bullish divergence. You're seeing hidden strength. Use 14-period RSI on the same timeframe as your entry.
Here's the reality: you're now managing four to six indicators across three to five timeframes just to execute one trade with proper direction, entry, and exit rules. The cognitive load is massive. Prop firm traders especially can't afford mistakes. A 5% drawdown can fail a challenge. You need repeatable, systematic clarity, not more indicators.
Combining Indicators into a Unified System
The best TradingView indicators aren't the ones with the fanciest algorithms. They're the ones that answer a specific question without overlap or conflict. You don't need twelve momentum indicators. You need one for direction, one for entry, and one for management. The system works when the indicators complement each other, not compete.
Start with a top-down approach. Check your Daily chart for trend direction using a 50-period EMA or Supertrend. If the Daily is bullish, drop to the H4 and confirm with MACD or moving average alignment. If both agree, drop to the H1 or 5-minute and wait for price to pull back to a key level: VWAP, a high volume node, or a Fibonacci retracement.
Enter only when price action confirms the level is holding. That means a bullish engulfing candle, a pinbar, or a break-and-retest of structure. Your entry is on the lower timeframe, but your directional bias comes from higher timeframes. This separation prevents you from buying tops or selling bottoms.
Once you're in, manage the trade using ATR-based targets and a trailing stop tied to the 20-period EMA on your entry timeframe. Check RSI for divergence as you approach profit targets. If divergence appears, take profit early. If momentum is still strong, let it run to your full target.
This process works on Forex, Crypto, Indices, and Stocks. It works on 1-minute scalps and Daily swing trades. The principles don't change. What changes is the timeframe and the ATR-based target size. A 1-minute EUR/USD scalp might target 5 pips. A Daily GBP/USD swing might target 150 pips. Both use the same decision framework.
The challenge is execution. Switching between charts, setting alerts, confirming signals on multiple timeframes, and avoiding repainting indicators that show one thing live and another thing after the candle closes. Many free and popular TradingView indicators repaint or lack multi-timeframe confirmation. You think you have a signal, but it disappears after the candle closes. That's not systematic. That's gambling with extra steps.
Avoiding Common Indicator Mistakes
Adding more indicators doesn't increase edge. It increases noise. Traders pile on tools hoping for certainty, but end up with conflicting signals. RSI says oversold. MACD says bearish. Stochastic says neutral. Bollinger Bands say buy. You freeze. The trade moves without you, or worse, you enter and it immediately reverses.
The second mistake is using indicators on the wrong timeframe. RSI on the 1-minute chart is worthless for a Daily swing trade. VWAP on the Weekly chart doesn't exist because it resets daily. Moving averages on the 5-minute chart in a choppy session will whipsaw you to death. Match your indicator to your trading timeframe and style.
Repainting indicators are a trap. Some tools look brilliant in hindsight because they redraw their signals after the candle closes. You think you had a perfect entry at the low, but the signal didn't exist in real time. Always verify that your signals are confirmed after candle close, not during the candle. If an indicator doesn't explicitly state it's non-repainting, assume it repaints.
Ignoring higher timeframes is the fastest way to lose consistency. You take a beautiful 5-minute long setup, but the H4 and Daily are both in strong downtrends. Your trade has no chance. Always confirm direction on at least two higher timeframes before entering on your execution timeframe.
Finally, using indicators as entry triggers without price action confirmation. A Bollinger Band touch or an RSI level of 30 doesn't mean buy. It means the condition exists. You still need a bullish candle close, a break of structure, or a volume spike to confirm the setup. Indicators set the stage. Price action pulls the trigger.
Why Unified Systems Outperform Indicator Collections
You don't need the best TradingView indicators. You need the best system built from the right indicators. A system means every component has a role and the roles don't overlap. One tool shows direction. Another shows entry. A third shows trade management across timeframes. They confirm each other, not contradict.
Most traders treat TradingView like a buffet. They load up on everything and hope something works. What you need is a fixed menu: starter, main course, dessert. No substitutions. No second-guessing. The same process every single trade, regardless of asset or timeframe.
When you trade prop firm challenges, consistency matters more than win rate. A 55% win rate with a 2:1 reward-to-risk ratio and disciplined execution will pass a challenge. An 80% win rate with random position sizing and no system will fail because one bad trade violates the drawdown limit. Systems enforce discipline. Indicator collections encourage discretion, and discretion leads to emotional decisions.
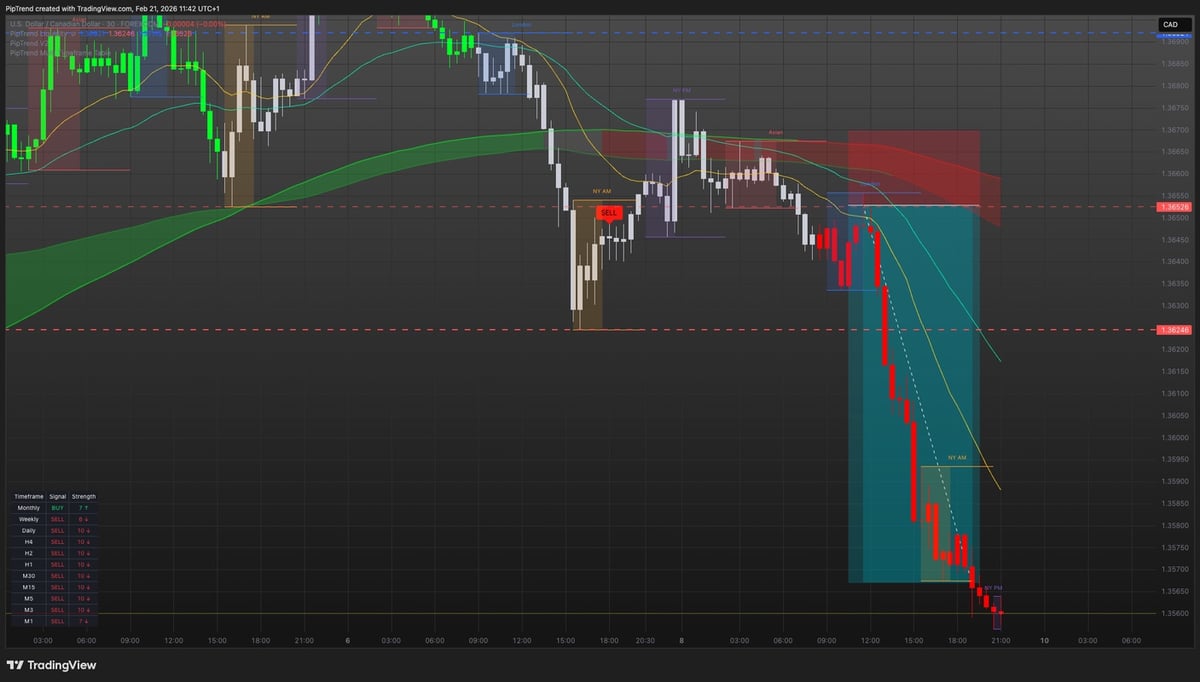
For traders who need that unified approach, PipTrend was built exactly for this problem. It separates direction, entry, and management into three distinct roles. PipTrend Core gives you non-repainting BUY/SELL signals for trend direction. Session Liquidity shows you VWAP, session highs and lows, and supply-demand zones for precise entries. The Multi-Timeframe Table displays 12 timeframes at once so you're never caught trading against the higher timeframe trend. One system, three roles, no conflicting signals. It works across Forex, Crypto, Indices, and Stocks with a 3-day free trial.
How to Test Indicators Before Trusting Them
Never add an indicator to your live trading until you've tested it. Backtesting sounds tedious, but it's the only way to know if a tool actually works or just looks good on a YouTube thumbnail. Open TradingView's bar replay feature and scroll back three months. Apply your indicator and mark every signal it generated. Did it give 10 signals with 7 winners? That's a 70% win rate. What was the average reward-to-risk ratio? If you risked 20 pips per trade and made 40 pips on winners, that's 2:1 RR.
Run this test on at least 50 trades across multiple market conditions: trending, ranging, high volatility, low volatility. An indicator that works beautifully in a trending market might fail in consolidation. You need to know its strengths and weaknesses before you risk real money.
Forward testing is even better. Add the indicator to a demo account and take every signal it gives for 30 days. Track your results in a journal: entry price, stop loss, target, actual result, market condition. After 30 days, calculate your win rate, average RR, and expectancy. If the math is positive, the indicator has proven itself. If it's breakeven or negative, discard it.
Don't trust marketing claims or highlight reels. Some popular indicator reviews show cherry-picked trades that ignore the losing signals. You need full transparency: all signals, all results, all timeframes. Verified trade results beat backtests because backtests can be optimized until they look perfect.
The best traders treat indicators like tools in a toolbox. A hammer is great for nails, terrible for screws. RSI is great for divergence, terrible for trend direction. Moving averages are great for trend, terrible for precise entries. When you know what each tool does well, you stop asking it to do things it can't.
Adapting Indicators to Different Asset Classes
Forex pairs, Crypto, Indices, and Stocks all behave differently. EUR/USD trends smoothly and respects technical levels. Bitcoin can gap 5% in seconds and ignore support entirely. The S&P 500 has distinct session behaviors with overnight gaps. Your indicators need to adapt, or your results will suffer.
For Forex, use indicators with settings that match average volatility. A 14-period ATR on EUR/USD might show 60 pips. On GBP/JPY it might show 120 pips. Your stop loss and target should scale with ATR. A 20-pip stop on GBP/JPY is suicide. A 50-pip stop on EUR/CHF is overkill. Adjust your position size and risk per trade based on the pair's ATR.
Crypto requires wider stops and faster execution. Use the 5-minute or 15-minute chart for entries, but always confirm direction on the H1 or H4. Bitcoin doesn't care about your Fibonacci levels during a news-driven spike. Stick to clean support and resistance, VWAP, and volume-based levels. Avoid over-optimized settings. Keep it simple.
Indices like the S&P 500, NASDAQ, and DAX have session-specific behavior. The first hour after the New York open is volatile. VWAP and opening range breakouts work well. From 10 AM to 2 PM EST, indices often chop. After 2 PM, momentum can return if there's a trend. Use session-based indicators and avoid trading the chop hours.
Stocks vary wildly by market cap and sector. Large-cap stocks trend more cleanly than small caps. Tech stocks have higher volatility than utilities. Match your indicator settings to the stock's behavior. A 20-period moving average might work on AAPL but fail on a low-volume penny stock. Test before you trade.
Regardless of asset class, the principle stays the same: direction from higher timeframes, entry from institutional levels, management from price action and ATR. The settings change. The process doesn't.
Timeframe Coordination for Maximum Accuracy
Most losing trades happen because traders ignore timeframe alignment. You take a beautiful 5-minute long setup, but the H1 just broke structure to the downside. Your trade is fighting the current. It might work, but the odds are against you. Timeframe coordination turns low-probability setups into high-probability ones.
Start on the Weekly chart. What's the macro trend? Is the asset in a long-term uptrend, downtrend, or range? Move to the Daily. Is the Daily aligned with the Weekly or counter-trend? If both are bullish, you have strong alignment. Drop to the H4. Wait for a pullback or consolidation. When the H4 shows early bullish momentum (MACD cross, break of structure), drop to the H1 or 15-minute chart and wait for your entry signal at a key level.
Never enter on your lowest timeframe without confirming the next two higher timeframes. If you trade the 5-minute chart, check the 15-minute and H1. If you trade the H1, check the H4 and Daily. This simple rule eliminates most bad trades.
Use a multi-timeframe table if your platform supports it. This shows you all timeframes at once: 1-minute, 5-minute, 15-minute, H1, H4, Daily, Weekly. You see instantly if all timeframes are aligned or if there's conflict. When six timeframes show bullish and one shows bearish, you know where the strength is.
Prop firm traders benefit massively from this approach. You're not gambling on 1-minute scalps. You're taking 5-minute entries backed by H1 and H4 confirmation. Your drawdown stays tight because you're trading with the momentum, not against it. Your win rate improves because your setups have structural support.
Swing traders and long-term investors use the same logic on higher timeframes. Check the Monthly and Weekly for macro trend. Enter on the Daily or H4 when price pulls back to a key level. Manage the trade using Weekly structure and ATR-based targets. The process scales perfectly.
Eliminating Emotional Trading with Clear Rules
Indicators don't fix emotional trading. Systems do. When you have a checklist, you can't second-guess yourself. You either have all the conditions or you don't. No discretion. No "this time is different." The trade meets the rules or it doesn't exist.
Your checklist might look like this: Daily trend is up (50 EMA slope positive). H4 MACD crossed bullish. H1 price pulled back to VWAP. 15-minute bullish engulfing candle formed at VWAP. Enter long. Stop below the engulfing candle low. Target is 2x ATR. If any condition is missing, there's no trade.
This approach forces you to wait for A+ setups. You're not chasing. You're not entering out of boredom. You're not revenge trading after a loss. The market either gives you your setup or it doesn't. Most days it doesn't. That's fine. You preserve capital and wait for the next high-probability trade.
Prop firm rules require this mindset. You have a daily loss limit, a max drawdown, and a profit target. One emotional trade can wipe out a week of gains. Systems keep you disciplined when emotions are screaming at you to double down or chase a breakout without confirmation.
This is also where understanding which indicators work together becomes critical. You can't rely on one signal. You need confluence: trend direction confirmed by two timeframes, entry confirmed by price action at a key level, and risk management confirmed by ATR and stop placement. When all three align, you have a trade. When one is missing, you have nothing.
The best TradingView indicators are the ones that give you direction, show you where to enter, and help you manage the trade without repainting or conflicting signals. Most traders fail because they use ten indicators to answer one question, or worse, they use one indicator to answer three questions it can't handle. If you're tired of cluttered charts and inconsistent results, PipTrend was built to solve exactly that. Direction, entry, and management in one unified system across every timeframe and asset class. Try it free for three days and see what systematic trading actually looks like.