
You open EUR/USD on a Tuesday morning and the 1-hour chart shows a clean uptrend. You buy at 1.0850 with a 20-pip stop. Price immediately reverses, stops you out, then rallies 80 pips without you. You check the 5-minute chart and see massive selling volume right where you entered. Institutions were distributing while you were buying. This happens because direction doesn't equal entry. You need to know where the smart money is actually trading, and that's exactly what volume weighted average price reveals every session.
The volume weighted average price gives you the average price weighted by volume traded at each price level. It resets at the start of each trading session and plots a single line that moves throughout the day. When price trades above this line, buyers control the session. When price trades below, sellers control it. The calculation aggregates every transaction, giving heavier weight to prices where more volume occurred. This makes it fundamentally different from a simple moving average that treats all periods equally regardless of activity.
What Volume Weighted Average Price Actually Tells You
Volume weighted average price shows you fair value for the current session. Institutional traders use it as a benchmark to execute large orders without moving the market too much. When a bank needs to sell 100 million EUR/USD, they aim to get a price close to VWAP. This creates natural support and resistance at the VWAP line throughout the session. You see price bounce off it repeatedly because institutions are actively trading there.
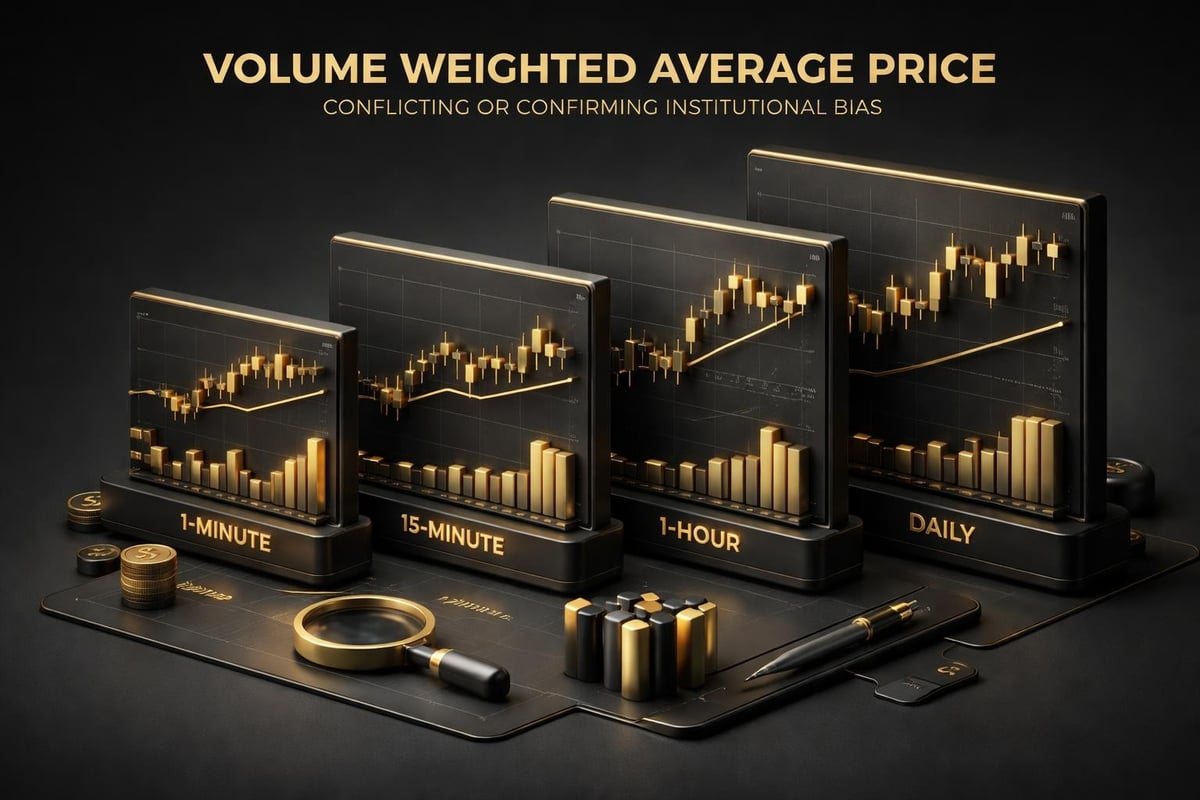
The line slopes upward in a bullish session and downward in a bearish one. The angle matters more than the direction alone. A steep upward slope means strong buying pressure with increasing volume at higher prices. A flat VWAP in a trending market means weak conviction and potential reversal ahead. You should watch how price interacts with the line across multiple timeframes. EUR/USD might trade above VWAP on the 1-hour but below it on the 15-minute, telling you the larger trend is bullish but the immediate momentum is bearish.
According to Britannica Money’s explanation of volume weighted average price, institutions prefer this metric because it reflects actual market participation rather than just price movement. You're not guessing where smart money is. You're seeing exactly where they're executing orders based on real volume data.
Calculating and Setting Up VWAP Across Sessions
The volume weighted average price formula multiplies each price by its volume, sums those values, then divides by total volume. On TradingView, the indicator handles this automatically. You add VWAP from the indicators menu and it plots immediately. The default settings work for most traders, but you need to understand what resets the calculation.
Standard VWAP resets at the start of each trading session. For Forex, that typically means midnight UTC or the start of the New York session at 8:00 AM EST. For stocks, it resets at market open. Some platforms offer anchored VWAP where you manually set the starting point to a specific candle, useful for tracking price action from major news events or swing highs and lows. The session-based version is what institutions use and what you should focus on for daily trading.
On the 5-minute chart, VWAP gives you precise intraday entries. On the 1-hour chart, it confirms the session bias. On the Daily chart, you're looking at historical VWAP levels that acted as support or resistance in previous sessions. These don't update intraday but show you where institutions valued the asset on specific days. A trader running a prop firm challenge might use the 15-minute VWAP for entries while confirming direction on the 1-hour and Daily charts.
Timeframe Application Strategy
| Timeframe | VWAP Purpose | Check Frequency | Primary Use |
|---|---|---|---|
| 1-minute | Scalp entries during high volatility | Every 5-10 candles | Confirmation after 5m signal |
| 5-minute | Intraday entry precision | Every new candle | Primary entry timeframe |
| 15-minute | Session bias confirmation | Every 2-3 candles | Filter for 5m trades |
| 1-hour | Trend direction | Every candle close | Direction decision |
| 4-hour | Swing trade setup | Twice per session | Position bias |
| Daily | Institutional levels from previous sessions | Once per day | Key support/resistance zones |
You want volume weighted average price on at least three timeframes simultaneously. Direction on H1, entry on 5m, management on 15m. This separation prevents the mistake of trading direction signals as entry points.
Trading VWAP Bounces and Rejections
Price approaches VWAP from below on your 5-minute EUR/USD chart. Volume increases as it touches the line. The next candle closes above VWAP with a bullish engulfing pattern. You enter long with a 15-pip stop below VWAP and target 30 pips above. Your risk-to-reward ratio is 1:2. This works because institutions are defending VWAP as support, creating a high-probability bounce setup.
The key is waiting for confirmation. Price can touch VWAP multiple times before actually bouncing. You need a candle close above VWAP plus a volume spike showing buyers stepping in. Without volume confirmation, the bounce often fails. Watch for wicks that pierce VWAP but close back on the other side. These show rejection and strengthen the trade setup. On GBP/JPY, a 5-minute candle might wick 8 pips below VWAP but close 3 pips above it. That's institutional buying absorbing sell pressure.
Your stops go just beyond VWAP with 3-5 pips buffer depending on the pair's average spread and volatility. EUR/USD gets 3 pips, GBP/JPY gets 8 pips. Targets should be recent swing highs or lows, not arbitrary pip counts. If the recent swing high is 25 pips away and you have a 15-pip stop, that's a 1:1.67 ratio. You take it if volume and price action confirm.
VWAP rejections work the same way in reverse. Price rallies into VWAP from below, creates a shooting star candle on the 15-minute chart, and closes back below the line. You short with stops above VWAP. The rejection tells you institutions aren't willing to buy above fair value yet. They're fading the move, and you're trading with them.
Multi-Timeframe VWAP Confirmation
You don't trade a 5-minute VWAP bounce if the 1-hour chart shows price rejected VWAP and is trending lower. The timeframes must align. Check the H1 VWAP first to establish session bias. If price is above H1 VWAP and the line is sloping upward, you only take long setups on the 5-minute chart. If H1 shows price below VWAP with a downward slope, you only short 5-minute bounces.
The 15-minute timeframe acts as your filter between direction and entry. After the H1 confirms bullish bias, you wait for the 15-minute chart to show price above its VWAP before looking at 5-minute entries. This three-layer approach cuts false signals dramatically. The setup looks like this: H1 VWAP bullish, 15m VWAP bullish, 5m price bounces off VWAP with volume. All three confirm. You enter long.
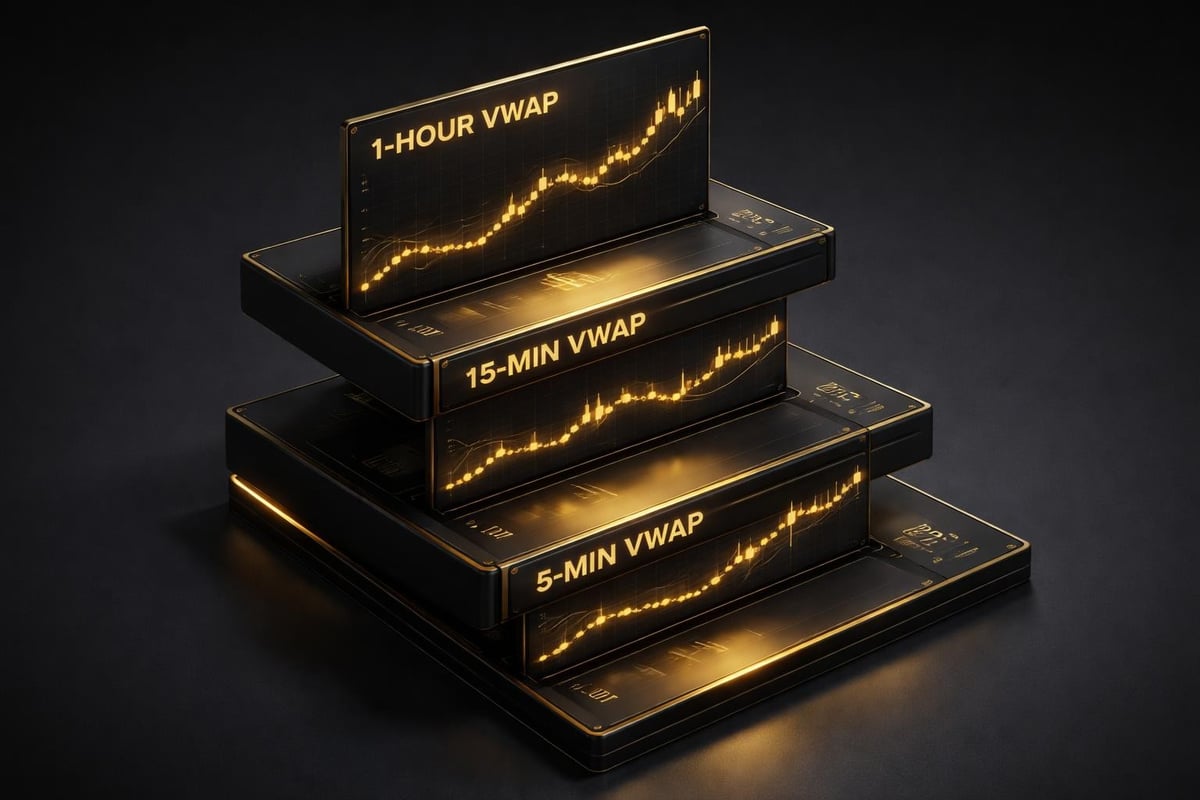
For swing trades, extend this to higher timeframes. Daily VWAP shows the long-term institutional view. H8 VWAP (8-hour) gives you the swing direction. H1 VWAP confirms momentum. You enter on the 15-minute VWAP bounce when all four align. This approach works across Forex pairs like EUR/GBP, Crypto assets like BTC/USD, Indices like NAS100, and Stocks like AAPL. The same rules apply regardless of asset class.
Prop firm traders need tight drawdown control. VWAP multi-timeframe confirmation provides that because you're not chasing moves. You wait for alignment, enter at institutional levels, and manage with clear invalidation points. A 5% drawdown rule becomes easier to maintain when you're trading with volume confirmation rather than against it.
Combining VWAP With Price Action Structures
Volume weighted average price works best when combined with support and resistance zones, supply and demand areas, and session highs and lows. VWAP by itself shows fair value. Support and resistance show where price previously reversed. When VWAP intersects a support zone, you have double confluence for entries.
GBP/USD creates a demand zone on the H1 chart between 1.2650 and 1.2670. Price drops during London session and VWAP sits at 1.2665, right in the middle of the zone. Price touches 1.2660, creates a bullish pin bar on the 5-minute chart, and volume spikes. You enter long at 1.2665 with a stop at 1.2645 (20 pips) and target the session high at 1.2715 (50 pips). That's a 1:2.5 risk-to-reward setup with triple confirmation: demand zone, VWAP support, and bullish price action.
Session highs and lows (HOD/LOD) create natural magnets for price. When VWAP aligns near the session low during a bullish session, institutions often defend it aggressively. They don't want to pay higher prices than necessary, so they accumulate near session lows when trend direction is up. You're looking for price to test the session low, bounce off VWAP, and confirm with a bullish candle pattern. The inverse applies at session highs during bearish trends.
As The Motley Fool notes in their VWAP analysis, individual traders gain an edge by understanding where institutional orders cluster. You're not trading against the banks. You're trading with them by identifying the levels they're defending.
Common VWAP Mistakes That Kill Accounts
The biggest mistake is entering the moment price touches VWAP without waiting for confirmation. Price can slice through VWAP like it doesn't exist, especially during high-impact news releases. You need a candle close and volume confirmation. Entering on the touch means you're guessing. Entering after confirmation means you're reacting to proven institutional activity.
Another error is using VWAP alone without checking higher timeframe context. Your 5-minute chart might show a perfect VWAP bounce, but if the H1 chart shows a strong downtrend with price 100 pips below its VWAP, your long trade is fighting the larger flow. You win the battle and lose the war. Context matters more than the individual setup. According to ChartSchool’s technical guide on volume weighted average price, the indicator's effectiveness increases significantly when paired with trend analysis.
Traders also fail to adjust stops based on volatility. A 10-pip stop might work on EUR/USD but gets blown out immediately on GBP/NZD. Calculate average true range (ATR) for the past 14 periods and use that to set appropriate stop distances from VWAP. If ATR is 25 pips, your stop should be at least 25-30 pips from entry, not the generic 10-15 pips you use on less volatile pairs.
Ignoring volume is the final critical error. VWAP is a volume-weighted indicator. When volume is low, the calculation becomes less reliable because it's not reflecting true institutional activity. During Asian session on EUR/USD, volume drops significantly. VWAP bounces during this period carry less weight than the same setup during London or New York sessions. You want to see volume at least 20% above the session average when price interacts with VWAP.
VWAP in Different Market Conditions
Trending markets show VWAP acting as dynamic support in uptrends and resistance in downtrends. Price stays consistently above VWAP during strong bullish trends, only touching it briefly before continuing higher. These touches are your entry points. You're buying the pullback to institutional fair value in a confirmed trend. The slope of VWAP confirms trend strength. A steep slope with price 30-50 pips above VWAP means strong momentum. Enter on the first pullback to VWAP with confirmation.
Range-bound markets show price crossing VWAP repeatedly with no clear directional bias. VWAP stays relatively flat. In this condition, you fade the extremes rather than trading bounces. When price reaches the top of the range and VWAP is in the middle, you short back toward VWAP. When price hits the bottom of the range, you long back toward VWAP. The key is recognizing range conditions early so you don't try to trend-trade a ranging market.
Volatile breakout conditions make VWAP less reliable initially. When major news hits and price gaps 80 pips in five minutes, VWAP takes time to catch up. Wait for the initial spike to settle, let VWAP recalculate for 15-30 minutes, then look for the first retest of VWAP as a continuation entry. BTC/USD does this frequently. News drops, price spikes $1,200 in 10 minutes, then pulls back to VWAP 30 minutes later. That pullback with volume confirmation is your entry for the next leg.
VWAP Behavior by Market Condition
| Market Type | VWAP Slope | Price-VWAP Distance | Trading Approach | Risk-to-Reward Target |
|---|---|---|---|---|
| Strong uptrend | Steep upward | 40-80 pips above | Buy VWAP pullbacks only | Minimum 1:2 |
| Weak uptrend | Gentle upward | 15-25 pips above | Buy with tight stops | 1:1.5 acceptable |
| Range | Flat/choppy | Crosses frequently | Fade extremes to VWAP | 1:1 to VWAP target |
| Strong downtrend | Steep downward | 40-80 pips below | Sell VWAP rejections only | Minimum 1:2 |
| Breakout | Lagging/adjusting | Extreme distance | Wait for first retest | 1:3 potential |
You adjust your strategy based on what the market is showing you, not what you want it to be. VWAP tells you what's happening. Your job is to read it correctly and trade accordingly.
Building a Systematic VWAP Trading Process
Your process needs to be repeatable. Same checks, every trade, no exceptions. Start with the Daily chart. Note where VWAP was on previous sessions and mark those levels. Drop to H8 or H4 depending on your trading style. Identify the VWAP slope and price position. Move to H1 for session bias. Confirm VWAP direction matches your intended trade direction. Finally, drop to 15m and 5m for entry.
On the 5-minute chart, you wait for one of three setups: VWAP bounce with bullish candle close and volume spike (long), VWAP rejection with bearish candle close and volume spike (short), or VWAP breakout with retest and volume confirmation (trend continuation). You don't invent new setups. You wait for these three. When they appear with multi-timeframe alignment, you trade them. When they don't, you watch.
Position sizing must account for distance to VWAP. If your entry is 8 pips from VWAP and you need a 12-pip stop (VWAP plus buffer), you calculate lot size based on that 12-pip risk. On a $10,000 account risking 1%, that's $100 risk. With USD pairs at $10 per pip per standard lot, you trade 0.83 lots (83,000 units). The math must be exact before you enter.
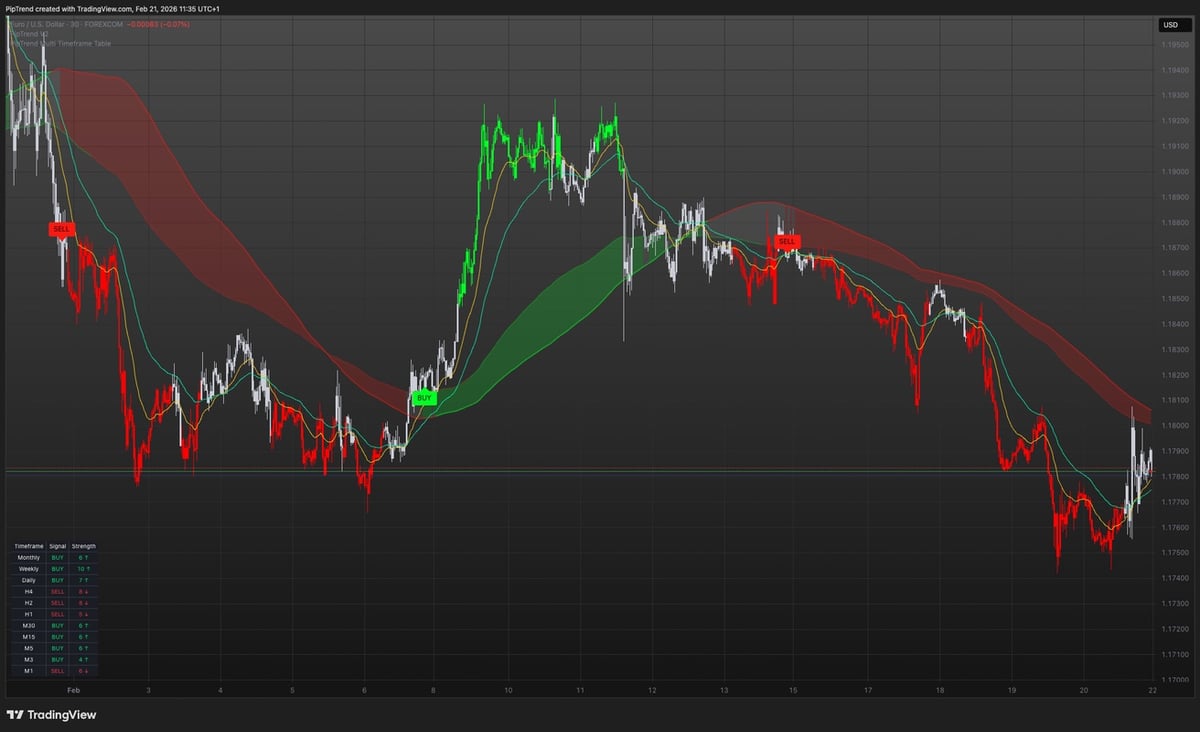
PipTrend's Session Liquidity indicator shows you VWAP alongside high of day (HOD), low of day (LOD), and supply/demand zones on a single chart. This eliminates the need to manually plot levels or guess where institutional liquidity sits. You see VWAP intersecting a demand zone in real-time, get a non-repainting BUY signal from PipTrend Core when price action confirms, and check the Multi-Timeframe Table to verify alignment across 12 timeframes instantly. The system handles the multi-timeframe confirmation process that typically requires juggling four different charts.
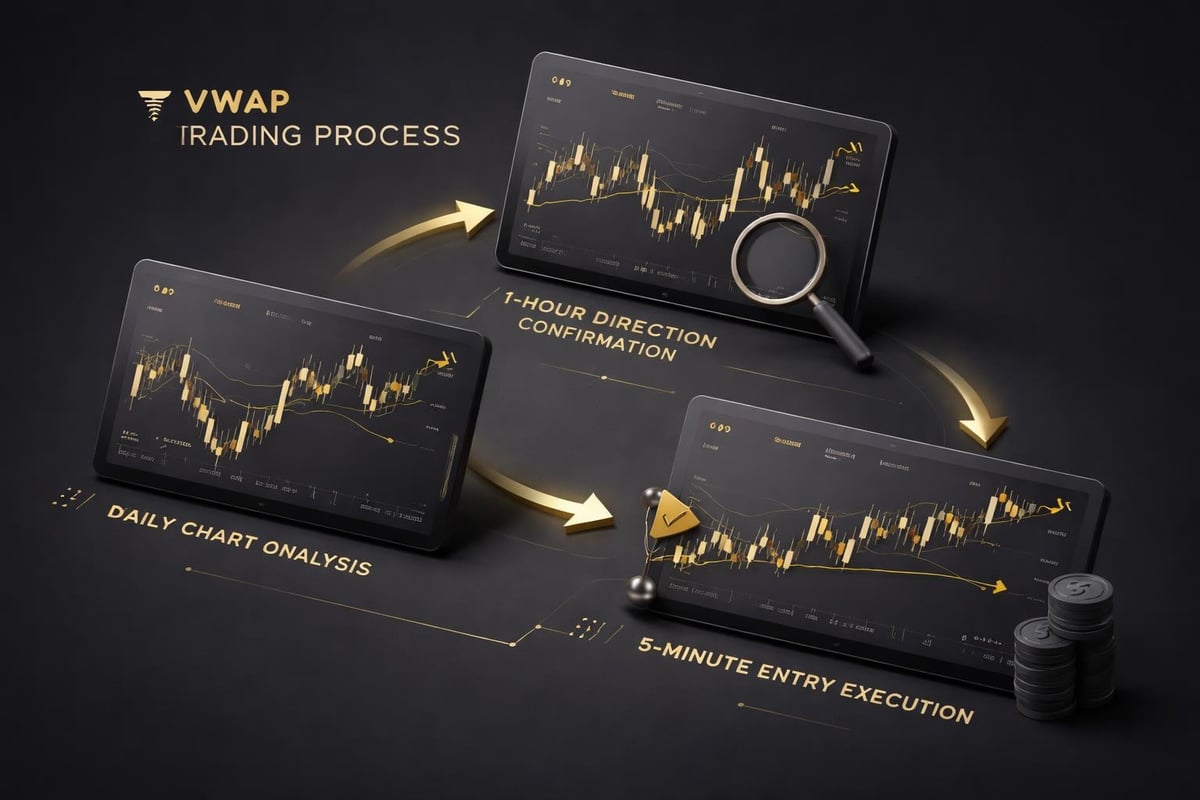
Entry execution requires discipline. You set your alert for when price approaches VWAP on the 5-minute chart. When the alert triggers, you check H1 and 15m for confirmation. If confirmed, you wait for the candle to close. If the candle closes with your criteria met, you enter immediately at market or within 2 pips of the close. Your stop goes in instantly. Target is set based on recent structure, not hope. You then step away until the next alert or the trade hits a target or stop.
Advanced VWAP Techniques for Experienced Traders
Anchored VWAP lets you track institutional activity from specific events. After a major economic release like Non-Farm Payrolls, you anchor VWAP to the candle where the news released. This shows you the average price institutions paid since that moment. If price returns to this anchored VWAP level days later, it often bounces because that's where large positions were initiated. Institutions defend their entry prices.
You can also anchor VWAP to major swing highs and lows. When price makes a new monthly high, anchor VWAP to that candle. Price often retraces to test this level before continuing higher. The anchored VWAP from the swing high acts as support on the retracement because traders who missed the breakout are waiting there to enter. This works particularly well on Weekly charts for swing trades lasting days or weeks.
Multiple VWAP bands can be added to show standard deviation channels similar to Bollinger Bands. When price reaches the upper band (typically one or two standard deviations above VWAP), it's overextended and likely to revert to the mean. You can short the extreme with targets back at VWAP. This works in ranging markets but fails in strong trends where price can stay extended for extended periods.
For institutional trade tracking, compare where price closed the previous session relative to that day's VWAP. If price closed significantly above VWAP (30+ pips on Forex majors), institutions accumulated during the session. The next day often continues higher as they defend their long positions. If price closed significantly below VWAP, distribution occurred and bearish continuation is likely. MarketsWiki’s historical perspective on volume weighted average price explains how this metric evolved specifically for institutional trade analysis.
Integrating VWAP Into Your Full Trading Plan
Volume weighted average price should complement your existing edge, not replace it. If you trade supply and demand zones, add VWAP as confluence. If you trade breakouts, use VWAP retests for continuation entries. If you trade with trend, use VWAP slope to confirm trend strength. The indicator works with multiple strategies because it represents real institutional activity regardless of your technical approach.
Your trading plan needs specific VWAP rules. Define exactly what constitutes a valid VWAP bounce on each timeframe you trade. Write down the candle patterns you accept, the minimum volume increase required, and the multi-timeframe checks you must complete. When you review trades, check if you followed these rules. Losing trades that followed your rules are acceptable. Winning trades that broke your rules are dangerous because they encourage bad habits.
Backtesting VWAP strategies requires manual work since volume patterns change based on market conditions. Replay 50-100 trading sessions on your primary pairs. Mark every VWAP setup that met your criteria. Track which ones would have hit targets versus stops. Calculate your actual edge with real pip values. If EUR/USD VWAP bounces on the 5-minute chart win 60% of the time with 1:2 average risk-to-reward, your expectancy is positive and the strategy is worth trading live. The systematic approach detailed at PipTrend applies this same verification process to ensure strategies work in live market conditions before committing capital.
Risk management around VWAP trades follows standard principles but with volume awareness. When volume is below average and you take a VWAP setup, reduce position size by 50%. The setup is less reliable without strong volume confirmation. When volume is 2x average and all timeframes align, you can trade your full position size because probability is maximized. Never increase size beyond your risk limits regardless of setup quality.
Journaling must track VWAP-specific data. Log the VWAP slope angle, distance of entry from VWAP, volume compared to session average, and whether higher timeframes confirmed. After 30 trades, patterns emerge. You might notice your VWAP bounce trades win 70% when H1 confirms but only 45% when you skip that check. The data shows you exactly where your edge comes from and where it disappears.
Volume weighted average price gives you what indicators alone cannot: real-time institutional activity levels backed by actual volume data. When you trade VWAP with multi-timeframe confirmation, proper position sizing, and volume verification, you're aligning with smart money rather than guessing at direction. If you're tired of cluttered charts and conflicting signals, PipTrend unifies direction, entry, and management into one systematic approach-showing you VWAP alongside session liquidity levels with non-repainting signals and 12-timeframe confirmation in a single view.