Bullish Candle Patterns: A Trader's Guide to Reading Them Right
On this page
Why One Green Candle Isn’t a Trading Signal
Price drops for six sessions straight. Then a big green candle appears. The trader buys, feels smart for about twenty minutes, and gets stopped out before lunch.
This happens constantly. Not because candlestick analysis is broken, but because a single bullish candle is raw data, not a signal. It tells you buyers won one period. It says nothing about whether they can win the next one.
The core argument of this guide is simple: a bullish candle pattern only carries meaning when you evaluate it alongside three things. The trend that preceded it. The location on the chart where it formed. And whether something confirmed it after the fact.
Strip away any one of those and you’re guessing with extra steps.
There’s also a definitional problem worth clearing up early. A bullish candle is any candle that closes above its open. A bullish candlestick pattern is a specific multi-candle structure, appearing after a defined decline or bearish pressure, that meets measurable criteria.
Those are not the same thing, and conflating them is where most beginners lose money.
By the end of this article you’ll have four concrete tools:
Identification rules for the five patterns that matter most, with exact measurement criteria rather than vague descriptions. Confirmation criteria so you know what has to happen before the pattern earns your capital. Invalidation points that define where the idea is wrong, decided before you enter. And a repeatable checklist you can run in under sixty seconds on any chart.
None of this makes candlesticks predictive. It makes them useful, which is a very different and far more profitable thing.
What Actually Makes a Candle Bullish?
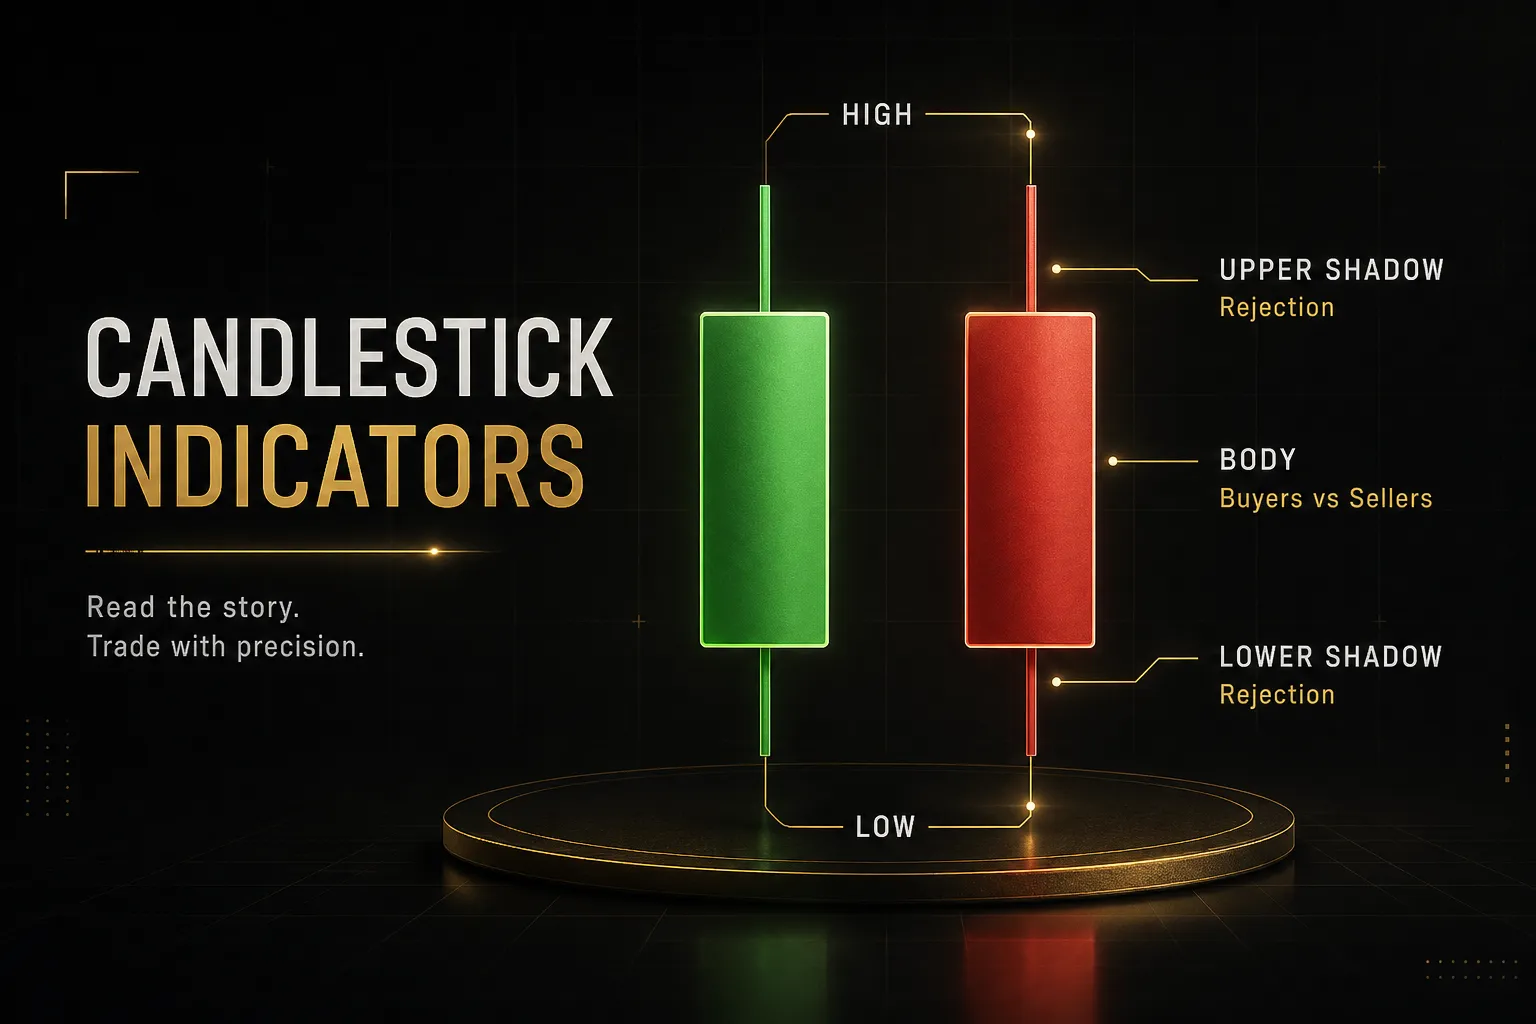
Every candle on a candlestick chart encodes four numbers: open, high, low, close. That’s it. The visual is just a clever way of showing relationships between those four values.
A candle is bullish when the close sits above the open. The real body (the thick rectangular part) spans the distance between open and close. The thin lines extending above and below, the upper and lower wick, mark the highest and lowest prices traded during that period.
Here’s what those elements actually tell you. A long real body means buyers controlled the period from start to finish with little argument. A small body means open and close finished close together, which is a stalemate regardless of colour.
Wicks are rejection evidence. A long lower wick means sellers pushed price down and buyers rejected it, dragging the close back up. A long upper wick means the opposite: buyers tried, sellers slapped them down before the close.
The body shows who won. The wicks show who tried and failed.
Now the part that costs people money. A bullish candle reflects one period of net buying pressure.
Nothing more. On a daily chart, a green candle means more buying than selling occurred over those 24 hours. It carries no information about tomorrow.
Markets don’t have memory in the way traders imagine. What gives a bullish candle predictive value is not the candle itself but the situation surrounding it.
A genuine bullish candlestick pattern requires more. It needs a specific structure, usually spanning two to three candles, and it needs a preceding decline or clear bearish pressure to qualify as a reversal signal. A bullish engulfing pattern in the middle of a raging uptrend is not a reversal of anything.
It’s just a big green candle.
Which brings us to the myth: not every green candle is a pattern. In a typical trading month you might see fifteen strong green candles on a daily chart. Maybe two of them sit at a location and in a trend context where the pattern label means something.
Context filters the noise. Trend, volume, and location do the actual work.
Reversal vs Continuation Patterns
The same candle shape means different things depending on what came before it.
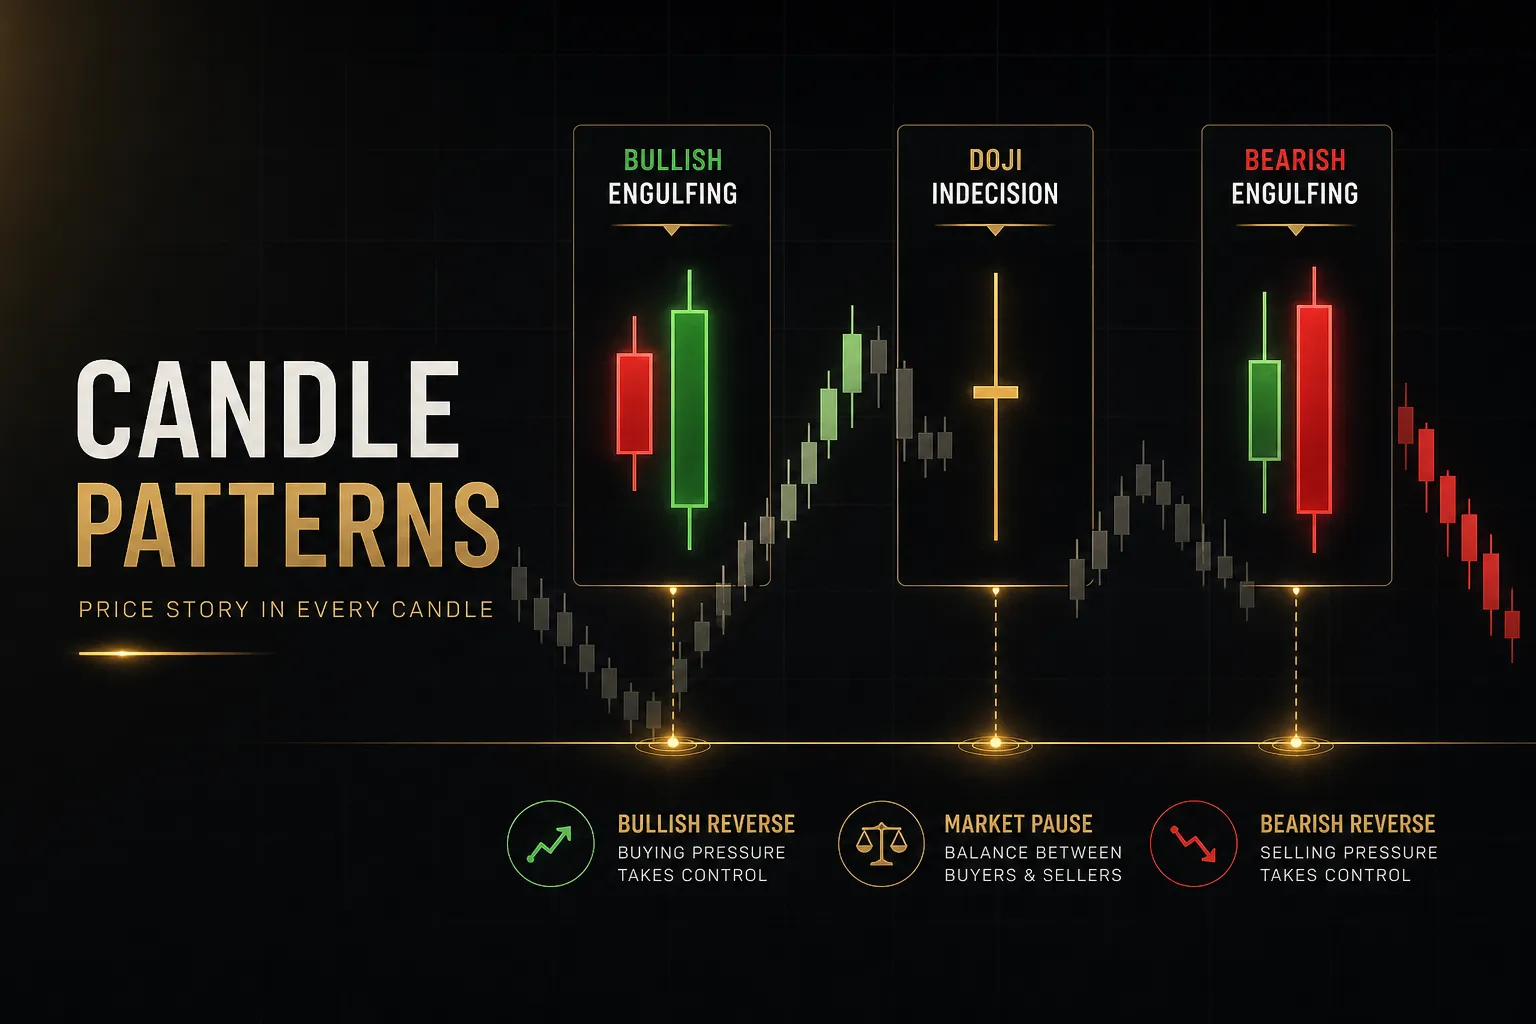
A bullish reversal pattern forms after a decline and suggests the selling pressure has been absorbed. Hammers, morning stars, bullish engulfing candles, and the piercing line all fall into this bucket. Their entire logic depends on there being something to reverse.
A bullish continuation pattern forms within an existing uptrend and suggests the trend is resuming after a pause. Three white soldiers after a shallow pullback is continuation evidence. So is a strong bullish engulfing candle off a rising moving average inside a clean uptrend.
Misclassifying the two is a quiet killer. Traders take reversal-sized positions on continuation setups, or wait for continuation-style pullbacks that never come because the market is actually reversing.
Objective Ways to Confirm a Prior Trend
“After a downtrend” is useless unless you define downtrend. Pick a method and apply it mechanically.
The market structure approach: over your chosen lookback (say 20 candles), price must have printed at least two consecutive lower highs and two lower lows. No lower highs, no downtrend, no reversal pattern.
The moving-average approach: price trades below a 50-period moving average and that average is sloping down. Simple, testable, and it removes the argument.
The percentage approach: price has declined a defined amount, perhaps 5% on a daily chart or 1.5% on an intraday forex chart, over the lookback window.
Any of the three works. Switching between them mid-analysis so the chart agrees with you does not.
Common Bullish Candlestick Patterns
Five patterns cover the vast majority of usable bullish setups. Learn these properly and you can ignore the exotic ones with Japanese names nobody can pronounce.
Each one below includes structural requirements, the trend context it needs, and what confirmation should look like. Note the measurement criteria: they’re specific on purpose, because “small body near the top” is not a rule you can test.
| Pattern | Structure & Identification Rules | Required Prior Trend | Typical Confirmation Signal |
|---|---|---|---|
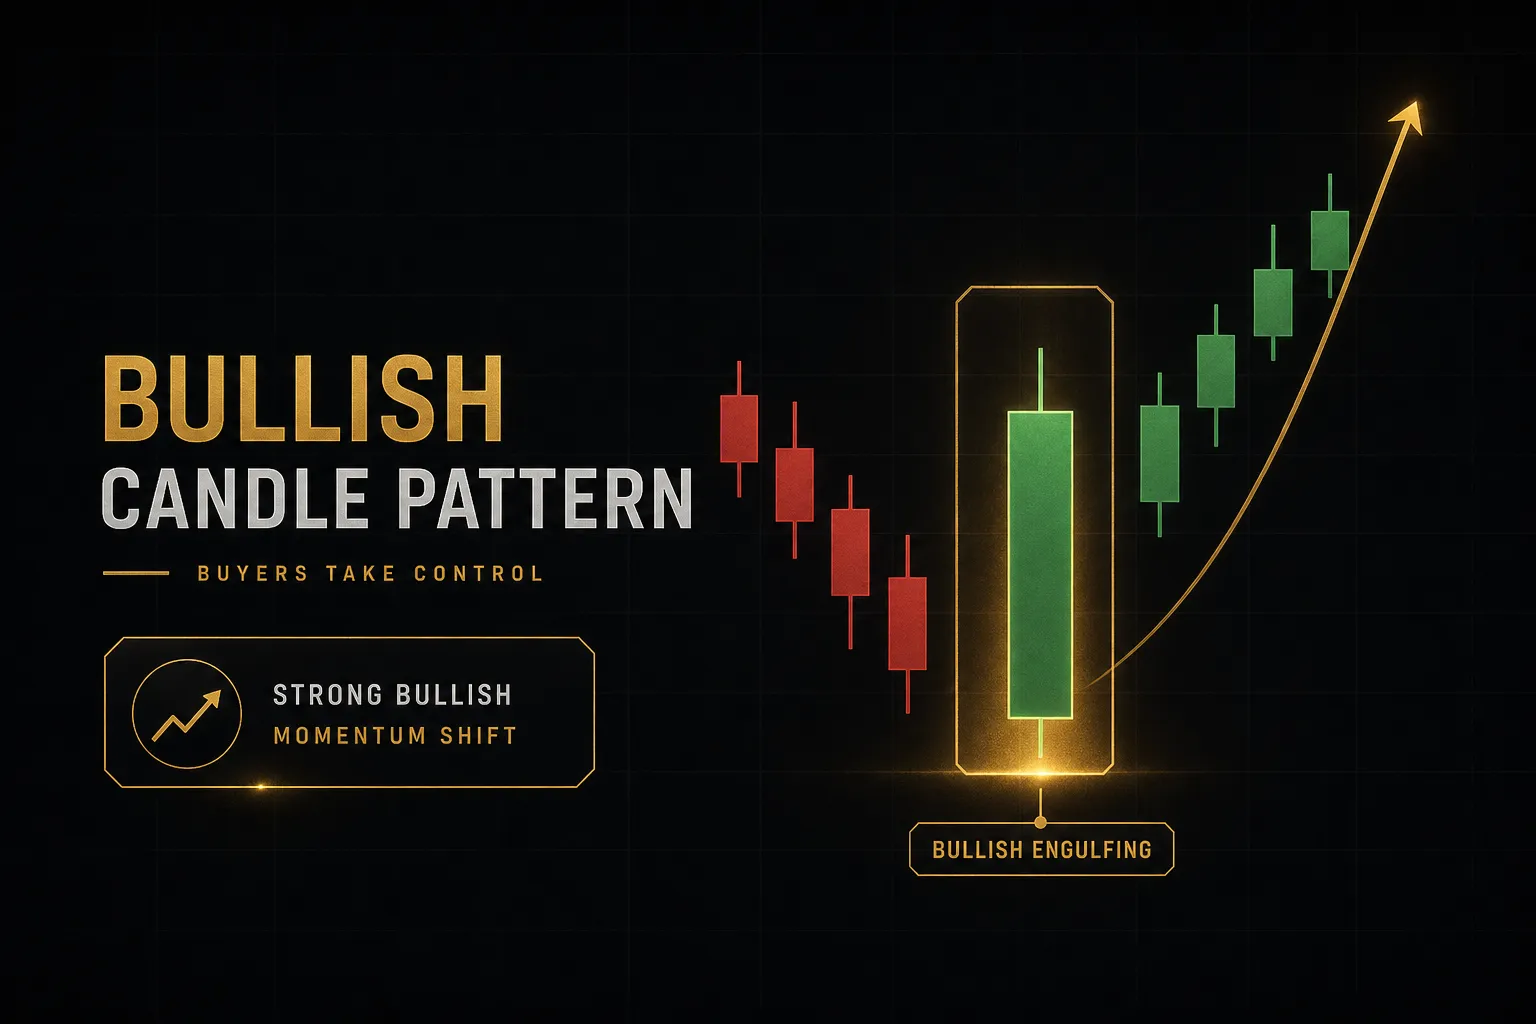
| Bullish Engulfing | Two candles. First is bearish. Second is bullish and its real body fully covers the prior red body (opens at or below prior close, closes at or above prior open). Body-to-body, not wick-to-wick. | Downtrend or clear pullback of at least 3 to 5 candles with lower highs | Next candle closes above the engulfing candle’s high |
| Hammer | Single candle. Small real body positioned in the upper third of the range. Lower wick at least 2x the body length. Upper wick minimal or absent (under 25% of body). | Downtrend, ideally into a known support level | Close above the hammer’s high, plus volume expansion on the hammer itself |
| Inverted Hammer | Single candle. Small body in the lower third of the range. Upper wick at least 2x the body. Minimal lower wick. Colour is secondary. | Downtrend only. In an uptrend the same shape is a shooting star (bearish) | Strong follow-through candle closing above the upper wick’s high |
| Morning Star | Three candles. Long bearish candle, then a small-bodied indecision candle (gapping down where possible), then a bullish candle closing above the midpoint of candle one. | Established downtrend of 5+ candles | Third candle’s close above candle one’s midpoint is the confirmation; a fourth higher close strengthens it |
| Three White Soldiers | Three consecutive bullish candles, each closing higher than the last, each with a small upper wick, each opening within the prior candle’s real body. | Works as reversal after a base, or continuation after a shallow pullback | Sustained volume across all three candles; hold above soldier one’s open |
Two details deserve emphasis. For bullish engulfing, the second candle must engulf the body, not the wicks. Wick-to-wick engulfing is a stricter variant some traders prefer, but body engulfing is the standard definition and the one most literature tests.
For the hammer candlestick, the 2x lower wick ratio is the non-negotiable part. A candle with a lower wick 1.2x its body is just a candle with a lower wick.
Now the uncomfortable part. You’ll see plenty of content claiming a particular pattern is the “strongest” or “most reliable.” Treat those claims carefully, because signal quality and trade expectancy are different measurements.
A pattern can be directionally correct 60% of the time and still lose money if the winners are small and the losers are large. Conversely a 40% win rate pattern with 3:1 risk-to-reward is highly profitable. Academic research on candlestick predictive power is genuinely mixed: some studies find modest edges in specific markets and timeframes, others find results collapse once transaction costs and realistic execution are included.
Pattern quality depends on market conditions, holding period, and costs. Not the shape alone. A morning star on a daily EUR/USD chart in a trending regime is a different animal from the same shape on a 5-minute chart during the Asian session, where the spread alone can eat the expected move.
Context Decides Whether a Pattern Matters
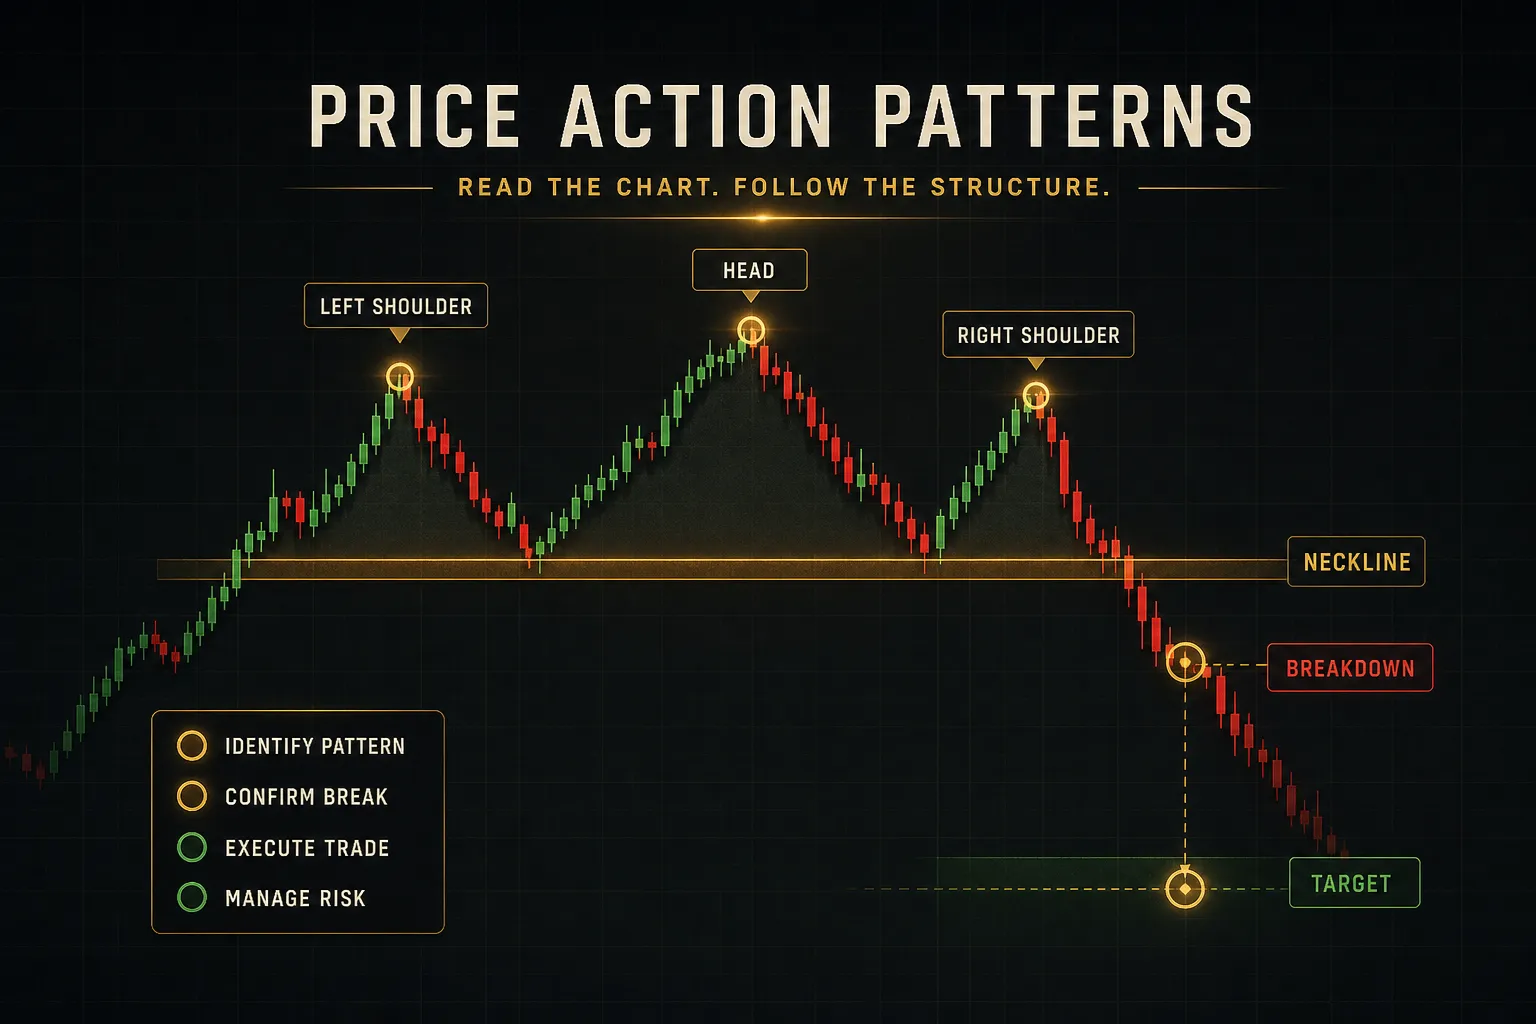
Take one bullish engulfing candle and place it in four different locations on a chart. You get four different trades, three of which you shouldn’t take.
Start with the trend validation. Before you attach the word “reversal” to anything, confirm the decline is real using one of the objective methods above. Set your lookback period before you look, not after. A common standard: 20 candles on the timeframe you’re trading, requiring at least two lower highs and two lower lows.
This single discipline eliminates roughly half the patterns people trade. Most so-called reversal signals form inside sideways ranges where there was no trend to reverse.
Location does the rest of the filtering.
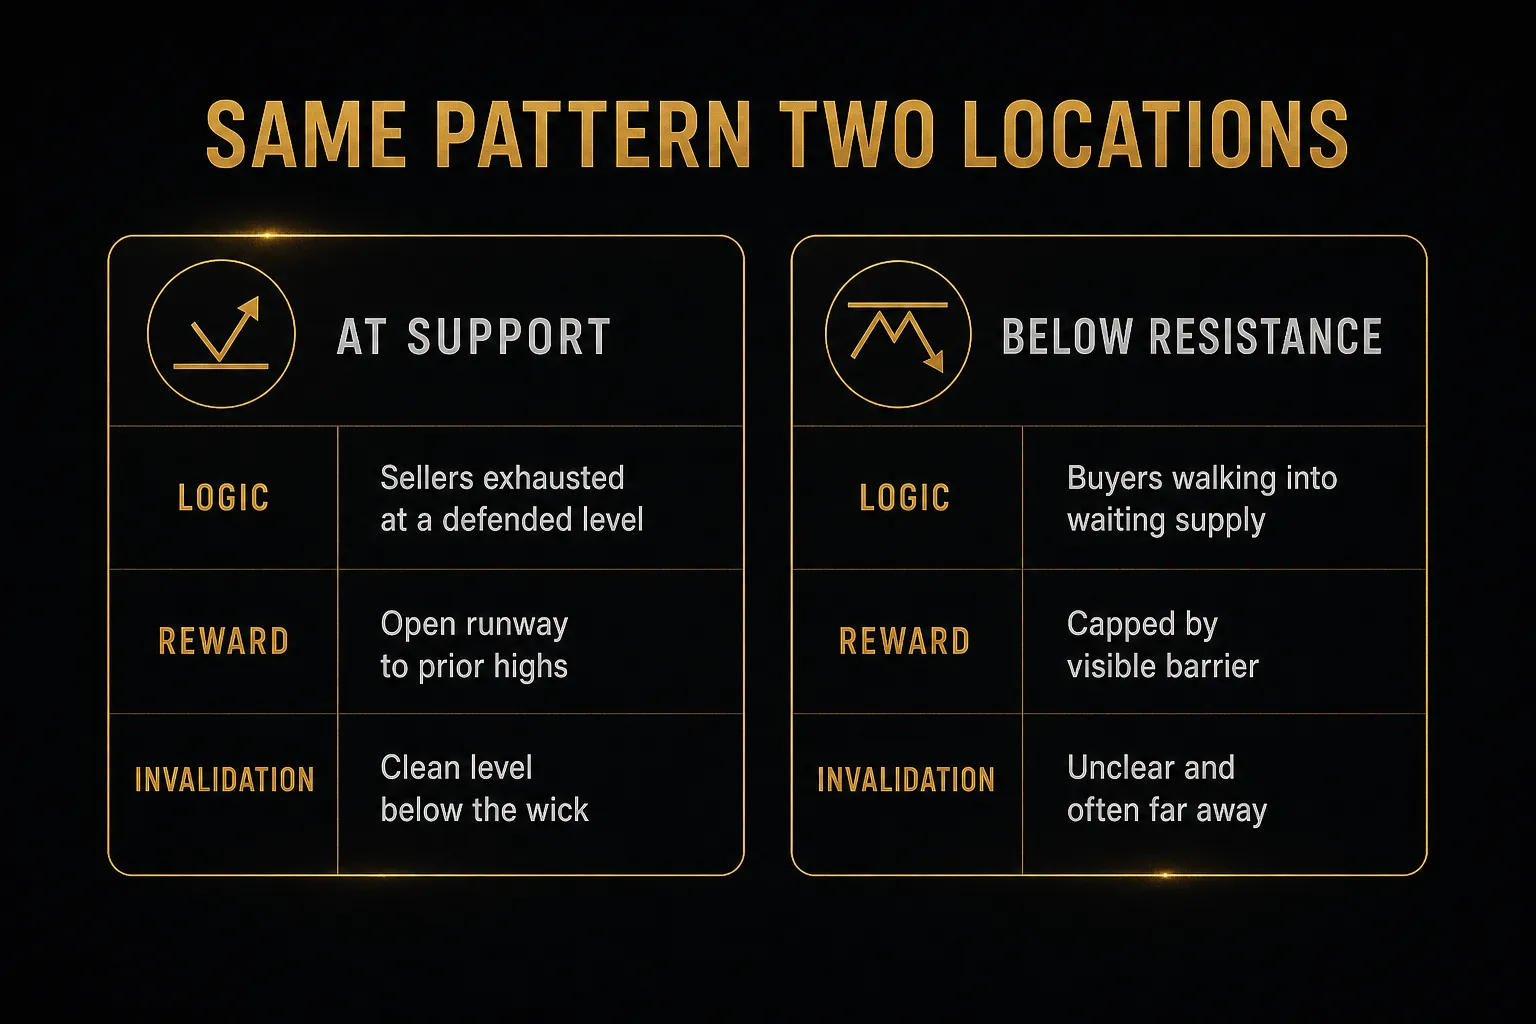
At established support: this is where reversal patterns earn their reputation. A hammer with a long lower wick piercing a level that has held twice before, then closing back above it, is a liquidity sweep followed by rejection. That’s a real, mechanically explainable event.
Directly beneath resistance: the worst place to buy a bullish pattern. You’re entering right where sellers are waiting. Your reward is capped at the distance to a barrier you can see, while your risk is open-ended.
Mid-range: ambiguous. No clear invalidation level, no clear target, no reason for anyone to defend the price. Skip it. Most losing trades come from setups that were technically valid patterns in structurally meaningless locations.
Inside an established impulsive uptrend: the pattern isn’t a reversal at all, it’s continuation evidence. This is often the highest-probability version, because you’re trading with the dominant force rather than against it. Just don’t size it like a reversal or target it like one.
Forex traders need a few extra considerations that equity traders can ignore.
Weekend gaps exist in spot forex but are rare and usually small, which means gap-dependent patterns like the textbook morning star (which assumes a gap on the middle candle) appear in modified form. Accept the gapless version rather than waiting for a structure that almost never prints.
Session liquidity varies enormously. A hammer forming during the London-New York overlap involves real participation. The same shape at 3am UK time on AUD/CAD may be one algorithm nudging a thin book. Same picture, entirely different information content.
Spreads widen around scheduled news, sometimes by a factor of five or more. A pattern that looks perfect on a mid-price chart may be untradeable once you account for the spread you’d actually pay at entry and exit.
And volume in spot forex is tick volume, which counts price changes rather than contracts traded. It correlates reasonably with real activity but it isn’t exchange volume. Use it as a relative measure against the same instrument’s recent history, never as an absolute.
One final trap: look-ahead bias. Scrolling back through historical charts hunting for patterns is nearly worthless as practice, because you already know what happened next and your brain quietly finds the patterns that worked.
The fix is mechanical. Use a replay function or cover the right side of the screen, advance candle by candle, and write down your decision before revealing the outcome. Painful. Also the fastest way to find out whether you can actually read price action or just recognise it in hindsight.
Confirming the Signal
Confirmation is the step that separates a chart observation from a trade. It costs you a little entry price and saves you a lot of stop-outs.
Confirmation by Candle Close
A pattern doesn’t exist until the candle closes. During formation, a hammer can become a bearish engulfing candle. A morning star’s third candle can reverse and close red.
Wait for the close on the pattern candle, then look for a follow-through close in the intended direction. For bullish engulfing, that means the next candle closing above the engulfing candle’s high. For a hammer, a close above the hammer’s high.
This is the single highest-value habit in candlestick trading.
Most false signals are patterns that were never patterns, entered by traders who couldn’t wait forty minutes.
Breakout and Volume Confirmation
The stronger version stacks a structural event on top of the close. Price takes out the most recent swing high, or breaks the descending trendline that defined the pullback, or reclaims a moving average it had been trading below.
Volume adds a second layer. A bullish reversal candle on volume 50% above its 20-period average signals genuine participation. The same shape on below-average volume signals a lack of sellers, which is not the same as the presence of buyers.
Trend confirmation across timeframes is the third layer, and we’ll get to how to do that efficiently in the next section.
Turning a Pattern Into a Trade Plan
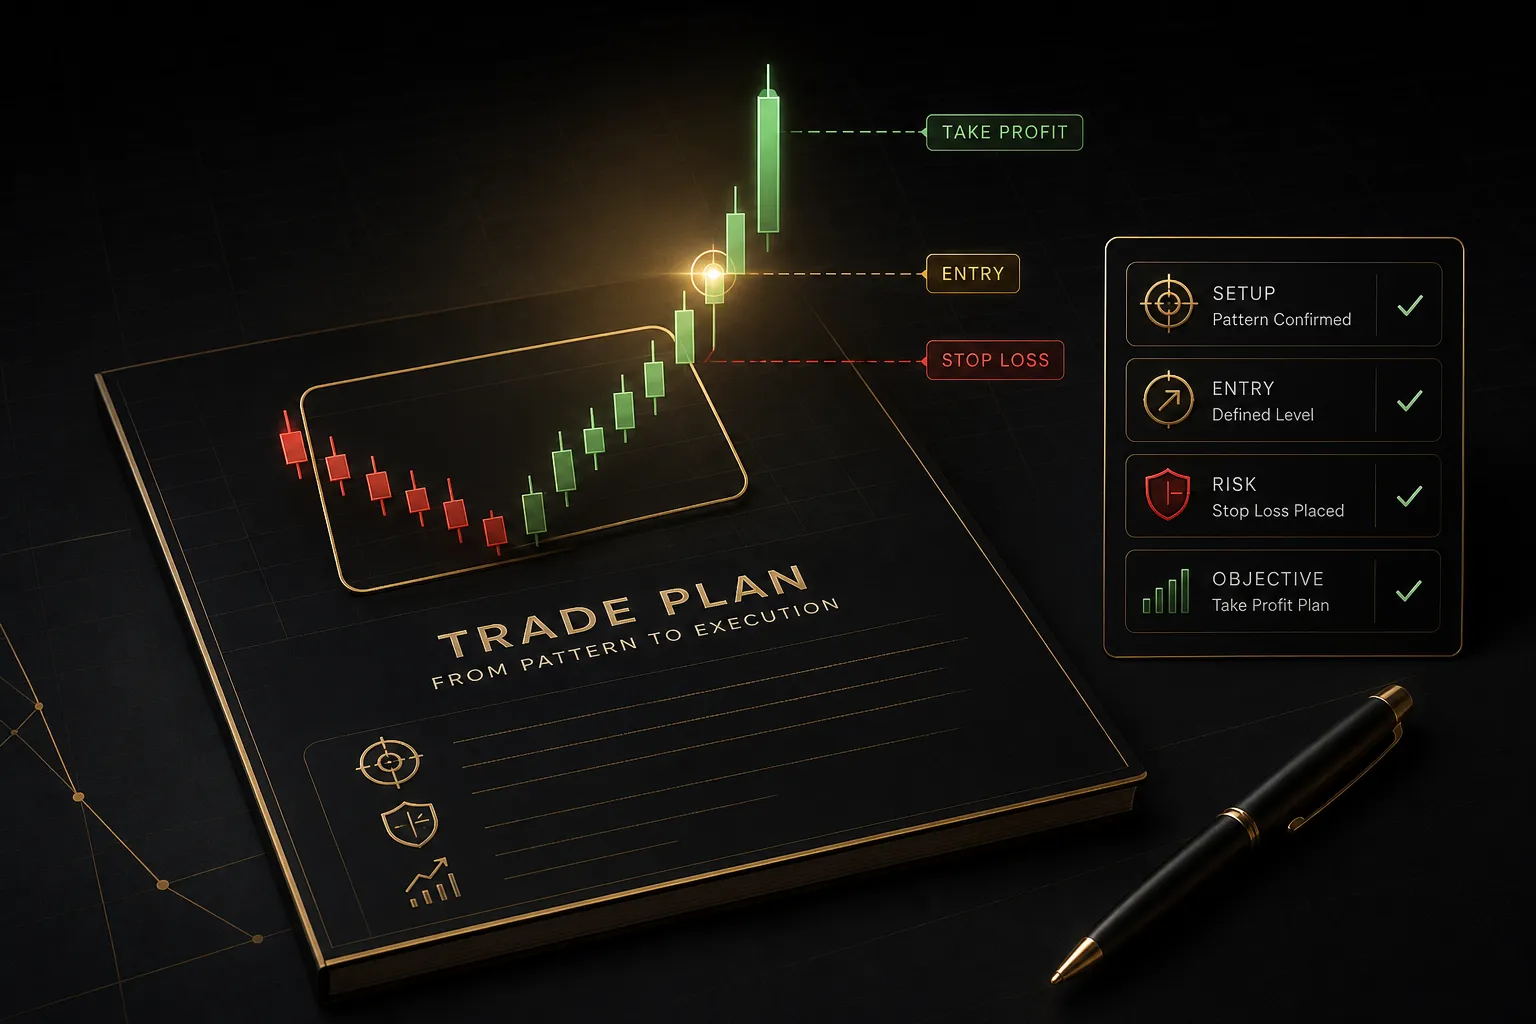
A pattern with no plan attached is entertainment. Here’s the sequence that turns identification into execution.
- Establish higher-timeframe direction first. Before looking at any candle, determine the trend on a timeframe at least four times higher than your entry chart. H4 setups get filtered by the Daily; 15-minute setups get filtered by H1 and H4. If the higher timeframe is in a confirmed downtrend, treat bullish patterns as counter-trend and halve your normal expectations.
- Mark your levels before hunting patterns. Draw support and resistance from swing highs and lows on the higher timeframe. Patterns that form at these levels get considered; patterns in open space get ignored. Doing this first prevents you from drawing levels to justify a pattern you’ve already fallen for.
- Verify the pattern against its measurement rules. Check the actual criteria: body engulfment for bullish engulfing, 2x wick ratio for a hammer, midpoint close for a morning star. If it fails a rule, it’s not the pattern. No “close enough.”
- Wait for the confirmation trigger and define it in advance. Write down the exact price that triggers entry, usually a close above the pattern candle’s high. Set an alert and walk away from the screen so you don’t talk yourself into an early fill.
- Define invalidation before entry. Identify the price at which the setup is objectively wrong. This is a level, not a dollar amount, and it exists whether or not you place a stop there.
- Size the position from risk, not conviction. Calculate lot size so that the distance to your stop equals a fixed percentage of the account, typically 0.5% to 1%. A wider stop means a smaller position. Conviction is not an input.
- Set a target with a measurable reward ratio. Use the next higher-timeframe structural level. If the distance to that level gives less than 1.5:1 against your stop, the setup fails on maths regardless of how good the candle looks.
- Log the trade with the reasoning attached. Record pattern type, location, confirmation used, timeframe alignment, and outcome. Fifty logged entries will tell you which patterns actually work for you, which is more useful than any general statistic.
Where to Place a Stop-Loss
Tucking a stop one pip below the pattern candle’s low is the most common and most expensive mistake in candlestick trading.
That price is obvious. Everyone can see it, which is exactly why price often trades through it briefly before moving in the intended direction. That’s a liquidity sweep, and it exists partly because retail stops cluster there.
Place the stop beyond the broader swing low instead, then add a volatility buffer. A practical formula: swing low minus 20% of the current ATR, plus the typical spread for that instrument and session. On a daily EUR/USD setup with a 90-pip ATR, that’s roughly 18 pips of buffer plus spread beyond the structural level.
Wider stops feel worse and perform better. The trade-off is position size, which is exactly the trade-off you want to be making.
Aligning Multiple Timeframes
The same bullish engulfing candle carries wildly different weight depending on where it appears. On a Daily chart it represents a full session of institutional participation. On a 5-minute chart it might represent one order.
Multi-timeframe alignment is the highest-value filter available, and it’s also where traders drown in charts. Flipping between eight timeframes manually, each with three indicators, produces confusion rather than clarity.
This is where a consolidated view helps. Tools like PipTrend’s multi-timeframe table and colour-coded trend candles display directional bias across 12 timeframes at once, so before acting on a bullish candle you can see in a single glance whether the M15 signal is fighting the H4 and Daily or riding with them. Same information, no tab-switching, no selective memory.
The rule that follows from it: take bullish patterns when the two timeframes above your entry chart agree. When they conflict, either skip the trade or reduce size and target the nearest level only.
Confluence beyond that should stay minimal. Trend structure, one momentum measure, one volume measure. Adding a fourth and fifth indicator doesn’t improve accuracy, it just guarantees that something always agrees with whatever you wanted to do.
Why Bullish Patterns Fail
Textbook patterns fail constantly. Understanding the specific failure modes is more useful than memorising more patterns, because the same handful of situations account for most losses.
Here’s where bullish setups break down:
- Fighting a strong higher-timeframe downtrend. A perfect hammer on H1 means very little when the Daily is making clean lower highs below a declining 50-period moving average. Counter-trend bullish patterns can produce sharp bounces, but they retrace faster and require far tighter management.
- Forming in low-liquidity sessions. Patterns printed during the Asian session on European or commodity crosses often involve minimal participation. The shape looks identical to a London-session pattern; the information behind it isn’t remotely comparable.
- Appearing after an extended rally. Three white soldiers on the tenth consecutive up day is exhaustion dressed as strength. Momentum that has already run typically produces poor risk-to-reward, because the nearest logical stop sits far below and the nearest resistance sits just above.
- Sitting directly beneath resistance. Buying a bullish engulfing candle 15 pips below a level that rejected price twice in the last month means your target is smaller than your risk before you even enter.
- Entering before the candle closes. The most avoidable failure of all. An unclosed candle is a hypothesis. Traders who enter mid-formation frequently buy hammers that finish as bearish candles, then blame the pattern.
- No volume expansion. Reversal patterns without a pickup in volume or tick volume have materially lower follow-through. Absence of sellers creates a shape; presence of buyers creates a move.
- Zero confluence. A pattern with no supporting evidence from structure, momentum, or level context is a coin flip with a spread attached. Costs alone turn coin flips into slow losses.
Frequently Asked Questions
What is the most reliable bullish candlestick pattern?
No single pattern is reliably the best in isolation, but bullish engulfing and morning star tend to show the most consistent follow-through because both require a decisive close that reverses prior selling.
Reliability comes from context, not shape. The same bullish engulfing candle at validated support with volume expansion and higher-timeframe alignment might work well over a large sample, while that identical candle mid-range against a Daily downtrend performs no better than random. Judge patterns on expectancy, which combines win rate and risk-to-reward, rather than accuracy alone.
How do you know if a candle is bullish?
A candle is bullish when its close is above its open, which is displayed as a green or hollow real body on most candlestick charts.
Beyond colour, assess quality. A long real body with a small upper wick shows buyers held control through the close. A tiny body with wicks on both sides is indecision, technically bullish and practically meaningless. Read the body-to-wick relationship, not just the colour.
What is the difference between a bullish candle and a bullish engulfing pattern?
A bullish candle is any single candle closing above its open. A bullish engulfing pattern is a two-candle structure where a bullish candle’s real body completely covers the previous bearish candle’s body, appearing after a decline.
The distinction matters because the pattern carries a specific claim: sellers controlled one period and buyers erased that entire move in the next. A standalone green candle makes no such claim about a shift in control.
How do you trade bullish candlestick patterns?
Trade them by establishing higher-timeframe trend first, marking key levels, waiting for the pattern candle to close, then entering only on a confirmation trigger such as a close above the pattern’s high.
Place your stop beyond the broader swing low with a volatility and spread buffer, not immediately under the candle. Size the position so the stop distance equals a fixed 0.5% to 1% account risk, and require at least 1.5:1 reward to the nearest higher-timeframe level before accepting the trade.
Do bullish candlestick patterns really work?
They work as probability filters, not as standalone predictive signals. Academic research on candlestick profitability is mixed, with several studies finding modest edges that shrink or disappear once transaction costs and realistic execution are included.
What consistently improves results is the surrounding framework: trend context, location at meaningful levels, confirmation on close, and disciplined risk management. The candle identifies a moment worth examining. Everything else determines whether examining it is profitable.
What confirms a bullish reversal?
A bullish reversal is confirmed when price closes above the pattern candle’s high, ideally with above-average volume and a break of the descending structure that defined the prior decline.
Stronger confirmation stacks additional evidence: a reclaimed moving average, a higher low forming after the pattern, and agreement from the two timeframes above your entry chart. One confirmation signal is a minimum. Three is a setup worth full size.
The One Rule to Trade By
If you take one thing from this guide, take this: never act on the pattern alone.
Wait for the candle to close. Require a confirmation trigger you defined in advance. And know your invalidation level before your order hits the market.
Three conditions, no exceptions, applied identically whether the setup looks obvious or marginal.
Candlestick shapes are probability tools. That’s the whole framing. Traders who treat them as certainties end up chasing every green candle on every timeframe, and the market bills them for it. Traders who treat them as one input inside a tested process compound slowly and stay in the game.
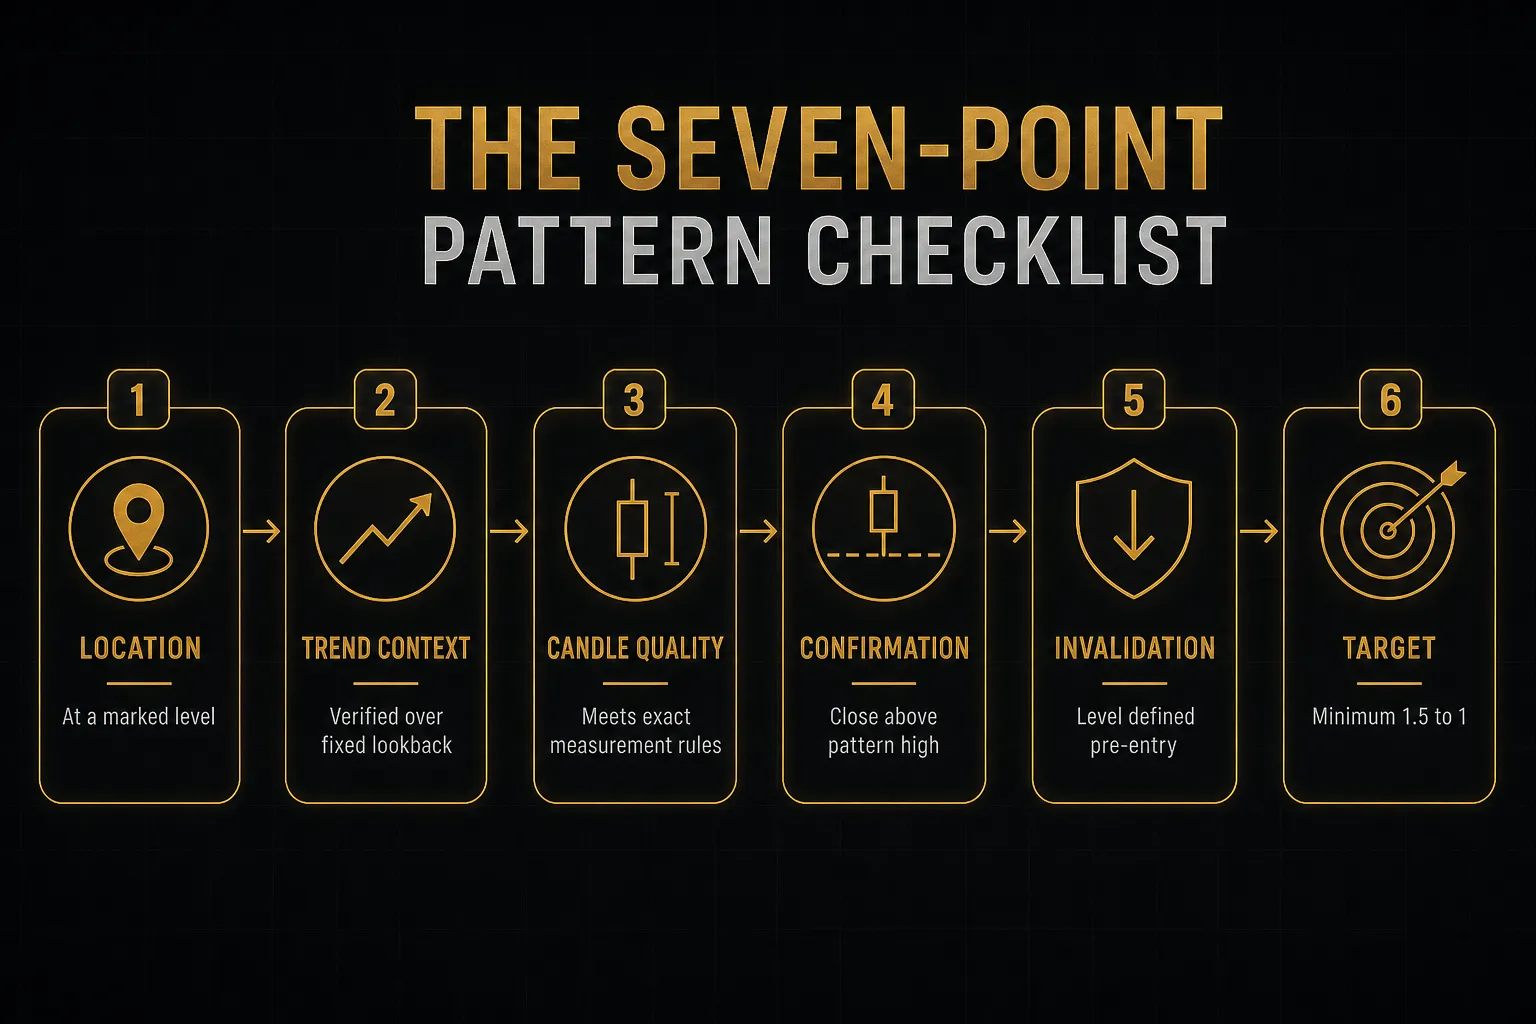
Here’s a practical exercise for this week. Pull up your watchlist, find the last ten bullish patterns that printed, and score each one against the seven-point checklist: location, trend context, candle quality, confirmation, invalidation, target ratio, position size.
You’ll likely find that most of them failed at least two criteria.
That’s not a discouraging result. That’s your filter, built from your own charts, ready before the next trade.
Sources
Risk Disclaimer: Trading involves risk. Past performance doesn't guarantee future results. Only trade with money you can afford to lose. PipTrend is a tool to assist your trading decisions, not financial advice.