Reading Candlestick Patterns Without the Guesswork
On this page
Why Candles Aren’t Magic Signals
A hammer appears on your chart. Your first instinct says buy.
That instinct is usually wrong.
Candlestick patterns are visual summaries of a battle between buyers and sellers over a fixed period.
Nothing more.
A Japanese candlestick chart compresses four data points, the open, high, low, and close, into a shape your eye can read in half a second.
What it does not do is predict the future.
The most damaging myth in retail trading is that a named pattern carries a fixed probability of success wherever it appears.
It doesn’t.
A bullish engulfing candle at major support after a three-day pullback and the same candle in the middle of a choppy range are two completely different events that happen to look identical.
This guide covers five things in order: how to read a single candle correctly, which core patterns actually matter, how context and confirmation turn a pattern into a trade decision, what the research says about profitability, and how to test your own rules.
Treat what follows as a decision process, not a signal list.
Patterns are one input.
The context around them does most of the work.
How to Read a Candlestick
Before you can read a pattern, you need to read one candle with total precision.
Most traders skip this and pay for it later.
Anatomy of Body and Wick
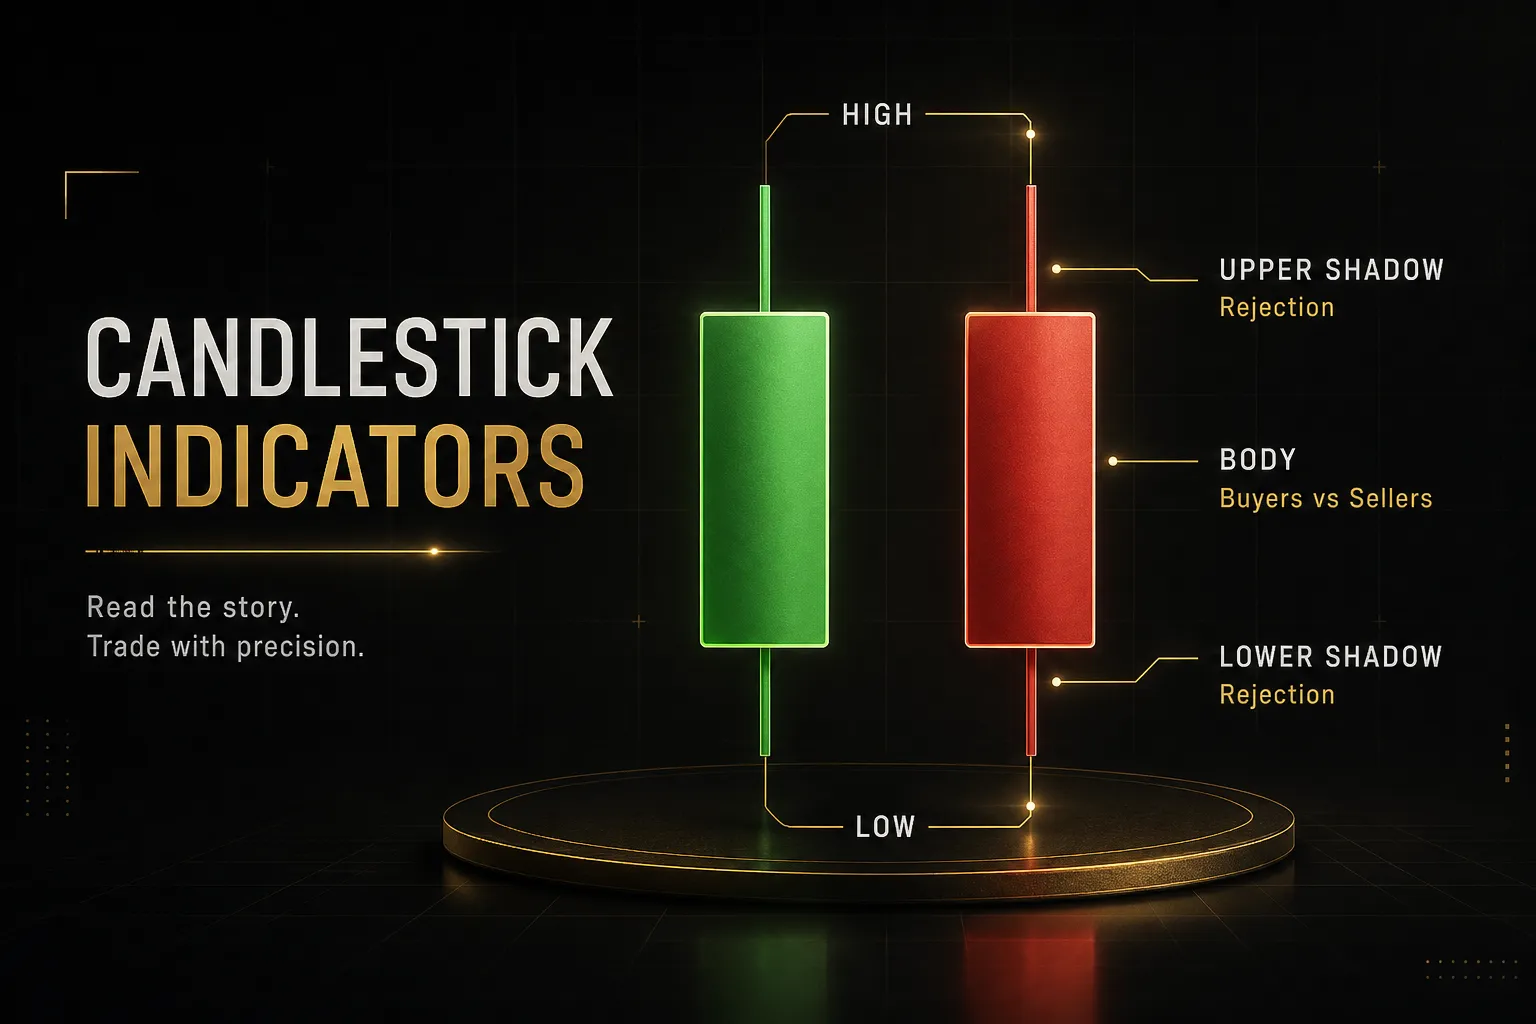
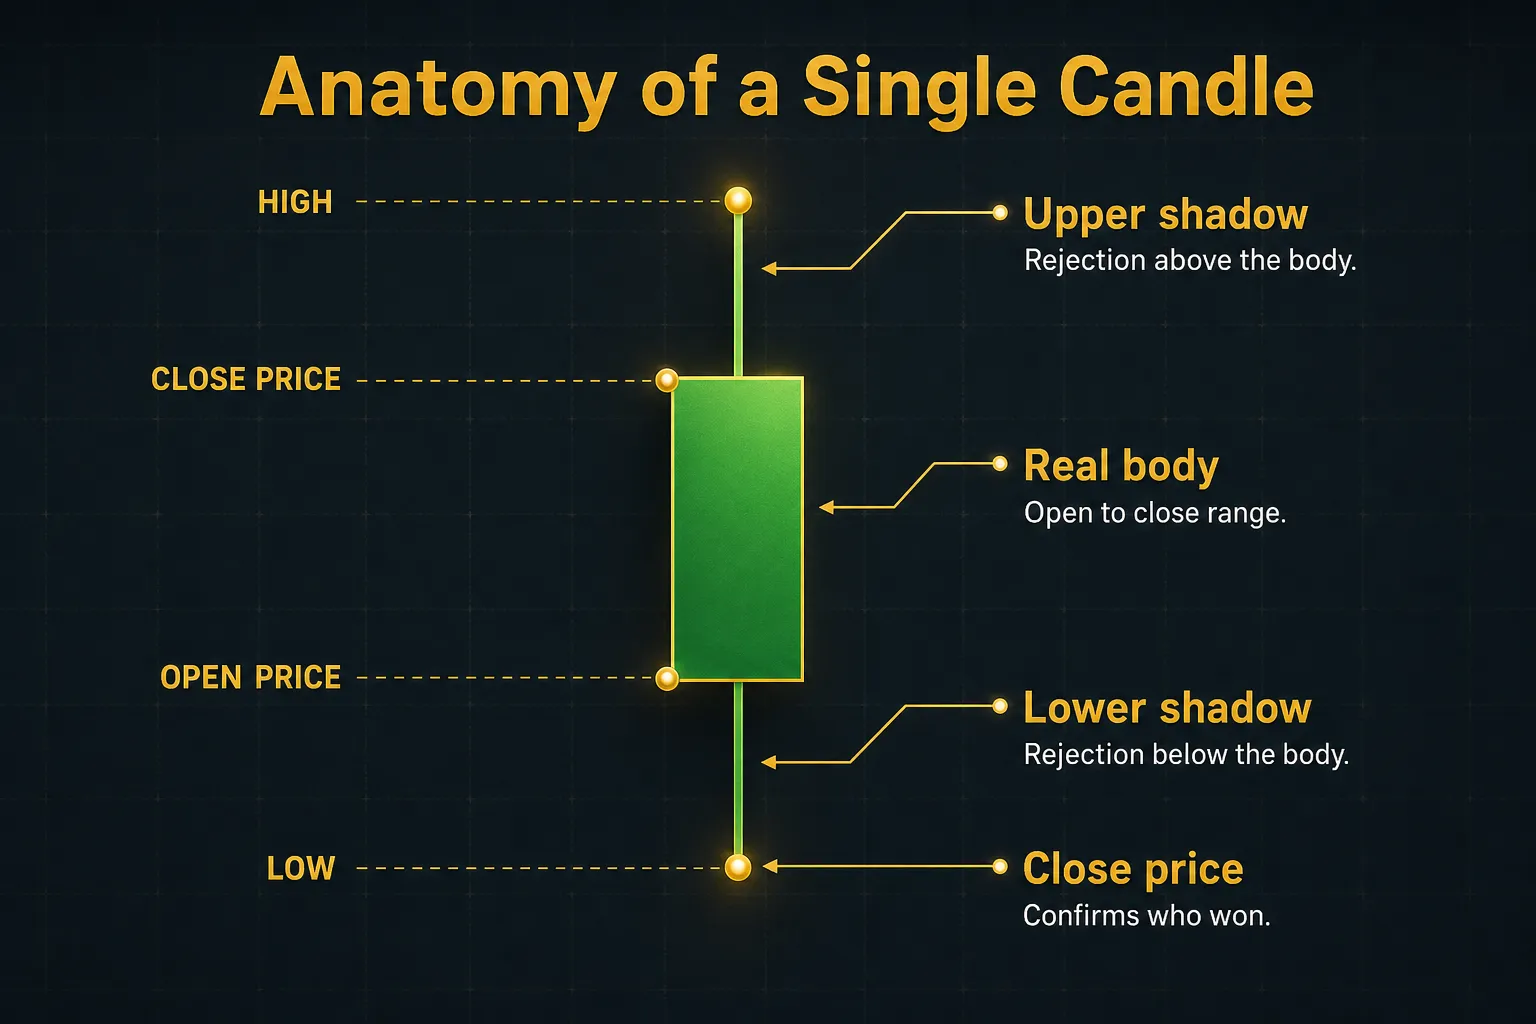
Every candle encodes four prices: the open, high, low and close of that period.
The rectangle between open and close is the real body.
The thin lines above and below are the upper and lower shadow, sometimes called wicks.
Body size tells you about conviction.
A long body means price moved decisively in one direction and finished near its extreme, so one side dominated the entire session.
A tiny body means the market ended roughly where it started after burning through time and orders, which is indecision.
Wicks tell a different story.
They mark rejection zones, places where price traveled and then got pushed back before the close. A long lower shadow means sellers drove price down, buyers absorbed the supply, and the level held.
That’s real information about where liquidity sits.
A long wick is not just a shape. It is the visible record of an order flow failure at a specific price.
Here is the practical rule that separates disciplined traders from the rest: a pattern is only valid once the candle closes.
An unfinished candle is a live negotiation, not a result.
A four-hour candle that looks like a perfect hammer with ninety minutes left can close as a bearish marubozu.
Acting on an incomplete candle manufactures false signals at scale. You are reading a story before the ending is written, then acting as if you know how it ends.
Bullish and Bearish, Defined
At the single-candle level, the definition is mechanical.
Bullish means the close sits above the open, so buyers finished in control of that period. Bearish means the close sits below the open.
Color is just a display convention.
Green and red, white and black, blue and orange, it makes no difference to the underlying data.
What matters is the relationship between open and close, and where that close sits relative to the candle’s full range.
A close in the top 20% of the range is meaningfully more bullish than a close barely above the open.
Both are technically bullish candles.
Only one shows sustained buying pressure into the period’s end.
That distinction matters more than most pattern names.
Multi-candle formations are built entirely from these relationships, so if you read individual candles loosely, every pattern conclusion you draw inherits the error.
The Core Patterns to Know
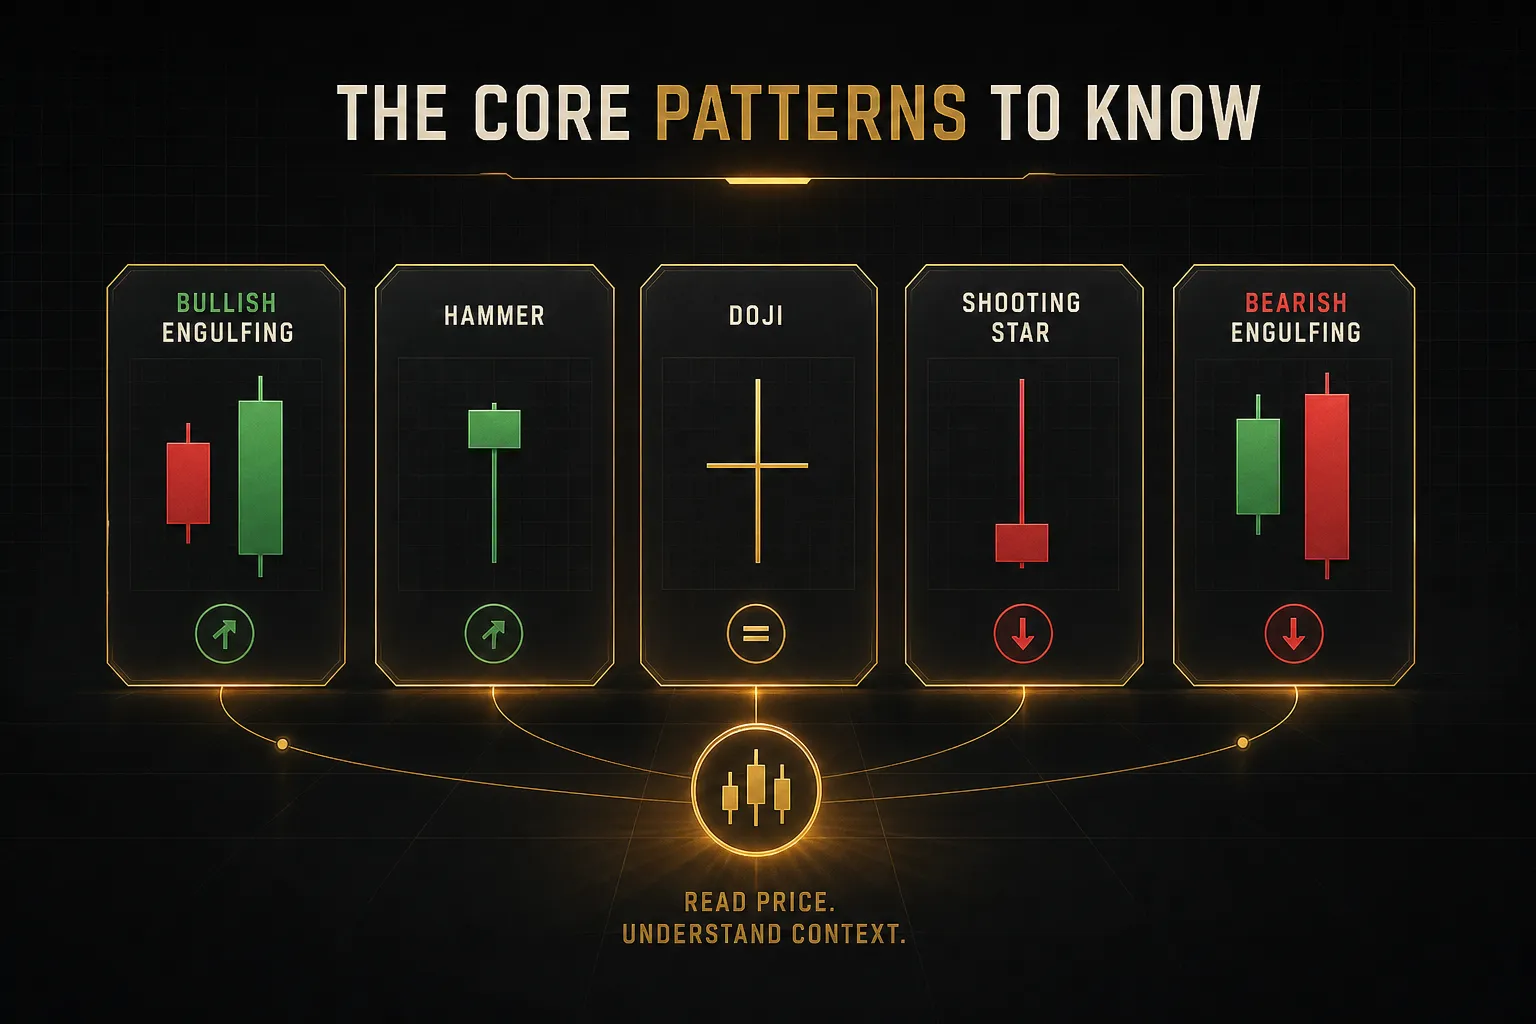
Pattern dictionaries list over a hundred formations.
You need six.
The rest are variations, and memorizing names without understanding the underlying price action logic produces traders who can label a chart but not trade it.
Group patterns by what they say about order flow instead of by name. There are five logical categories: rejection, absorption, indecision, momentum expansion, and multi-candle reversal.
Reversal Patterns
- Hammer (rejection at lows). A small real body near the top of the range with a lower shadow at least twice the body length and little to no upper shadow. Sellers pushed price down through the session and buyers reclaimed almost all of it before the close. This only qualifies as a reversal signal when it forms after a downward move, not in a sideways range.
- Shooting star (rejection at highs). The mirror image. Small body near the low of the range, upper shadow at least twice the body, minimal lower shadow, forming after an upward push. Buyers extended, failed to hold the gain, and the close landed back near the open.
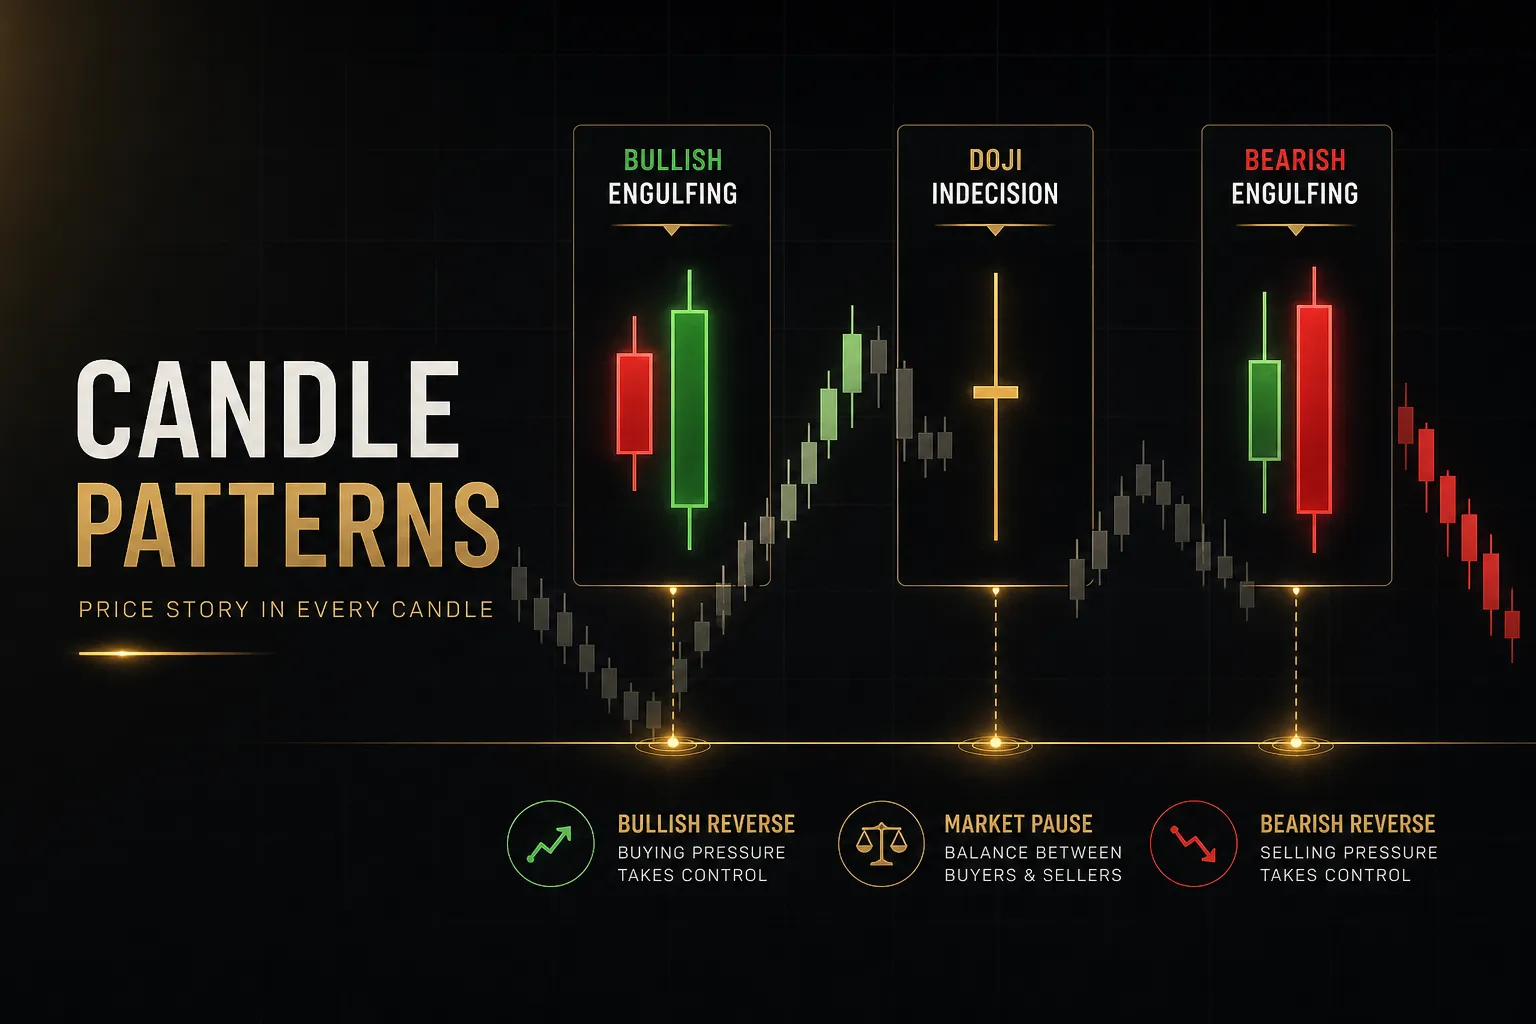
- Bullish engulfing (absorption of selling). A down candle followed by an up candle whose real body fully covers the prior body, from below the previous close to above the previous open. The strict definition uses bodies only, not wicks. A second candle that engulfs the entire prior range including shadows is stronger, but the body rule is the baseline.
- Bearish engulfing (absorption of buying). Same mechanics inverted: an up candle swallowed by a larger down body. What you are seeing is one session’s worth of buying getting completely reversed within the next period, which is a genuine shift in short-term control.
- Morning star (multi-candle bullish reversal). Three candles: a long bearish body, a small-bodied candle that stalls (gapping down in gap-prone markets), then a bullish candle that closes well into the first candle’s body, ideally past its midpoint. The middle candle is the transition from selling pressure to balance.
- Evening star (multi-candle bearish reversal). Long bullish candle, small indecision candle, then a bearish candle closing deep into the first body. Both star patterns are more reliable than single-candle signals because they show a full three-stage handoff rather than one session’s noise.
Continuation and Indecision Signals
- Doji (pure indecision). Open and close are effectively equal. A workable objective rule: the body must be less than 5% of the total candle range. Anything looser and you are calling ordinary small-bodied candles doji, which floods your chart with meaningless signals. A doji at the top of an extended trend is worth attention; a doji mid-range is noise.
- Spinning top (weak indecision). Small body with visible shadows on both sides, typically a body under about 30% of the range. It signals a balance of pressure rather than an outright reversal, and it often precedes a continuation once the pause resolves.
- Marubozu (momentum expansion). A candle with a large body and virtually no shadows, closing at or extremely near its extreme. This is the cleanest continuation pattern in the set. It says one side controlled the period start to finish, and it often appears on breakout confirmation candles.
One market-specific warning.
Textbook definitions of star patterns and several others assume price gaps between sessions, which is normal in stocks and exchange-traded futures where the market closes overnight.
Spot forex trades nearly 24 hours across five days and rarely gaps except over the weekend.
Crypto essentially never gaps.
Apply strict gap requirements in those markets and you will find almost no valid patterns, so most forex traders use the body-overlap version of these formations instead.
Start with five or six patterns: hammer, shooting star, bullish engulfing, bearish engulfing, doji, and marubozu. Learn where they work and where they fail before adding anything else.
From Candle to Trade Decision
Here is the uncomfortable truth about pattern trading.
The candle is maybe 20% of the decision.
Everything else, location, trend, confirmation, invalidation, and size, does the remaining 80%.
Why Location and Trend Matter
Take one hammer and place it in four different spots.
At a well-tested support level after a pullback inside an uptrend, it is a high-quality continuation entry: the trend is up, price retraced to demand, sellers failed.
That is a coherent story.
Move the same hammer to the middle of a range with no structure nearby. Now it means almost nothing, because the rejection happened at a price no one was defending.
There’s no reason for buyers to keep showing up there.
Put it directly beneath overhead resistance and it becomes a trap.
You would be buying into supply, with the nearest logical target only a few points away and the risk of a false breakout reversal high.
Now place it after an extended, near-vertical downtrend into a level that has held twice before.
That’s the highest-conviction version, because exhaustion plus structure plus rejection all align.
Same candle.
Four different trades.
Location within market structure determines the meaning of the pattern, not the pattern itself.
This is where multi-timeframe analysis earns its keep.
Use a higher timeframe (daily or H4) to establish directional bias and mark support and resistance. Then drop to a lower timeframe (H1 or M15) to time the entry with a candle signal.
Taking bullish patterns while the higher timeframe trend is clearly down is how most beginners bleed capital.
The signal might be textbook.
It’s still fighting the dominant flow.
Confirmation Before You Enter
The pattern is not the trade.
The full decision chain has five links, and skipping any one of them turns a process into a guess.
- Signal candle. A closed candle matching your defined pattern rules, appearing at a location you marked in advance.
- Confirmation. The next candle closing in the signal’s direction, or price closing beyond a structural level. This filters out a large share of the patterns that look right and immediately fail.
- Entry trigger. A specific price where you act: a break of the signal candle’s high, a retest of the level, or the close of the confirming candle. Defined before entry, not improvised.
- Invalidation and stop-loss placement. The price that proves the idea wrong, usually beyond the wick of the signal candle or past the structural level. If you cannot state it, you do not have a trade.
- Management. Predefined targets, partial exits, and a rule for when you move the stop. Decided before emotion enters the picture.
Volume confirmation deserves a specific caveat in forex.
Spot forex has no centralized exchange volume.
What your platform shows is tick volume, a count of price updates, which correlates with activity but is not traded contract volume.
Useful alternatives exist.
Watch for range expansion (measured by average true range) on the signal candle, check whether the pattern formed during an active session overlap rather than a dead Asian-session hour, and reference CME currency futures volume if you need real volume data. In stocks and futures, standard volume confirmation applies normally.
Before every entry, run a six-point checklist:
- Trend alignment: does the higher timeframe support this direction?
- Location: is the pattern at a level that matters, or in empty space?
- Confirmation: has a following candle or level break confirmed it?
- Risk-to-reward ratio: is there at least 2:1 to a realistic target, with no opposing level in the way?
- Scheduled news: is a high-impact release due within the next hour?
- Invalidation: is the stop placed at a level that genuinely disproves the setup?
Where an Indicator Adds Confirmation
Manually checking trend across four timeframes on twenty pairs takes time most traders don’t have.
This is where a structured confirmation tool earns its place, as a second opinion rather than a replacement for judgment.
A system like PipTrend’s color-coded trend detection gives an immediate read on whether higher timeframe direction agrees with your candle signal.
Its multi-timeframe confirmation table answers the alignment question in one glance instead of five chart switches.
Its precision entry zones, built from VWAP, supply and demand areas, and session highs and lows, flag whether your pattern formed at a location that actually carries significance.
That is a confirmation layer.
It tells you when trend and location agree with what the candle is showing, and it makes disagreement obvious.
It does not read price action for you, and no tool should be treated as a trade trigger on its own.
The same principle applies to any momentum indicator, moving average, or relative strength index reading you layer on top.
They add or subtract confidence.
They do not manufacture edge where the context is bad.
Finally, know when to stand aside.
Patterns fail disproportionately in three conditions: thin liquidity periods like the Friday close or holiday sessions, when spread and slippage widen enough to eat a meaningful chunk of a small target, and during news-driven volatility that spikes price directly into a nearby opposing level.
A perfect engulfing candle two minutes before a central bank decision is not a setup.
It’s a coin flip with worse odds.
Do Candlestick Patterns Really Work?
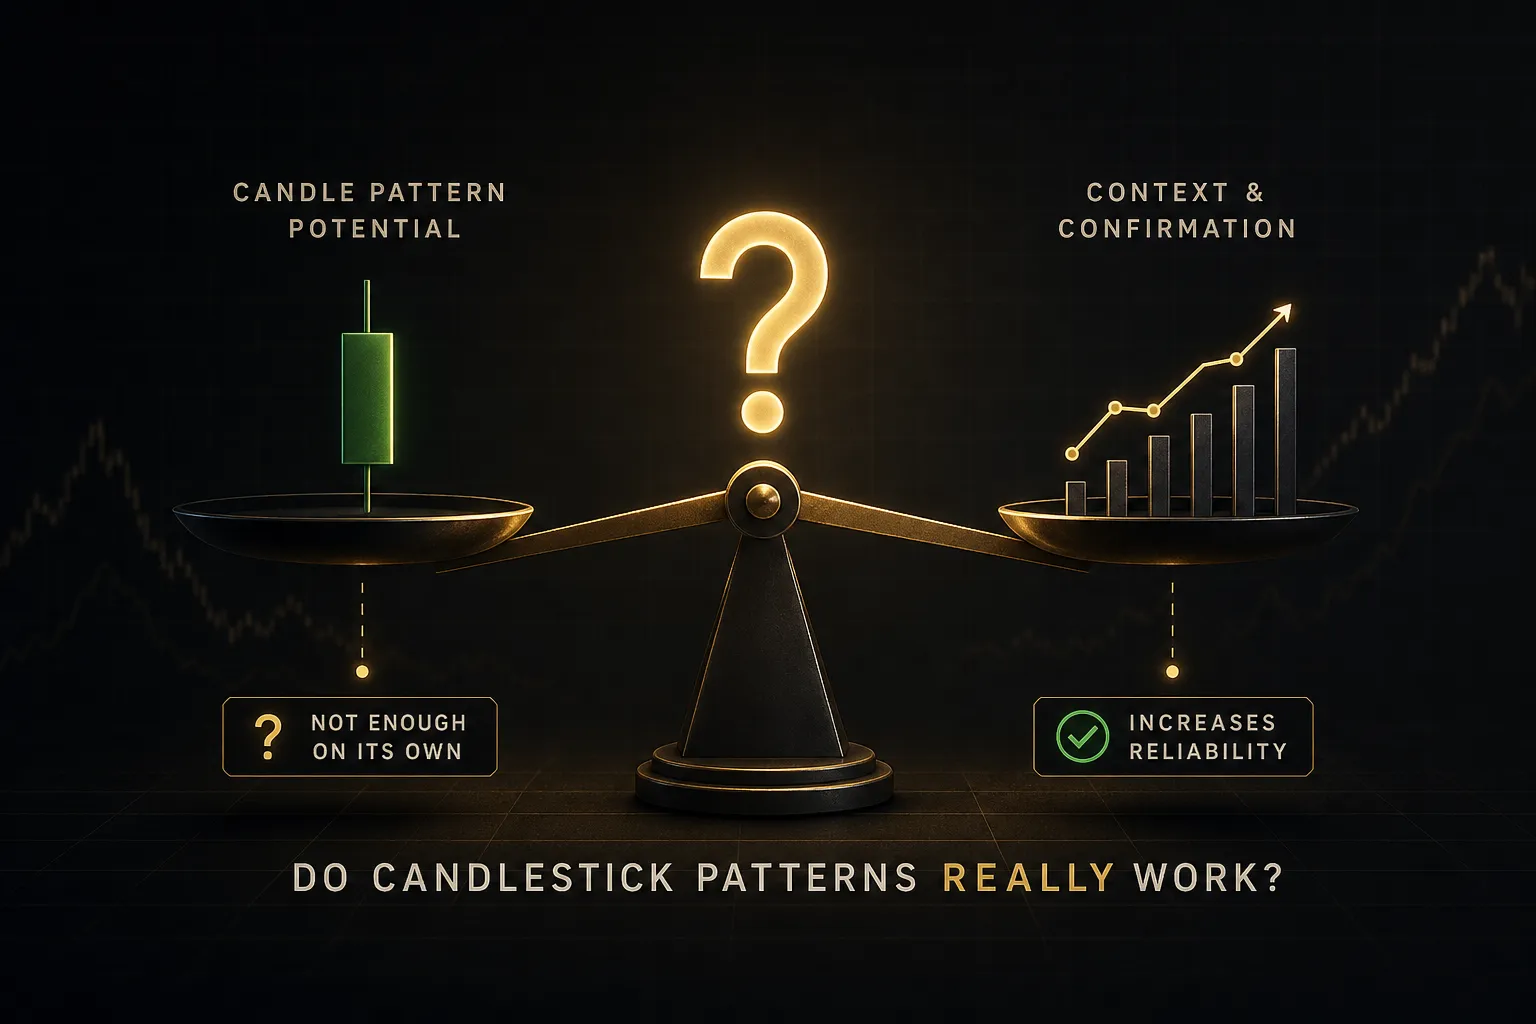
This is where honest analysis diverges sharply from the marketing you find in most trading courses.
What the Evidence Actually Shows
The academic picture is genuinely mixed, and anyone claiming otherwise is selling something. Several studies have found conditional usefulness: certain patterns show statistically detectable predictive value in specific markets, during specific volatility regimes, or when combined with trend filters and volume screens.
Other research reaches the opposite conclusion.
Studies applying strict standalone candlestick rules to liquid markets have repeatedly found that returns fail to beat a buy-and-hold benchmark once transaction costs, spreads, and slippage are subtracted.
Results that looked promising in raw price data disappeared under realistic execution assumptions.
Both findings can be true, and that’s the actual lesson.
Reliability is conditional, not intrinsic.
There is no fixed hit rate attached to a bullish engulfing candle that holds across every instrument, timeframe, and market condition.
Ask “does this pattern work in this market, on this timeframe, at this kind of location, after costs?” That question has an answer. “Which pattern is most accurate?” does not.
The other consistent finding: pattern performance degrades on very low timeframes.
On M1 and M5 charts, spread and noise consume a large fraction of the typical move, so a pattern needs a far higher raw win rate just to break even.
On H4 and daily charts, signals are fewer but each one carries more information and a better cost-to-move ratio.
Backtesting Your Own Rules
Stop asking whether candlestick patterns work in general.
Test whether your specific rules work on your specific market.
Proper candlestick backtesting requires six components:
- Fixed entry definition. Written rules precise enough that two people scanning the same chart mark identical signals. “Body engulfs prior body and closes in the upper third of its range” qualifies. “Looks like a strong reversal” does not.
- Defined holding period or exit logic. Either a fixed number of bars or explicit stop and target levels. Discretionary exits make results untestable.
- Realistic cost assumptions. Include the typical spread for your instrument and session, commission, and a slippage allowance. This single step invalidates most low-timeframe strategies.
- A benchmark. Compare against buy-and-hold or a simple trend-following rule. Being profitable is not the same as being better than the boring alternative.
- Sufficient sample size. Thirty trades tells you nothing. Aim for at least 100 occurrences, spread across trending and ranging conditions.
- Out-of-sample testing. Build rules on one period, verify on a period you never looked at. Skip this and you have curve-fitted history, not an edge.
Market-specific notes matter too.
In stocks, overnight gaps are routine and earnings dates distort everything, so daily patterns often need gap-aware definitions. In forex, session structure dominates: a pattern forming during the London-New York overlap has very different follow-through than the same shape at 3am in a thin Asian session.
In crypto, continuous 24/7 trading eliminates gaps entirely, and volatility can be three to five times higher than major currency pairs, so stops calibrated with average true range are essential rather than optional. In futures, real centralized volume is available, making volume confirmation genuinely reliable, though contract rollovers create artificial price discontinuities you must handle in your data.
Common Candlestick Questions
What Are the 5 Most Powerful Candlestick Patterns?
The five most practically useful patterns are the hammer, shooting star, bullish engulfing, bearish engulfing, and doji. These cover the three core price-action situations: rejection at a level, absorption of the opposing side, and indecision.
“Powerful” is misleading, though.
Any of these produces poor results when it appears mid-range with no structure nearby and no confirming candle behind it.
Which Candlestick Pattern Is the Most Accurate?
No pattern holds a fixed accuracy rate across markets and timeframes. Studies that measure the same pattern on different instruments and periods produce different results, which tells you accuracy is a property of the context, not the shape.
Multi-candle patterns like the morning star and evening star tend to be more dependable than single candles, simply because they require three periods of confirming behavior rather than one.
How Do Beginners Read Candlestick Patterns?
Start by reading single candles correctly before touching multi-candle formations. Learn what the open, high, low, and close mean, what body size says about conviction, and what long shadows say about rejection.
Then pick five patterns, mark support and resistance levels on your chart first, and only look for those patterns at those levels.
Location before pattern, every time.
Are Candlestick Patterns Profitable?
Candlestick patterns are not reliably profitable as standalone signals after trading costs. Multiple studies have found that isolated pattern rules fail to beat simple benchmarks once spreads and slippage are included.
They become useful as a confirmation layer inside a complete system with trend alignment, defined invalidation, and disciplined position sizing.
The edge lives in the framework, not the candle.
What Is the Best Timeframe for Candlestick Patterns?
H4 and daily charts generally produce the most reliable candlestick signals. Higher timeframes generate fewer setups, but each candle represents far more traded activity and the resulting moves are large relative to spread.
M1 and M5 charts produce many more patterns, most of them noise. On those timeframes, transaction costs frequently exceed the average edge.
How Do You Know If a Candlestick Pattern Is Strong?
Strength comes from three factors: location at a meaningful level, a decisive close (in the upper or lower third of the candle’s range), and expanded range or volume compared to recent candles.
The pattern’s name contributes nothing to its strength.
Add a fourth filter: alignment with the higher timeframe trend.
A signal that satisfies all four is worth risking capital on.
One that satisfies only the shape is not.
One Candle Isn’t a Trade Plan
The framework fits in five steps.
Identify the pattern from a closed candle using strict rules. Check its location against market structure and higher timeframe trend.
Wait for confirmation.
Define the invalidation level.
Then size the position so that being wrong costs a fixed, survivable percentage of your account.
Patterns are a confirmation layer.
They work alongside trend, structure, and momentum context, and they fall apart when used as a lone trigger at a random price.
That’s not a limitation of candlestick analysis.
It’s how every legitimate technical method works.
Your next step is specific.
Pick one pattern, just one, and manually mark every occurrence on a demo chart for two weeks.
Log the location, whether confirmation followed, and what happened over the next five candles.
Two weeks of that will teach you more than two hundred pattern diagrams.
Sources
Risk Disclaimer: Trading involves risk. Past performance doesn't guarantee future results. Only trade with money you can afford to lose. PipTrend is a tool to assist your trading decisions, not financial advice.