
In the fast-changing landscape of 2026, traders face relentless competition and rapidly shifting market dynamics. Every advantage counts, and understanding the tools that decode market direction is more vital than ever.
One such tool is the accum dist indicator, a volume-based signal that helps reveal the true flow of money behind price moves. This guide will break down how it works, show you how to calculate it, and provide actionable strategies for using it in today's complex markets.
Ready to unlock deeper market insight? Read on to discover how the accum dist indicator can transform your trading decisions.
Understanding the Accumulation/Distribution (Accum Dist) Indicator
In modern trading, understanding volume and price movement is crucial. The accum dist indicator stands out as a valuable tool for traders seeking an edge in trend analysis. To use it effectively, you need to know what it is, how it is calculated, and how to interpret its signals in real-world markets.
What Is the Accum Dist Indicator?
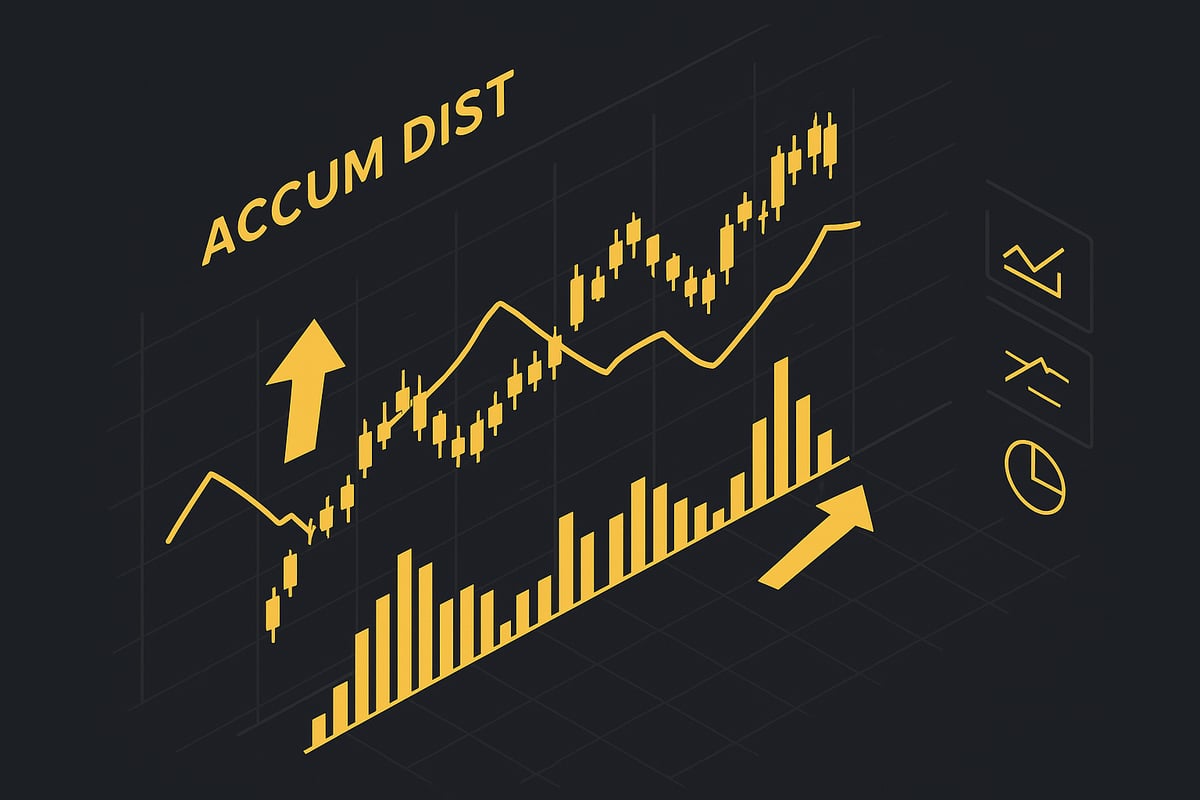
The accum dist indicator is a volume-based technical analysis tool that measures the cumulative flow of money into and out of a security. Its main purpose is to help traders identify whether a stock, ETF, or other asset is being accumulated (bought) or distributed (sold) over time.
Developed by Marc Chaikin, this indicator was designed to improve on basic volume tools by considering both price and volume. The accum dist indicator plays a vital role in confirming trends and spotting divergences, which can signal potential reversals or continuations.
When price rises but the accum dist indicator falls, it may suggest underlying weakness, indicating that buyers are not fully supporting the move. This insight is key: volume and price relationships are often more predictive than price alone. According to industry studies, both institutional and retail traders frequently use the accum dist indicator for trend confirmation. To see how it compares with other tools, you can refer to this Technical trading indicators guide.
The Accum Dist Formula Explained
The accum dist indicator uses a straightforward yet powerful formula. The main calculation is:
AD = Previous AD + Money Flow Volume
Money Flow Volume = Money Flow Multiplier × Volume
The Money Flow Multiplier ranges from -1 to +1, depending on where the closing price sits within the period's high and low range. If the close is near the high, the multiplier is closer to +1, signaling accumulation. If the close is near the low, the multiplier approaches -1, indicating distribution.
To calculate the accum dist indicator for each period:
- Find the Money Flow Multiplier:
(Close - Low) - (High - Close) / (High - Low) - Multiply this value by the period's volume.
- Add the result to the previous period's AD value.
For example, if a stock closes near its high on high volume, the accum dist indicator will rise, showing buying pressure. Its cumulative nature means even small positive multipliers, when sustained, reveal steady accumulation. This aligns with the way many financial platforms and analysts explain the indicator, emphasizing its ongoing tracking of buying and selling pressure.
How the Accum Dist Indicator Works in Practice
Interpreting the accum dist indicator is straightforward but powerful. A rising line signals accumulation, while a falling line shows distribution. If the price is climbing but the accum dist indicator is flat or declining, this divergence may warn of a weakening trend.
Bullish and bearish divergences are especially valuable. For instance, if the price forms higher highs but the accum dist indicator forms lower highs, it could signal a reversal. Conversely, if the price drops but the accum dist indicator rises, buyers may be stepping in.
The accum dist indicator is flexible and works on daily, weekly, and even intraday charts. It is used across stocks, ETFs, forex, and crypto markets. For example, a crypto asset with a strong price rally but a flat accum dist indicator may be losing momentum, alerting traders to potential risk.
The cumulative approach of the accum dist indicator provides deeper insights than single-period volume spikes. According to CFI, this indicator is often compared to On-Balance Volume but offers more nuanced signals due to its consideration of price location within the range. This makes it a preferred choice for traders looking to confirm breakout strength and spot subtle shifts in market sentiment.
Step-by-Step Guide: How to Use the Accum Dist Indicator in 2026 Markets
Mastering the accum dist indicator in modern markets requires a systematic approach. In this guide, you will learn how to set up, interpret, and act on signals with confidence. By following these actionable steps, you can harness the full predictive power of the accum dist indicator for your trading decisions.

Step 1: Setting Up the Accum Dist Indicator
First, ensure your trading platform supports the accum dist indicator. Most leading platforms, such as TradingView and MetaTrader, provide this indicator natively. To add it, simply open your preferred chart, locate the indicator library, and search for "Accumulation/Distribution" or "Accum Dist."
Next, apply the indicator to your chosen asset. By default, settings are optimized for most markets. However, you can fine-tune parameters, such as the calculation period, to suit your trading style. For instance, adjusting the timeframe to match your strategy can reveal more precise accumulation or distribution signals.
Suppose you are analyzing a crypto asset. Add the accum dist indicator to your chart to view real-time shifts in buying and selling pressure. For a detailed walkthrough on platform setup, explore TradingView indicators for analysis, which explains how to integrate and customize these tools.
Combine the accum dist indicator with other technical signals for robust confirmation. This dual approach helps filter out noise and increases your confidence in signal reliability.
Step 2: Reading Accumulation and Distribution Signals
Interpreting the accum dist indicator is straightforward. When the AD line trends upward, it signals accumulation, suggesting sustained buying interest. Conversely, a downward-trending AD line signals distribution, indicating increasing selling pressure.
A flat or sideways AD movement often reflects market indecision or consolidation. In such cases, wait for a clear breakout in either price or indicator direction before acting. For example, a bullish scenario emerges when both the price and the accum dist indicator rise together, confirming strong momentum.
Always look for alignment between price action and the AD line. This confirmation reduces the odds of false signals. Research shows that divergences between price and the accum dist indicator frequently precede significant market reversals, highlighting its predictive value.
Step 3: Spotting Bullish and Bearish Divergences
Detecting divergences is a core strength of the accum dist indicator. A bullish divergence occurs when price forms lower lows, but the AD line forms higher lows. This pattern can signal a potential reversal from a downtrend to an uptrend.
Conversely, a bearish divergence appears when price sets higher highs, while the AD line prints lower highs. This warns of waning buying pressure and a possible trend reversal. To spot divergences, compare recent swing highs and lows in both price and the accum dist indicator.
For example, imagine a stock making new lows, but the AD line remains flat or rises. This could indicate underlying accumulation and a coming bullish move. Divergences are most reliable in high-volume environments, so set alerts to catch these signals in real time.
Step 4: Integrating Accum Dist with Other Technical Tools
To maximize the utility of the accum dist indicator, integrate it with additional technical tools. Pairing the AD line with moving averages provides valuable trend confirmation. For momentum analysis, combine the accum dist indicator with RSI or MACD.
Consider this example: when the AD line rises alongside price above a key moving average, and RSI confirms strength, the probability of a sustained trend increases. Using the accum dist indicator with support and resistance levels further refines entry and exit points.
A multi-indicator approach helps reduce false positives, as signals from several tools are more reliable than one alone. Many traders report higher consistency when using combined systems, especially in dynamic markets.
Step 5: Executing Trades Based on Accum Dist Insights
Once you have clear signals from the accum dist indicator, execute trades with precision. Enter long positions on confirmed accumulation, and consider short trades or exits during sustained distribution phases.
Position sizing should reflect the strength and clarity of the AD trend. Set stop-loss and take-profit levels based on recent price structure and indicator signals to manage risk effectively. For instance, if the accum dist indicator confirms a breakout, place your stop below the last swing low.
Before trading live, always backtest your strategy using historical data. This step ensures that your approach with the accum dist indicator is robust and adaptable to different market conditions.
Advanced Strategies for the Accum Dist Indicator in 2026
In 2026, advanced trading environments demand more from every technical tool. The accum dist indicator remains essential, but traders must adapt their approach to keep pace with evolving markets and technology. Let us dive into tactical strategies that maximize the power of the accum dist indicator in today's dynamic landscape.

Adapting to Algorithmic and High-Frequency Trading Environments
Algorithmic and high-frequency trading have redefined market volume patterns. The accum dist indicator helps traders cut through noise by focusing on sustained money flow rather than isolated volume spikes. For example, when “spoofing” occurs, short-term volume anomalies may appear, but the accum dist indicator’s cumulative approach filters out these distractions.
To adapt, monitor the indicator for genuine accumulation and distribution trends, not just temporary surges. With over 70 percent of equity volume now algorithm-driven, the accum dist indicator offers a reliable way to distinguish real institutional moves from fleeting algorithmic activity. This long-term perspective is crucial for traders who want to avoid false signals created by high-frequency trades.
Using Accum Dist in Multi-Timeframe Analysis
Incorporating the accum dist indicator across multiple timeframes provides a clearer market picture. By checking weekly, daily, and intraday charts, traders can spot long-term accumulation even if short-term distribution is present. This layered approach helps identify when a security is experiencing deep institutional interest versus short-term profit-taking.
For instance, a weekly uptrend in the accum dist indicator paired with a daily pullback may signal a temporary correction within a strong bullish context. Aligning signals across timeframes increases the probability of accurate entries and exits. Always ensure the accum dist indicator is part of your multi-timeframe workflow to capture both big-picture trends and tactical opportunities.
Accum Dist in Crypto, Forex, and Non-Equity Markets
The accum dist indicator is not limited to stocks. Its cumulative nature makes it effective in 24/7 markets like crypto and forex, where volume dynamics differ from equities. In crypto, for example, sustained uptrends in the accum dist indicator often validate bull runs, even when price action alone seems uncertain.
Forex traders also benefit, especially when volume data is aggregated from multiple sources. The accum dist indicator can highlight hidden accumulation before major breakouts. Its adaptability across asset classes ensures traders can rely on it for spotting smart money movements, regardless of market type or trading session.
Combining Accum Dist with AI-Powered Trading Tools
AI-powered trading tools are reshaping technical analysis. By integrating real-time AI alerts with the accum dist indicator, traders can filter and validate signals more efficiently. AI systems scan for divergences, confirm accumulation or distribution, and reduce human error in fast-moving markets.
For example, AI can alert you when the accum dist indicator’s trend aligns with other technical indicators, such as MACD or RSI, increasing trade confidence. Studies on the best combination of indicators for U.S. stock market highlight that blending traditional and AI-driven methods can lead to more robust strategies. As AI adoption in trading has grown by 40 percent since 2023, leveraging these tools with the accum dist indicator is a game changer for consistency.
AI-Powered Trading with PipTrend: Enhancing Accum Dist Strategies
PipTrend empowers traders with an AI-driven trading indicator that delivers real-time, actionable buy and sell signals for forex, crypto, stocks, and indices. Seamless TradingView integration allows users to overlay the accum dist indicator with AI-based alerts, streamlining multi-timeframe analysis and confirming accumulation or distribution patterns.
Automatic trend detection and customizable alerts take the guesswork out of trading. Whether you are a beginner or a seasoned trader, PipTrend ensures your accum dist indicator strategies are both effective and easy to manage. With round-the-clock expert support and a vibrant trading community, mastering advanced techniques becomes accessible for everyone.
Comparing Accum Dist Indicator to Other Volume-Based Tools
Navigating the world of volume-based technical analysis means understanding how the accum dist indicator stacks up against other popular tools. Each indicator offers unique insights, and knowing their distinctions can help traders make more informed decisions in dynamic 2026 markets.
Accum Dist vs. On-Balance Volume (OBV)
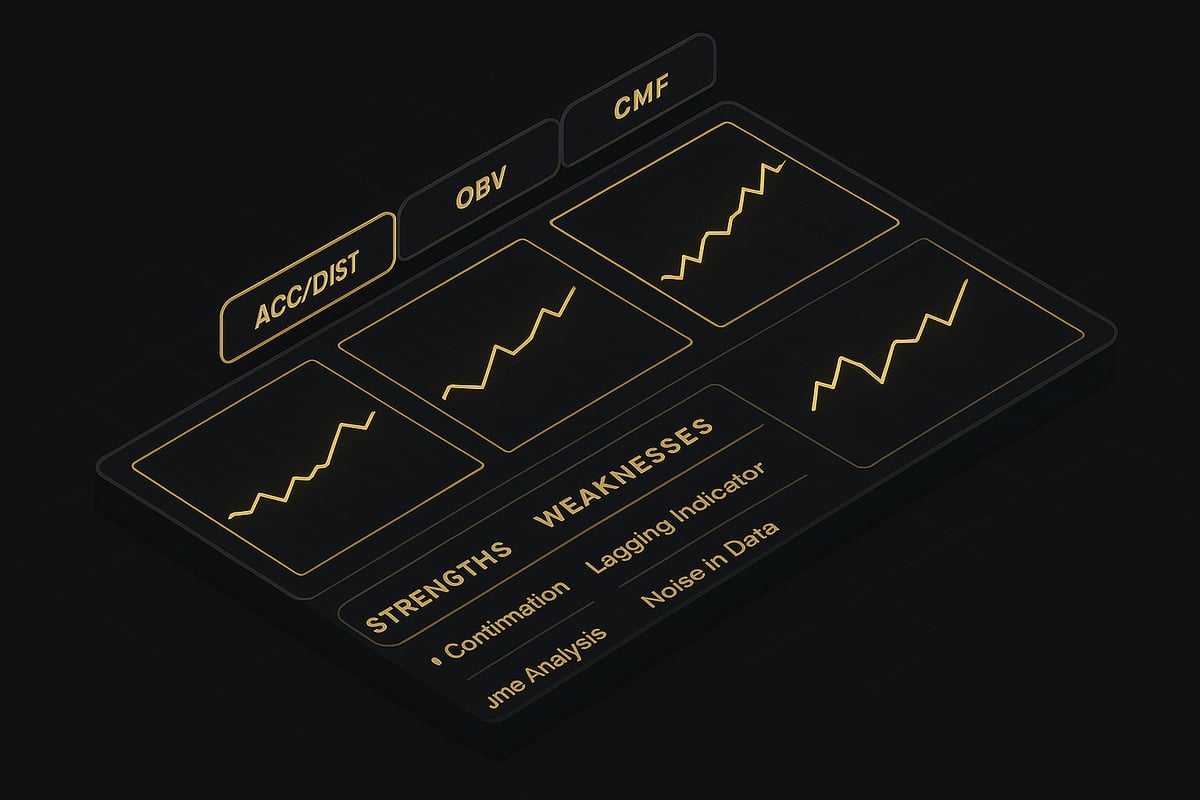
The accum dist indicator and On-Balance Volume (OBV) both analyze volume to confirm price trends, but their methods differ significantly. OBV is straightforward, tracking whether volume is added or subtracted based solely on whether the price closes higher or lower than the previous period. In contrast, the accum dist indicator adds nuance by factoring in where the closing price sits relative to the period’s high and low.
| Feature | OBV | Accum Dist Indicator |
|---|---|---|
| Volume Calculation | Up/down days only | Considers close within range |
| Sensitivity to Volatility | Lower | Higher |
| Divergence Detection | Basic | More nuanced |
During volatile periods, the accum dist indicator can diverge from OBV, offering additional clues about hidden accumulation or distribution. This extra layer of detail can help traders spot subtle shifts in market sentiment that OBV might miss.
Accum Dist vs. Chaikin Money Flow (CMF)
When comparing the accum dist indicator to Chaikin Money Flow (CMF), the main difference lies in calculation and sensitivity. CMF computes an average of AD values over a set period, making it more reactive to short-term price swings. The accum dist indicator, by contrast, uses a cumulative approach, which many traders prefer for identifying longer-term accumulation or distribution trends.
For instance, CMF may show sharp spikes or dips that do not always align with the broader trend indicated by the accum dist indicator. Using both together can provide a comprehensive view, allowing traders to catch both immediate opportunities and deeper, sustained market moves.
Strengths and Limitations of the Accum Dist Indicator
The accum dist indicator stands out for its ability to detect hidden buying or selling pressure and confirm trends across a wide range of markets. Its strengths include:
- Detecting accumulation and distribution phases
- Providing confirmation for price trends
- Applicability in stocks, forex, and crypto
However, there are limitations. The accum dist indicator can lag in low-volume or illiquid assets and may produce false signals in manipulated markets. For example, during “pump and dump” schemes, it might show false accumulation. Studies, such as the Accumulation/Distribution Indicator in Indian Stock Market, highlight its effectiveness in high-liquidity environments, reinforcing the importance of context when using this tool.
When to Use or Avoid the Accum Dist Indicator
The accum dist indicator is most effective in trending, liquid markets where volume data is reliable. It excels when used to confirm moves in well-traded assets. However, it is best avoided in penny stocks, thinly traded securities, or during pre-market and after-hours sessions, as unreliable volume can distort signals.
For optimal results, always pair the accum dist indicator with price action analysis and other technical tools. This approach helps filter out false positives and ensures that your trading decisions are grounded in strong, multi-faceted evidence.
Common Mistakes and Pitfalls When Using the Accum Dist Indicator
Traders often look to the accum dist indicator for an edge, but common mistakes can quickly undermine its effectiveness. Understanding these pitfalls is essential to avoid costly errors and to make the most of this powerful volume-based tool.
Misinterpreting Divergences and Signals
A frequent pitfall with the accum dist indicator is misreading divergences. Traders may act on a single divergence, expecting a reversal, only to be caught in a false move. For instance, a bearish divergence may appear during a news-driven rally, but price can continue higher if the broader context is ignored.
- Over-reliance on one divergence without confirmation increases risk.
- News events can distort price and volume, misleading the accum dist indicator.
- Confirmation from other tools, such as Identifying Stock Market Leaders Using A/D Rating, is crucial.
Always seek alignment between price action and indicator signals. This helps filter out noise and reduces the chance of acting on unreliable setups.
Neglecting Market Context and Volume Anomalies
Ignoring the bigger picture can lead to misinterpretation of the accum dist indicator. Volume spikes after earnings, central bank decisions, or unexpected news can create misleading accumulation or distribution signals.
- Macroeconomic events often trigger short-lived volume anomalies.
- The accum dist indicator may spike, but the signal lacks staying power.
- Contextual analysis is essential for accurate interpretation.
For example, a sudden jump in the indicator after a major announcement may not reflect genuine accumulation. Always check the news calendar and consider the reason behind volume changes before making decisions.
Failing to Adapt to Changing Market Conditions
Markets evolve, and so should your use of the accum dist indicator. Algorithmic trading and new liquidity patterns can introduce more noise, making old settings less effective.
- Regularly review your indicator parameters.
- The accum dist indicator may lag in fast-moving or manipulated markets.
- Adapt your approach to account for changing volume structures.
For example, a surge in high-frequency trading can distort volume, leading to false signals. Adjust timeframes or combine with other analytical methods to stay ahead in dynamic environments.
Risk Management Errors Linked to AD Signals
One of the most serious mistakes is poor risk management based on the accum dist indicator. Overconfidence in a single accumulation or distribution signal can lead to oversized positions and significant losses.
- Always use stop-loss orders, even when the accum dist indicator looks strong.
- Position sizing should reflect overall market risk, not just indicator signals.
- Combining with MACD indicator strategies can provide extra confirmation and reduce risk.
For example, ignoring a stop-loss after a false signal can wipe out gains. Robust risk controls are essential, regardless of indicator reliability.
As you’ve discovered throughout this guide, mastering the Accum Dist Indicator is a key step toward navigating 2026’s fast-paced markets with greater confidence and clarity. But having the right tools can make all the difference when it comes to putting these strategies into practice. With PipTrend’s AI-powered signals and real time analysis, you can take the guesswork out of your trading decisions and truly harness the power of accumulation and distribution insights. Ready to see how these strategies translate into real results in your own trading? See Your Trading Improve With PipTrend