On this page
Algo Trading Beyond the Hype
Most people meet algo trading through an advertisement, not a textbook. A screenshot of a rising equity curve, a promise of hands-free income, a bot that “uses AI” to read the market.
It sells well.
It also has almost nothing to do with what algorithmic trading actually is.
Strip away the marketing and algo trading is a process discipline.
You write down rules. You test them against history. You control how much you risk on each one.
Then you either execute those rules yourself or hand them to software that does it without hesitation.
That last part is where the profit is supposed to come from, and it is also where beginners get it backwards.
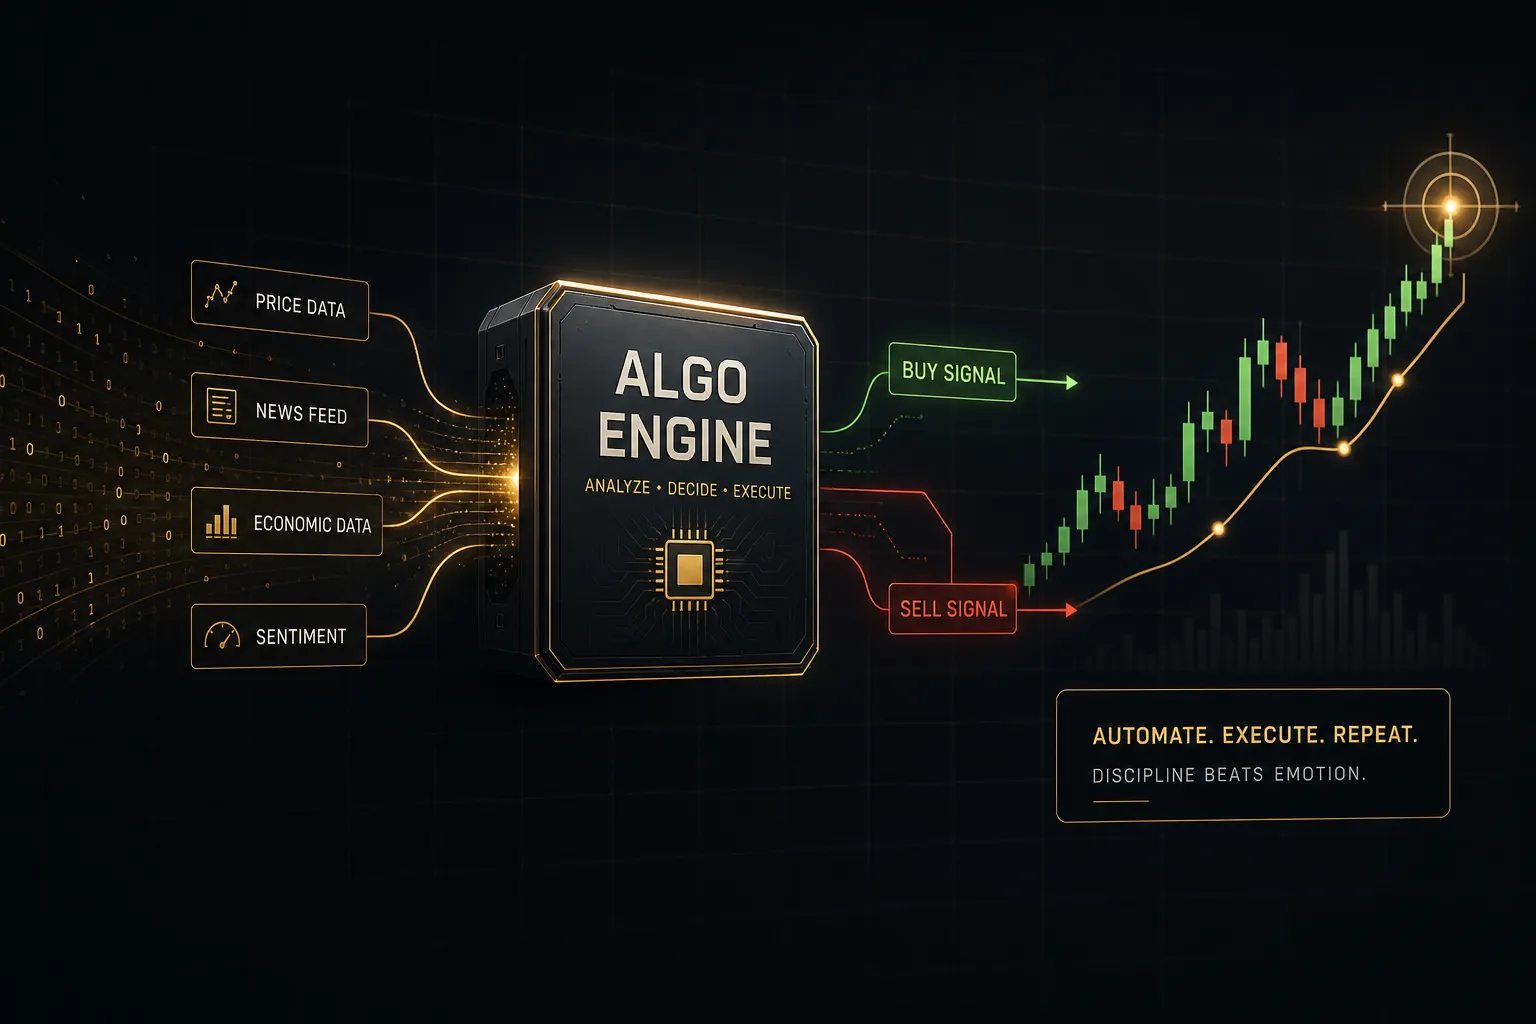
Automation does not create an edge. It enforces one.
If your rules are bad, code executes bad decisions faster and more consistently than you ever could by hand.
An algorithm is a set of instructions, not a forecast. It only performs as well as the logic you feed it.
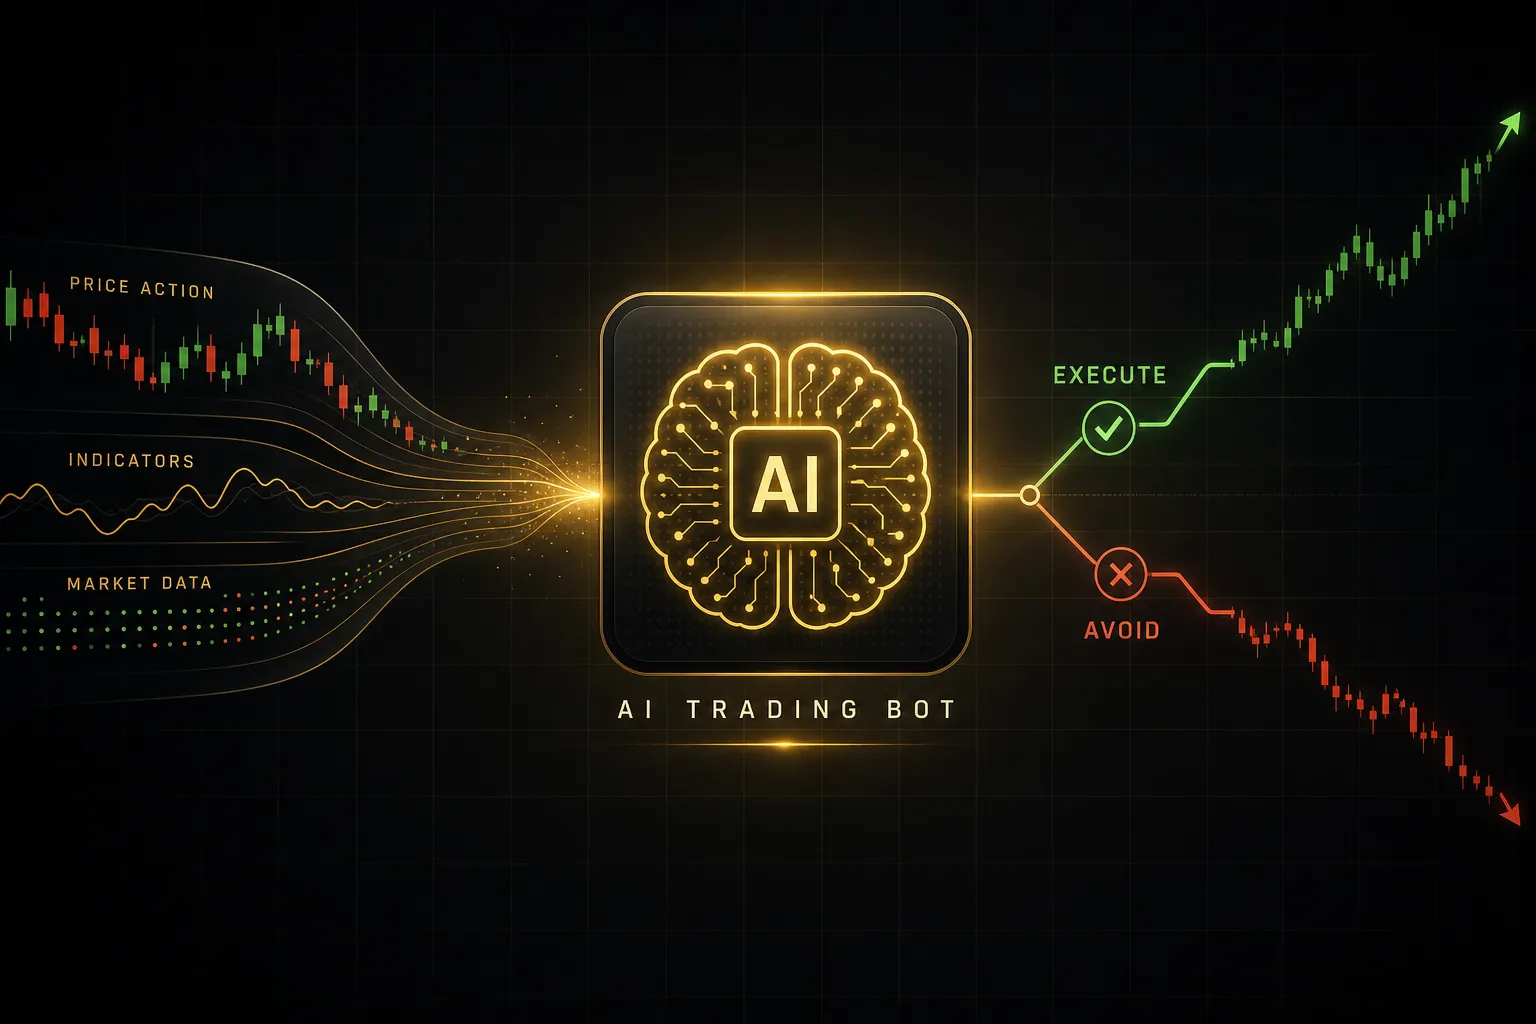
This guide moves in the order a real trader should move. First, what algo trading actually means, including the difference between generating a signal and automating an order. Then the full pipeline from hypothesis to executed trade, the main strategy families, and where technical indicators genuinely fit.
After that comes the part nobody screenshots: validation.
Backtesting, out-of-sample testing, paper trading, and the specific ways a beautiful backtest turns into a losing live account. We will name the biases by name and show how to spot an overfit system before it costs you money.
Finally, risk.
The metrics that matter more than win rate, the operational failures that take down automated systems, and a decision framework for whether you should be trading manually, semi-automatically, or fully hands-off right now.
One distinction to keep in mind from the start, because the entire article rests on it.
A signal tells you to act. An automated order acts for you.
Those are two different stages, with two very different risk profiles, and you do not need the second one to benefit from the first.
What Algo Trading Actually Means
Ask ten retail traders to define algo trading and you will get answers ranging from “Python bots” to “hedge fund stuff.” The working definition is simpler and more useful.
Algo trading is the use of predefined, testable rules to decide entries, exits, and position sizing, instead of discretionary judgment in the moment.
That is it.
The rules must be specific enough that two people reading them would place the identical trade.
Compare two versions of the same idea.
Version one: “buy when the trend looks strong and momentum confirms it.” Version two: “buy when the 50-period moving average is above the 200-period moving average, RSI closes between 45 and 60, and price is within 0.5% of the 20-period moving average; risk 1% of equity; exit at 2R or on a close below the 50-period average.”
Only the second is an algorithm.
It is objective, repeatable, and testable.
The first is a feeling with technical vocabulary attached.
Here is the part that surprises people: coding is not a requirement to start.
Systematic trading is a way of thinking before it is a piece of software. Plenty of profitable rule-based traders execute manually from a checklist and a chart.
No-code platforms, strategy builders, and indicator-based signal tools let you apply rule-based logic, define conditions visually, and receive alerts long before you write a line of Python.
That matters because the hard skill in quantitative trading is not syntax. It is defining an edge and validating it honestly.
Signals vs Full Automation
A signal is a notification that your conditions have been met. Your rules evaluate, they return true, and you get an alert on your phone or a marker on your chart.
A human still reviews it and decides whether to click.
Full automation removes that human.
Code evaluates the same rules, then sends the order to the broker’s API, manages the stop, and closes the position, all without asking permission.
Same logic, radically different failure modes.
A signal system fails when your rules are wrong. An automated system fails when your rules are wrong or your internet drops, or the API returns an error, or a data feed goes stale and the algorithm trades on a price that no longer exists.
Treat them as two stages of one workflow. Stage one proves the logic. Stage two scales the execution.
Skipping stage one is how beginners lose money on schedule.
Not the Same as HFT
High-frequency trading gets blamed for a lot, and retail algo traders get lumped in with it constantly.
The two barely occupy the same universe.
HFT firms compete on microseconds.
They colocate servers inside exchange data centres, pay for direct market data feeds, employ teams of engineers, and profit from spreads measured in fractions of a cent across enormous volume. Capital requirements run into the millions before you consider infrastructure.
Retail algo trading operates on holding periods of minutes to days, sometimes weeks. It runs on a standard broker connection, a laptop or a cheap virtual server, and off-the-shelf platform tools.
Execution speed of a few hundred milliseconds is perfectly acceptable when your average trade lasts six hours.
The practical takeaway: you are not competing with HFT firms.
You are competing on patience, rule quality, and risk control, none of which require a fibre line to the exchange.
From Signal to Executed Trade
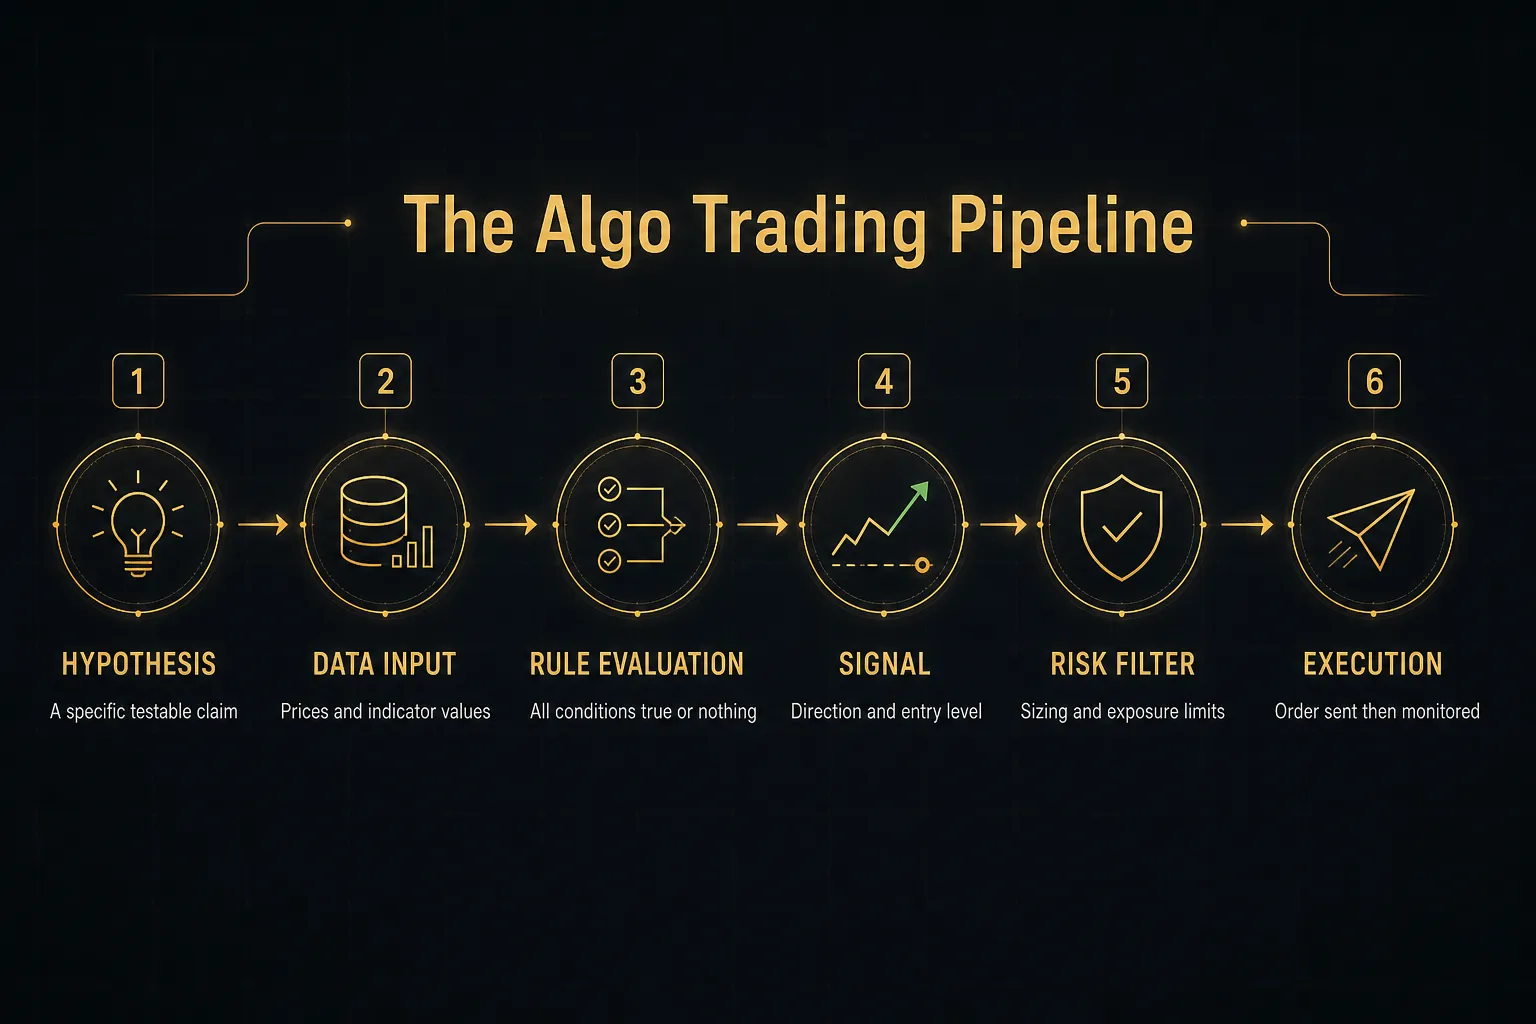
Every automated trading system, from a two-line moving average crossover to an institutional multi-factor model, runs through the same pipeline. Understanding the stages tells you exactly where things break.
It starts with a hypothesis, a specific claim about market behaviour. “Breakouts from tight consolidation in trending markets continue in the breakout direction more often than they reverse.”
Vague ideas cannot be tested, so the hypothesis has to be narrow.
Then data and indicator input.
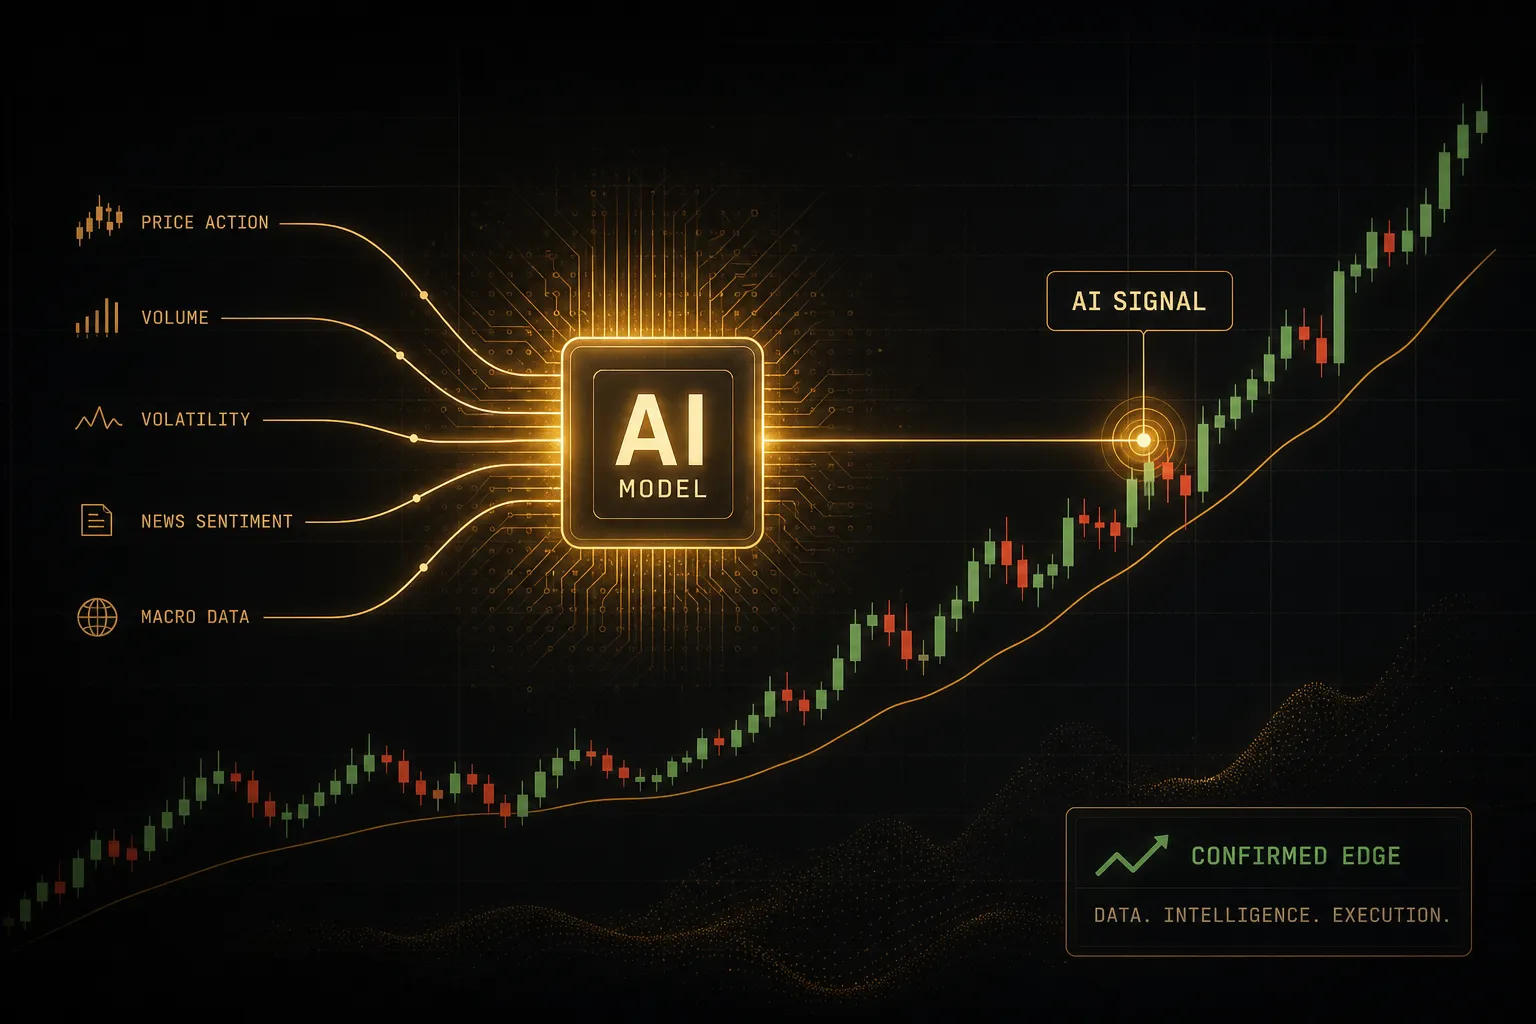
Price, volume, and any derived values your rules need: moving averages, ATR, RSI, VWAP. Garbage data at this stage poisons everything downstream, which is why data quality is a genuine edge.
Next the system performs rule evaluation. On each new bar or tick, it checks every condition.
All true, or nothing happens.
Most of the time, nothing happens, and that is normal.
When conditions align, you get signal generation. Direction, instrument, and ideally a specific entry level rather than “buy at market whenever.”
Before any order goes out, the signal passes a risk filter. How much equity is already committed? Does this correlate with open positions? Is the calculated position size within limits? Is a news blackout active?
Signals that fail the filter get discarded, not traded.
Only then comes order execution, where the instruction reaches the broker, and finally monitoring, where you log fills, track slippage, and compare live results against expectations.
What markets can you run this on?
Forex, crypto, equities, index CFDs and futures, and commodities all support rule-based trading. Forex and crypto attract beginners because they trade nearly around the clock and offer small minimum position sizes.
Capital requirements come from the broker and the instrument, not the algorithm.
A single ES futures contract demands thousands in margin; a micro forex lot can risk a few dollars. Leverage, contract size, and volatility set your floor, so choose instruments your account can actually survive.
Common Algorithmic Strategy Types
Almost every retail strategy is a variation on four families, and each one has a market condition where it thrives and another where it bleeds.
- Trend-following. Buy strength, sell weakness, hold while the move continues. Win rates are often below 45%, but winners run far longer than losers. Performance collapses in choppy, range-bound conditions, where it produces a string of small whipsaw losses.
- Mean-reversion. Bet that stretched prices snap back to an average. High win rates, small average gains, and occasional brutal losses when a “stretched” market simply keeps going. It suffers badly during strong directional trends and volatility expansions.
- Breakout. Enter when price clears a defined range or volatility threshold. It works when a genuine regime shift follows the break and fails through false breakouts in low-conviction markets.
- Arbitrage and relative value. Exploit pricing differences between related instruments, exchanges, or expiries. Pure arbitrage is largely gone at retail speed, but statistical pair trades remain viable, at the cost of higher complexity and financing risk.
This regime dependency is the single most underrated fact in systematic trading.
A trend system that returned 40% last year did not become broken this year; the market simply stopped trending. Knowing which regime your strategy needs is part of the strategy.
Where Indicators Fit In
Technical indicators do one job well.
They compress price into a comparable, rule-friendly number. A moving average summarises direction. RSI summarises momentum extension. VWAP gives an intraday reference for value.
What they do not give you is a strategy.
An indicator produces a raw signal, and a raw signal is maybe 25% of a tradable system.
The rest is layered on top: precise entry timing so you are not chasing, exit rules for both winners and losers, position sizing tied to volatility, and hard risk limits that override everything else.
Structured signal tools make that progression visible. PipTrend, for instance, separates the workflow into a directional signal, then specific precision entry levels, then a multi-timeframe exit table.
That layering is the practical difference between “RSI is oversold” and a complete plan with a defined entry, a defined invalidation point, and defined targets.
Whether you use a tool or build it yourself, the sequence is the same.
Direction first.
Entry second.
Exit and size third.
Skip any layer and you have an indicator, not an algorithm.
Building and Validating Your Strategy
The failure rate among self-directed algo traders is high, and the cause is rarely a lack of ideas.
It is skipping validation steps because the backtest looked good enough to go live.
Follow the sequence below in order, and do not compress it.
- Write a testable hypothesis. State one specific claim about market behaviour and the condition under which it should hold. “Pullbacks to the 20-period average in an established uptrend resolve upward more often than down” is testable; “the trend is your friend” is not.
- Convert it into objective rules. Define entry conditions, exit conditions, position sizing, and maximum exposure in numbers with no room for interpretation. If you cannot hand the rules to a stranger and get identical trades, they are not finished.
- Run a historical backtest with realistic costs. Test across at least several hundred trades and multiple market regimes, including a drawdown period and a low-volatility stretch. Include spread, commission, and a conservative slippage assumption from the very first run, not as an afterthought.
- Validate out of sample. Split your data roughly 70/30, build and tune on the first portion only, then test once on the untouched 30%. A meaningful performance drop between the two means you fit noise, not signal.
- Add walk-forward analysis. Roll the optimise-then-test window forward through history so the strategy is repeatedly validated on data it has never seen. This is the closest offline approximation of live trading and it kills most fragile systems quickly.
- Forward test in a paper account. Run the rules on live market data with simulated money for a minimum of one to three months, depending on trade frequency. You are checking that live signal generation, data feeds, and timing behave the way the backtest assumed.
- Deploy live at minimum size. Trade the smallest position your broker allows for at least 30 to 50 trades. Real fills reveal the slippage and rejection behaviour that no simulator models correctly.
- Monitor continuously and compare to baseline. Log every trade against expected performance, track drawdown versus historical maximum, and define in advance the numbers that trigger a size reduction or a shutdown. A system without a review threshold is a system that dies slowly.
Why Backtests Can Lie
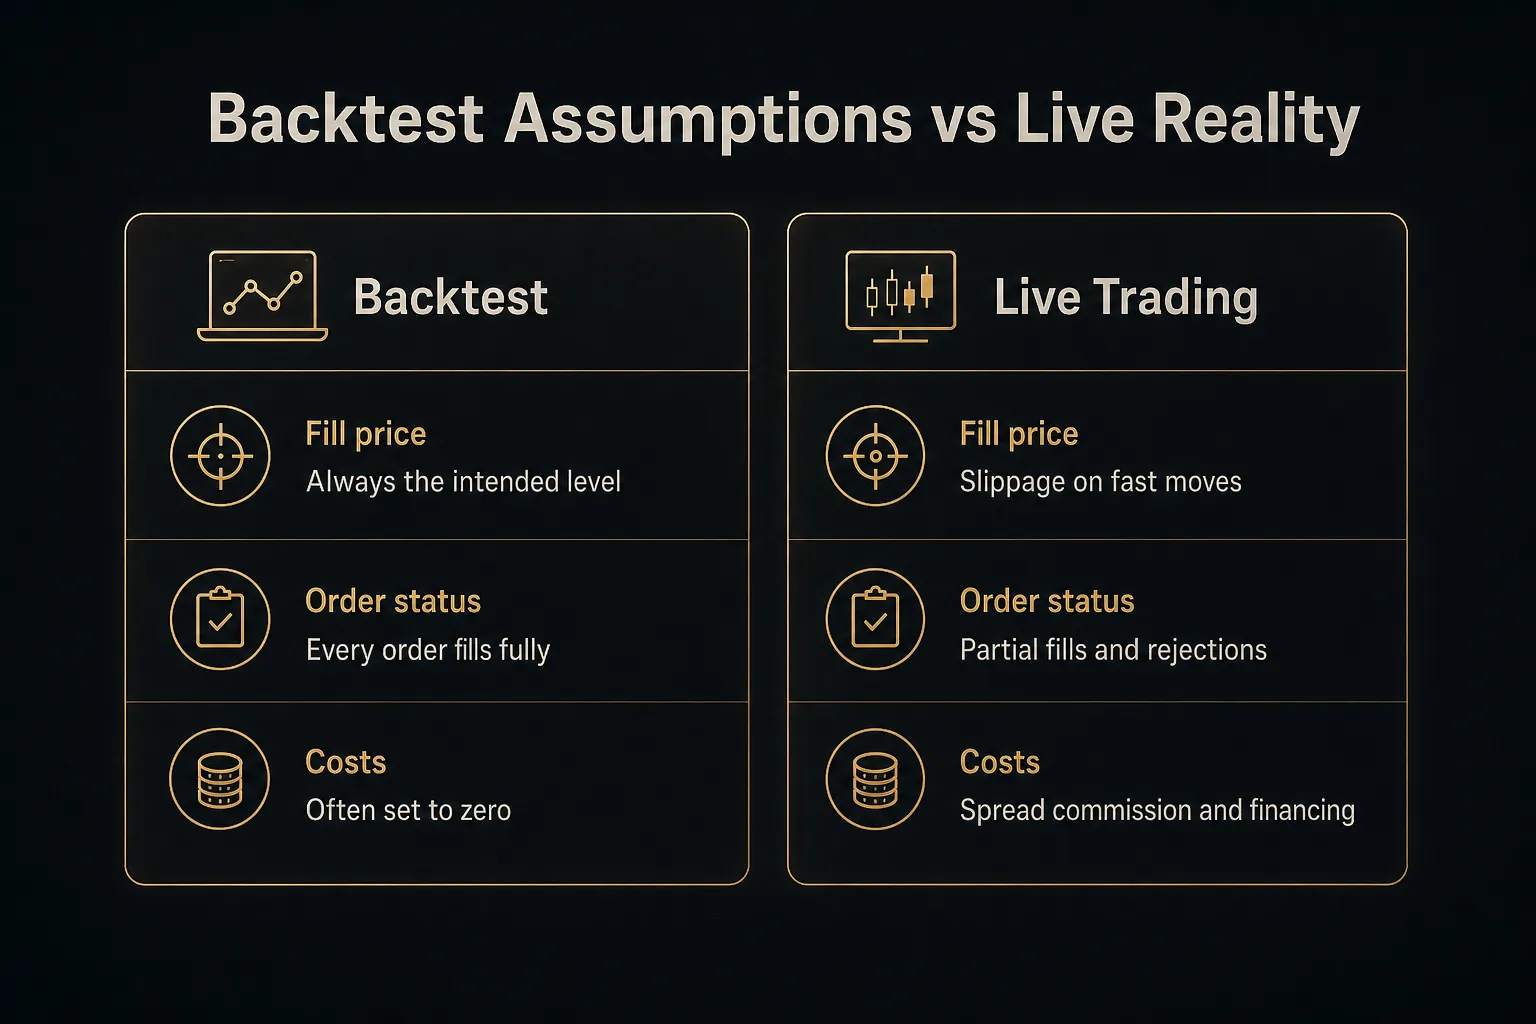
A backtest is a simulation, and simulations are generous. The gap between simulated and live results has specific, nameable sources.
Spread and commissions are the obvious ones, and they compound viciously with frequency. A strategy averaging 8 pips per trade with a 1.5 pip spread loses roughly 19% of gross profit to the spread alone.
Run it 500 times a year and small assumptions become the entire result.
Slippage is the difference between your intended price and your actual fill. Backtests typically assume you get the close.
Reality gives you a worse price precisely when it hurts most, during fast moves and news releases, which is exactly when breakout systems trade.
Latency, partial fills, and rejected orders finish the job. Your signal fires, the order takes 400 milliseconds to arrive, price has moved, the broker fills half your size, and rejects the rest.
The backtest recorded a clean full-size entry at the ideal price.
Then there are the data biases.
Look-ahead bias means your rules used information that was not available at decision time, such as evaluating a signal using the closing price of the bar you claim to have entered. Survivorship bias comes from testing on a universe that excludes delisted or failed instruments, quietly deleting the worst outcomes from history.
Data snooping is testing so many variations that something looks brilliant by chance. Run 500 parameter combinations and a few will show excellent results purely through randomness.
Spotting an Overfit System
Overfitting is what happens when a strategy memorises history instead of learning from it. It is the most common reason a backtested system fails in month one.
Consider a concrete case.
A trader tests a moving average crossover on EUR/USD and grinds through parameter combinations until finding 37 and 143 periods, which returns 61% annually in the backtest. Neighbouring settings, 35 and 140, return 12%. Settings of 40 and 150 return negative 4%.
That is parameter sensitivity, and it is a red flag, not a discovery.
Robust edges degrade gently as you move parameters. Fragile ones fall off a cliff, because the exact number was tuned to a handful of specific historical trades that will never repeat.
Other warning signs are easy to check.
More than four or five tuned parameters.
Equity curves that look suspiciously smooth.
Fewer than 100 trades in the sample.
Out-of-sample performance under half the in-sample figure.
Rules with special exceptions bolted on to avoid particular losses.
This is also why simple, interpretable rules usually beat machine-learning models for retail traders. When a five-rule system underperforms, you can identify which rule broke and why.
When a gradient-boosted model with 60 features underperforms, you have a black box, a shrinking account, and no diagnostic path.
Interpretability is a risk management tool, not a limitation.
Risk, Metrics, and Your Workflow
Automation does not make a strategy profitable. It makes it consistent.
A losing edge executed flawlessly 40 times a week is still a losing edge, and it reaches zero faster than a discretionary trader who hesitates.
So risk management is not the boring appendix to algo trading. It is the part that determines whether you are still trading in a year.
That means measuring the right things and protecting against the failures that have nothing to do with your rules.
Metrics That Actually Matter
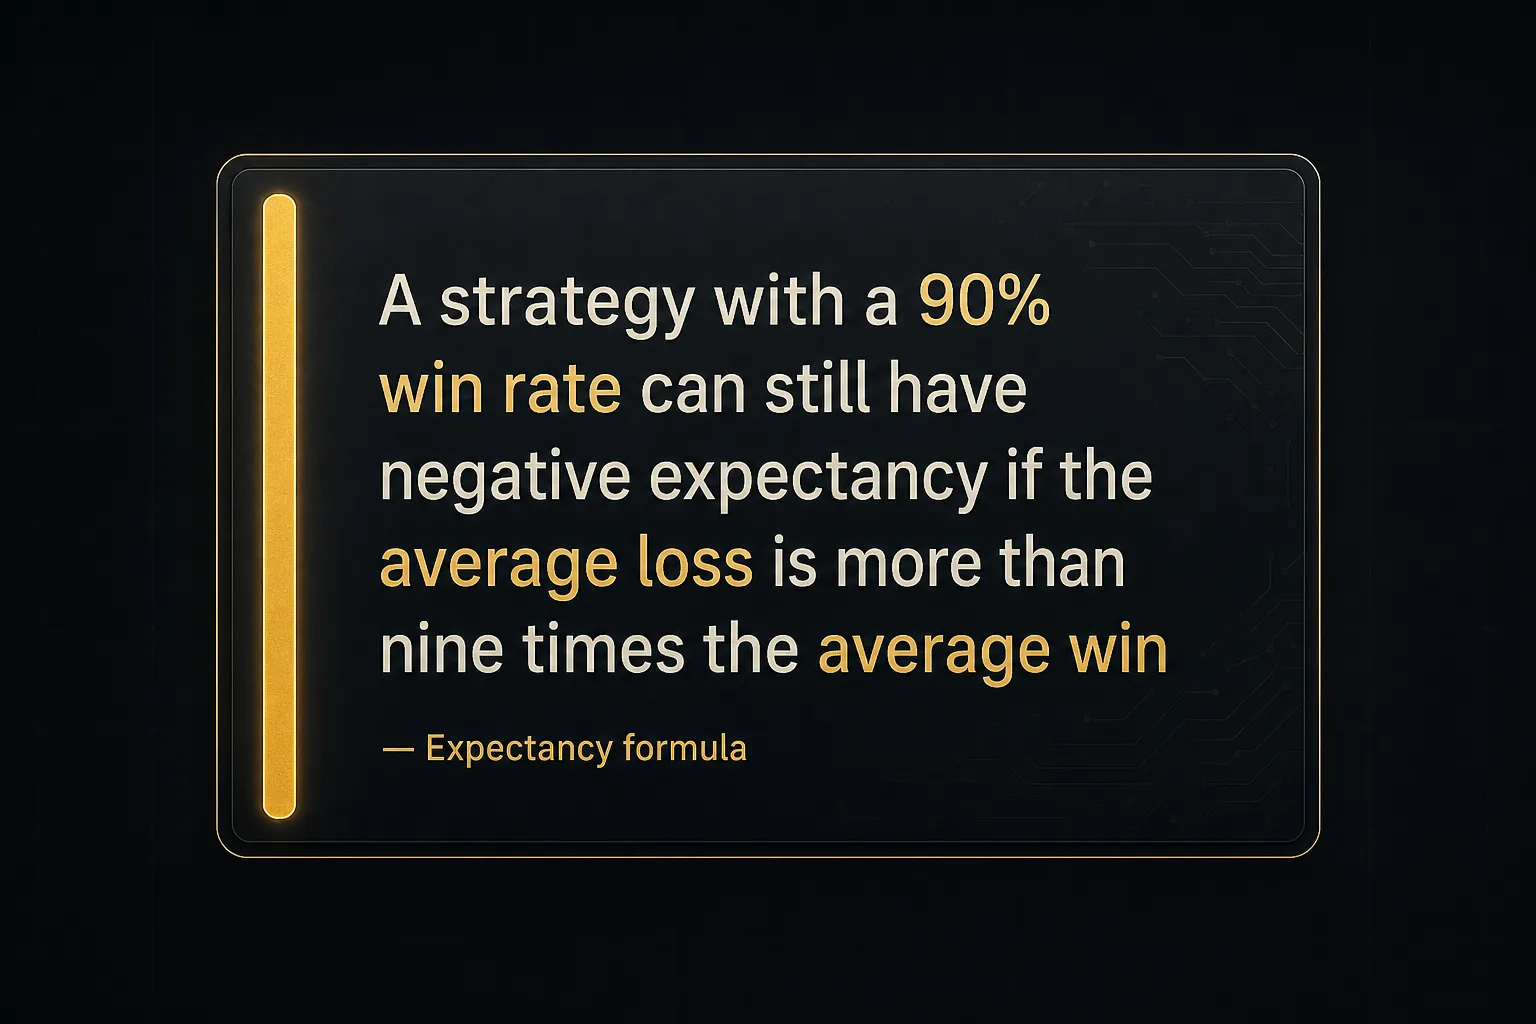
Win rate and total return are the two most quoted and least informative numbers in trading. A 90% win rate means nothing if the 10% wipes out a year of gains.
Judge systems on these instead.
- Expectancy. The average profit or loss per trade, calculated as (win rate x average win) minus (loss rate x average loss). Positive expectancy after costs is the minimum bar for any strategy; everything else is optimisation.
- Maximum drawdown. The largest peak-to-trough equity decline in the test period, expressed as a percentage. Assume your live drawdown will exceed the backtested figure, and size so that 1.5 times the historical maximum would still be survivable both financially and psychologically.
- Profit factor. Gross profit divided by gross loss. Above 1.3 after realistic transaction costs is respectable for a retail system; anything above 3 in a backtest deserves suspicion rather than celebration.
- Exposure and turnover. What percentage of the time capital is at risk, and how many trades you generate. High turnover multiplies your sensitivity to spread and slippage, so two systems with identical returns are not equally robust.
- Risk-adjusted return. Sharpe or Sortino ratios, or the simpler return-to-max-drawdown ratio. A 20% return with a 10% drawdown is a far better business than a 45% return with a 55% drawdown.
- Trade count and consistency. Results built on 30 trades are anecdotes. Look for at least 100 trades spread across different years and volatility regimes before you believe a number.
Then there is the category beginners never budget for: operational risk.
These failures have destroyed accounts holding perfectly good strategies.
- API failures and platform disconnects. Your algorithm opens a position, the connection drops, and the stop-loss instruction never arrives. Always place protective orders server-side rather than relying on your own script to manage exits.
- Duplicate orders. A script restarts, re-reads the signal, and fires a second identical entry, doubling your intended risk. Every automated system needs order tracking with unique IDs and a check for existing positions before submitting.
- Stale data. A feed freezes and your algorithm keeps computing indicators from prices that are three minutes old. Build a timestamp check that halts trading when data age crosses a threshold.
- Incorrect position sizing. A misplaced decimal, a pip-value error, or an unconverted currency can turn a 1% risk into a 10% risk. Hard-code a maximum order size that the system physically cannot exceed.
- Missing kill switch. Non-negotiable. You need a single action that flattens all positions and halts new orders, plus automatic triggers on daily loss limits and consecutive-loss counts.
Manual, Semi-Automated, or Full Auto?
Most beginners aim straight for full automation, which is like learning to drive in a self-driving car. Use this progression instead, and only advance when you meet the criteria.
- Start manual with indicator-based signals. Trade a written rule set by hand, logging every trade and every deviation. This builds the market judgment and discipline that let you recognise when a system is genuinely broken rather than just in a normal drawdown. Stay here until you have executed your rules without improvisation for 50 or more trades.
- Move to semi-automated alerts. Software watches the market, evaluates conditions, and notifies you; you approve and place the order. You gain coverage across sessions and instruments while keeping a human veto on anything that looks wrong, such as a signal firing 30 seconds before a central bank release.
- Consider full automation last. Only after a validated out-of-sample record, a completed paper-testing phase, live results at minimum size, server-side stops, redundant data checks, logging, alerting, and a tested kill switch. If you cannot describe how your system behaves when the broker API returns an error, you are not ready.
Algo Trading Questions Answered
What is algo trading and how does it work?
Algo trading is the practice of using predefined, testable rules to decide when to enter, exit, and size trades instead of relying on judgment in the moment. The workflow runs from hypothesis to indicator input, rule evaluation, signal generation, a risk filter, order execution, and monitoring.
Those rules can be executed by you manually from an alert, or by software connected to your broker’s API.
Same logic, different execution layer.
Is algo trading profitable?
It can be, but profitability comes from a validated edge and disciplined risk control, not from automation itself. Automating a losing strategy simply produces losses faster and more consistently.
A realistic path involves positive expectancy after spread, commissions, and slippage, plus a maximum drawdown you can survive.
Any system promising guaranteed monthly returns is not describing trading.
Can I do algo trading with no coding experience?
Yes.
Rule-based, systematic trading is a way of making decisions, and you can practise it with a written checklist, a charting platform, and indicator-based signal tools that require zero code.
No-code strategy builders and alert systems let you define conditions visually and forward test them. Coding becomes necessary only when you want unattended order execution.
What is the best strategy for algo trading?
There is no single best strategy, because performance is regime-dependent. Trend-following excels in sustained directional markets and struggles in range-bound chop; mean-reversion does the opposite.
For beginners, a simple trend-following or breakout system with three or four rules is the most practical starting point. Few parameters means fewer ways to overfit and an easier system to diagnose.
How do I start algorithmic trading as a beginner?
Start by writing one specific hypothesis and converting it into objective rules, then backtest with realistic transaction costs before anything else. Validate out of sample with a 70/30 split, add walk-forward analysis, then paper trade for one to three months.
Go live at minimum size for 30 to 50 trades before increasing risk. Trade the rules manually at first so you learn how they behave in real conditions.
Is algo trading legal and safe?
Algorithmic trading is entirely legal and used by regulated banks, funds, and brokers worldwide, with retail access provided through standard regulated broker APIs.
What is not legitimate is the surrounding scam ecosystem.
Treat guaranteed-return bots, managed “algo” accounts with fixed monthly percentages, unverifiable equity curves, and signal sellers who never disclose drawdown as fraud until proven otherwise. Safety in your own trading comes from position sizing, server-side stops, and a working kill switch.
Where to Go From Here
The decision path is short, and it depends only on where you honestly are today.
New to rule-based trading? Trade manually from indicator-based signals, log every trade, and build the judgment to distinguish a broken system from an ordinary drawdown.
Rules already proven over 50-plus consistent trades? Move to semi-automated alerts so software monitors and you approve.
Only after out-of-sample validation, paper testing, and live results at minimum size should you consider handing over execution entirely.
Notice what none of those steps involve.
Not machine learning.
Not faster hardware.
Not a more sophisticated indicator.
The edge in algo trading is process discipline: a hypothesis worth testing, rules specific enough to validate, costs modelled honestly, and risk limits you never override.
Complexity is usually a symptom of a weak edge, not a strong one.
If you want a bridge between reading indicators and trading systematically, a structured signal system helps more than another course. Something that gives you a clear directional signal, precise entry levels, and multi-timeframe exit guidance forces the layering that turns an indicator reading into a complete plan.
Start with one strategy.
Test it properly.
Trade it small.
Then decide what to automate.
Sources
- SEC: Staff Report on Algorithmic Trading in U.S. Capital Markets
- FINRA: Algorithmic Trading
- CFTC: Customer Advisory: AI Won’t Turn Trading Bots into Money Machines
- Investor.gov: Artificial Intelligence (AI) and Investment Fraud: Investor Alert
- ScienceDirect: Market microstructure: A survey of microfoundations, empirical results, and policy implications
Risk Disclaimer: Trading involves risk. Past performance doesn't guarantee future results. Only trade with money you can afford to lose. PipTrend is a tool to assist your trading decisions, not financial advice.