Stochastic RSI Indicator: Reading Momentum in Context
On this page
Why Stochastic RSI Confuses So Many Traders
Most traders meet the Stochastic RSI the same way: they see a line pinned above 0.80, hit sell, and watch price climb another 8% without them. The indicator wasn’t broken.
The interpretation was.
Stochastic RSI is a momentum oscillator built on top of another momentum oscillator, and that extra layer makes it faster, noisier, and far more prone to sticking at extremes than anything most traders are used to. A reading of 0.95 doesn’t mean “reversal imminent.”
In a strong uptrend it often means the trend is healthy.
This guide uses a context-first framework, and the order matters. Signal, then confirmation, then a risk-managed decision.
The signal alone is never the trade.
That single reordering is what separates traders who use this tool profitably from traders who get chopped up by it.
There’s also a naming problem worth clearing up before you plot anything. Three different indicators share overlapping vocabulary: the relative strength index (RSI), the stochastic oscillator, and the Stochastic RSI.
They measure related things but they are not interchangeable, and they don’t fire at the same time or with the same frequency.
By the end of this article you’ll know exactly what the calculation is doing, when extremes mean reversal versus continuation, how to build a repeatable workflow around it, and where the false signals actually come from.
What Stochastic RSI Actually Measures
Here’s the part almost nobody explains properly: Stochastic RSI never touches price directly.
It reads RSI values.
RSI reads price.
So you’re two transformations removed from the actual candles on your chart.
RSI Applied to RSI: The Two-Step Calculation
Developed by Tushar Chande and Stanley Kroll in 1994, the Stochastic RSI answers a specific question: where is the current RSI value sitting within its own recent range?
Step one, calculate RSI as normal, typically over 14 periods. Step two, apply the stochastic formula to those RSI values instead of to price:
Stoch RSI = (Current RSI − Lowest RSI over N periods) ÷ (Highest RSI over N periods − Lowest RSI over N periods)
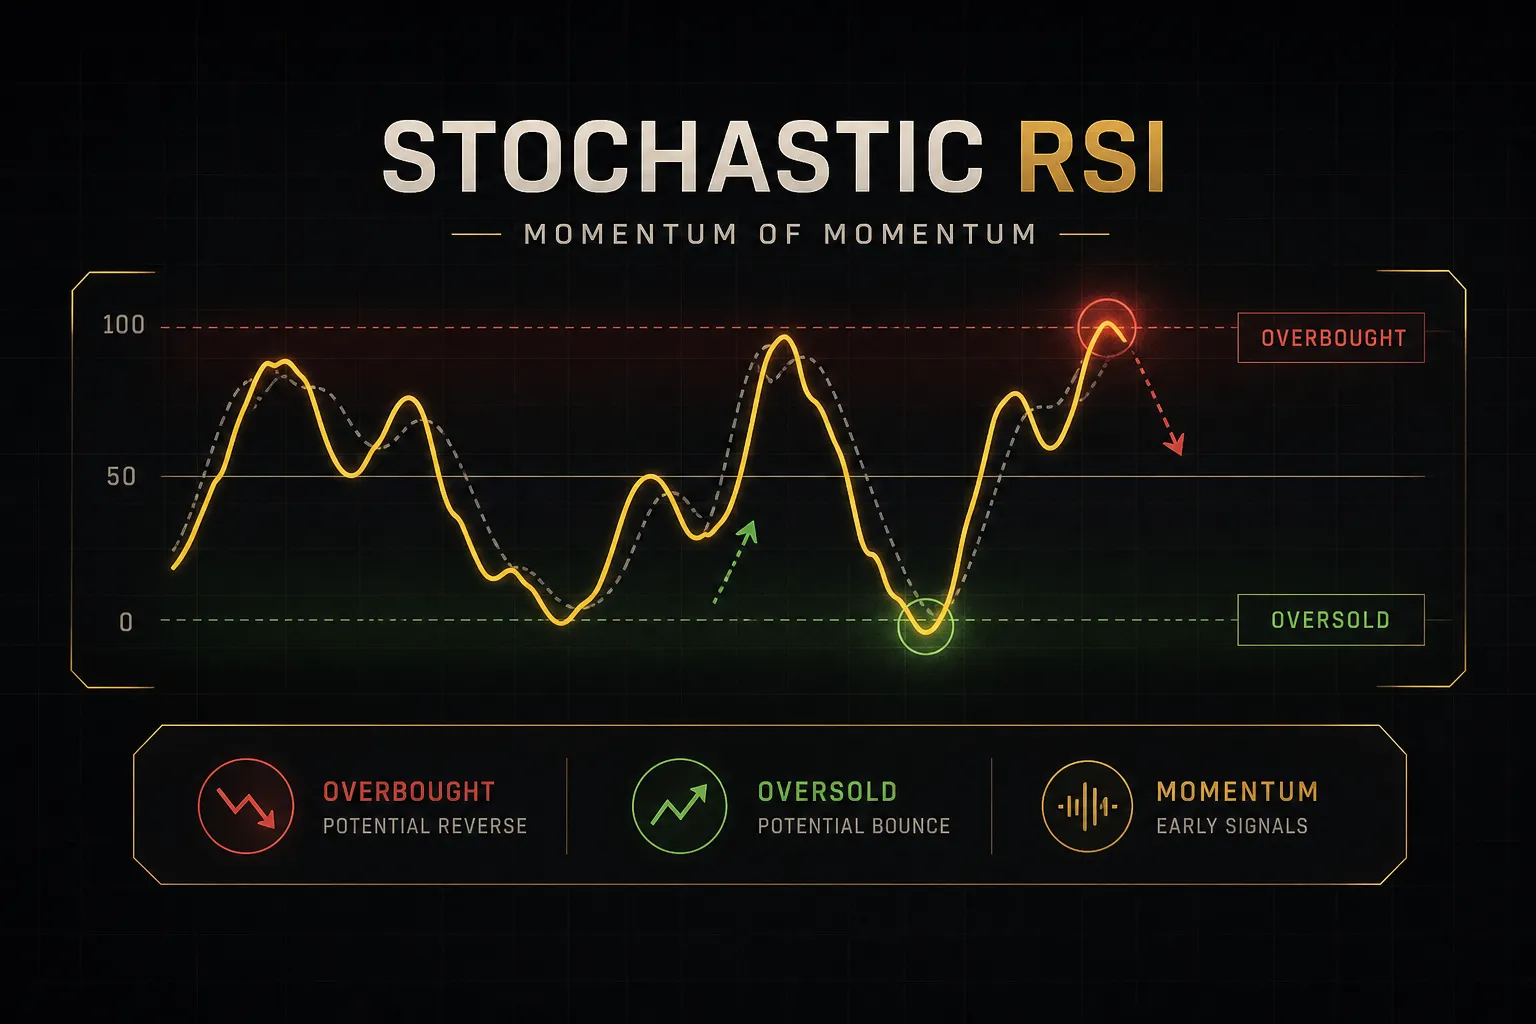
The result is a number between 0 and 1. If RSI is at the very top of its 14-period range, you get 1.00. At the bottom, 0.00.
That’s it.
Why bother?
Because raw RSI can spend weeks between 40 and 60 without ever touching the classic 30/70 overbought and oversold conditions. The stochastic transformation stretches that compressed range back out, surfacing momentum shifts RSI alone would smooth over.
The cost is sensitivity.
Small RSI moves become large Stoch RSI moves, which is exactly why the indicator whipsaws.
Decoding the 14, 3, 3, 3 Settings
The default string of numbers on most platforms is 14, 14, 3, 3 or 14, 3, 3, 3 depending on how the developer labelled the fields. Four separate inputs are at work:
- RSI lookback period (typically 14): how many bars feed the underlying relative strength index. Shorter values make the base RSI jumpier before the stochastic layer even runs.
- Stochastic lookback period (typically 14): how many RSI values are scanned to find the high and low of the range. Shorten this to 5 and the indicator hits 1.00 and 0.00 constantly.
- %K smoothing (typically 3): a simple moving average applied to the raw stochastic output, producing the percentage K line. Set it to 1 and you get the unsmoothed, extremely erratic version.
- %D smoothing (typically 3): a moving average of %K, producing the percentage D signal line. Crossovers between %K and %D are the standard trigger.
Increase any of these and you get fewer, slower, more reliable signals. Decrease them and you get more signals, most of which are noise.
That trade-off never goes away.
Stoch RSI vs RSI vs Stochastic Oscillator
One more wrinkle: scale. TradingView plots Stoch RSI on a 0 to 100 scale by default. Many other platforms and the original formula use 0 to 1.
A “0.80” and an “80” mean the same thing, but traders comparing screenshots across tools routinely think they’re looking at different indicators.
They’re not.
| Attribute | RSI | Stochastic Oscillator | Stochastic RSI |
|---|---|---|---|
| Input data | Closing prices | Close vs high/low range | RSI values (not price) |
| Formula layers | One transformation | One transformation | Two stacked transformations |
| Typical scale | 0 to 100 | 0 to 100 | 0 to 1 (or 0 to 100) |
| Extreme thresholds | 30 / 70 | 20 / 80 | 0.20 / 0.80 |
| Signals per 100 bars (14-period, daily) | Roughly 2 to 5 | Roughly 8 to 12 | Roughly 15 to 25 |
| Sensitivity | Low, smooth | Moderate | High, erratic |
| Best used for | Trend strength and divergence | Range reversals | Timing entries within a known bias |
Read the signals-per-100-bars row again. Stoch RSI fires roughly five times as often as RSI on identical data.
That is not five times the edge.
It’s five times the decisions, and most of the extra ones are noise you need to filter out.
Reading Signals Without the Guesswork
Overbought and Oversold Aren’t Automatic Signals
The single most expensive belief in technical analysis: above 0.80 means sell, below 0.20 means buy.
In a genuine trend, Stoch RSI can stay above 0.80 for twenty, thirty, forty consecutive bars. During the strongest legs of a bull market, it will oscillate between 0.60 and 1.00 and never once visit the oversold zone.
A trader shorting each 0.80 print gets stopped out repeatedly while the trend continues.
What the reading actually tells you is narrower and more useful: current RSI is near the top of its own recent range. That’s a statement about momentum being stretched relative to itself.
It is not a forecast.
An extreme reading is information about the past. Whether it becomes a reversal or a continuation depends entirely on the market regime you’re trading in.
Trend-Following vs Mean-Reversion Context
Two regimes, two completely opposite interpretations of the same number.
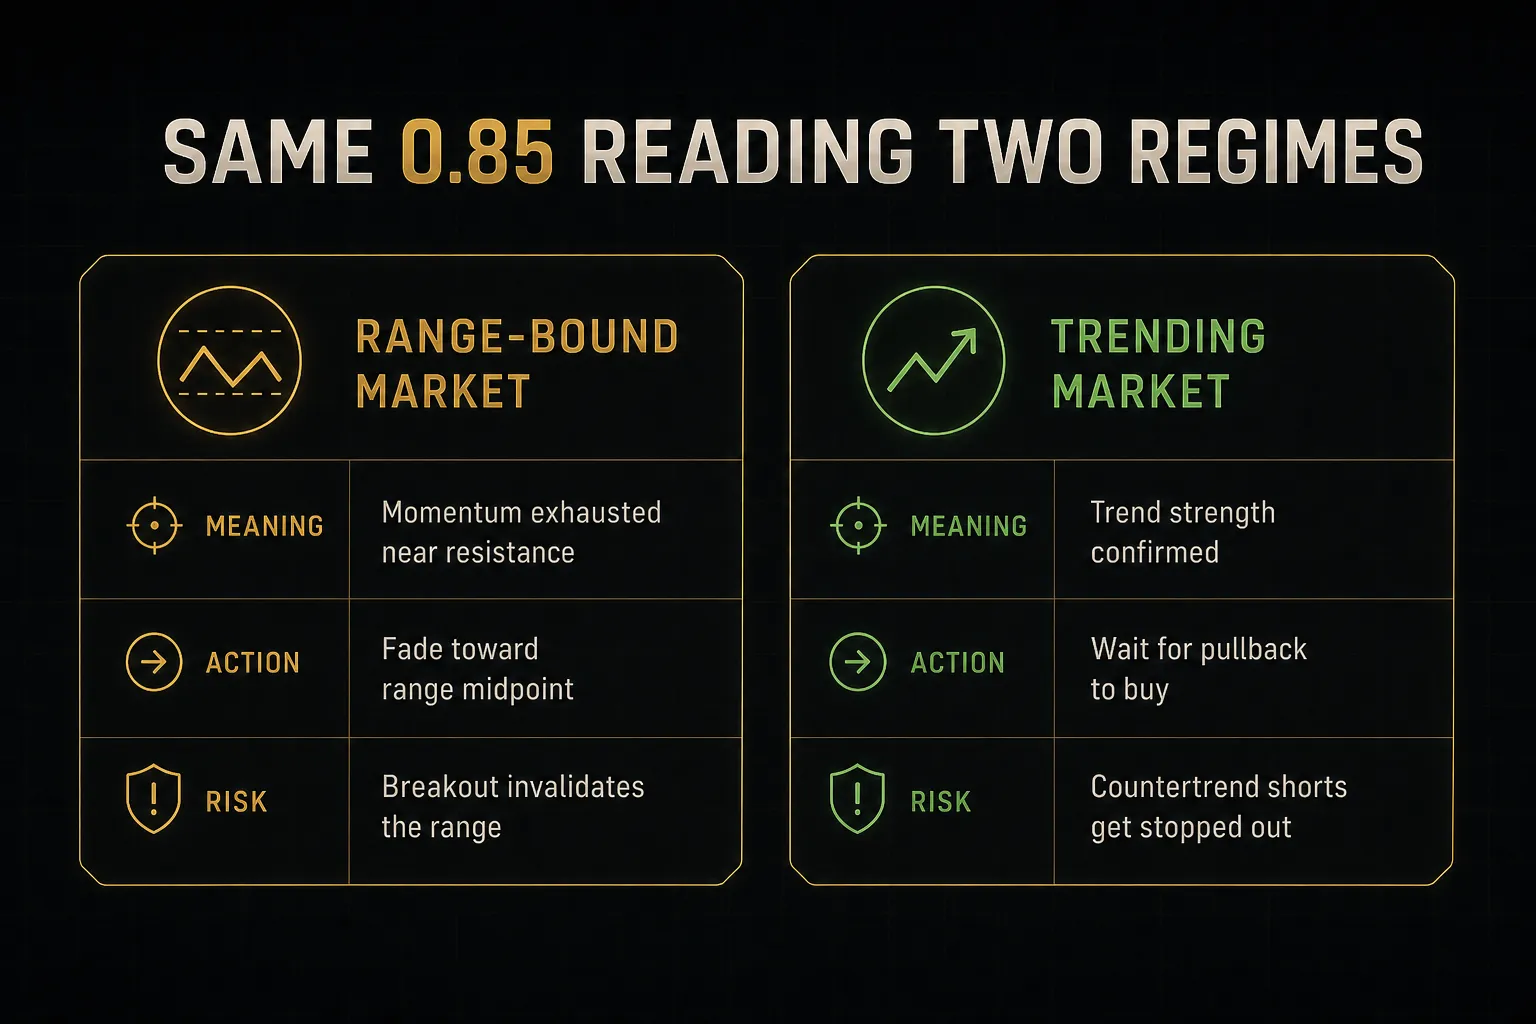
In a range-bound market, where price is bouncing between defined support and resistance, extremes work the way the textbook describes. Stoch RSI hits 0.90 near the range high, momentum exhausts, price rotates back down.
Mean reversion pays.
In a trending market, extremes confirm strength rather than warn of exhaustion. The tradeable event flips: in an uptrend you’re waiting for Stoch RSI to drop into the 0.20 zone during a pullback, then turn back up, giving you a discounted entry in the direction of the dominant trend.
So before reading a single value, answer one question: is this instrument trending or ranging? A 200-period moving average, ADX above or below 20, or a simple structure check of higher highs and higher lows all work as a trend filter. Pick one and apply it consistently.
The same 0.85 reading is a short signal in a range and a continuation signal in a trend.
The number didn’t change.
The context did.
Crossovers: Extreme Zone vs Midpoint
The standard trigger is a %K crossing %D. But not all crossovers carry equal weight, and where they occur matters more than that they occurred.
A crossover inside the extreme zone, say %K crossing below %D while both sit above 0.80, is a genuine momentum shift. RSI has stopped making new highs within its range and has started rolling over.
That’s a legitimate early warning of a pullback or reversal.
A crossover near the 0.50 midpoint is close to meaningless on its own. In the middle of the range, %K and %D braid together constantly, producing dozens of crosses that resolve nowhere.
Traders who take every one bleed out through commissions and slippage.
Practical filter: only act on crossovers that occur above 0.80 or below 0.20, and only when they align with your established bias. That one rule removes the majority of low-quality triggers without costing you much.
Anchoring Divergence to Real Swing Points
Divergence is where Stoch RSI earns its keep, but only when applied with discipline.
Bullish divergence occurs when price prints a lower low while Stoch RSI prints a higher low. Bearish divergence is the mirror: a higher high in price against a lower high in the oscillator.
Both suggest the move is running out of fuel.
The discipline part is anchoring. Connect oscillator points only to clearly defined swing highs and lows on price, pivots that a reasonable trader would identify without squinting. If you have to hunt for the right two points, you’re drawing a line that fits your bias, not the data.
And divergence alone is not an entry.
Because Stoch RSI is so fast, divergences form and fail constantly, especially on lower timeframes. Require price action confirmation: a close back above a broken swing high, a reclaim of a key level, a failed retest.
The oscillator suggests.
Price decides.
From Signal to Trade: A Complete Workflow
Setting Bias and Qualifying the Setup
Entry Trigger, Stop, and Position Size
Worked Example: Failed Signal vs Confirmed Pullback
Knowing what the indicator measures is step zero.
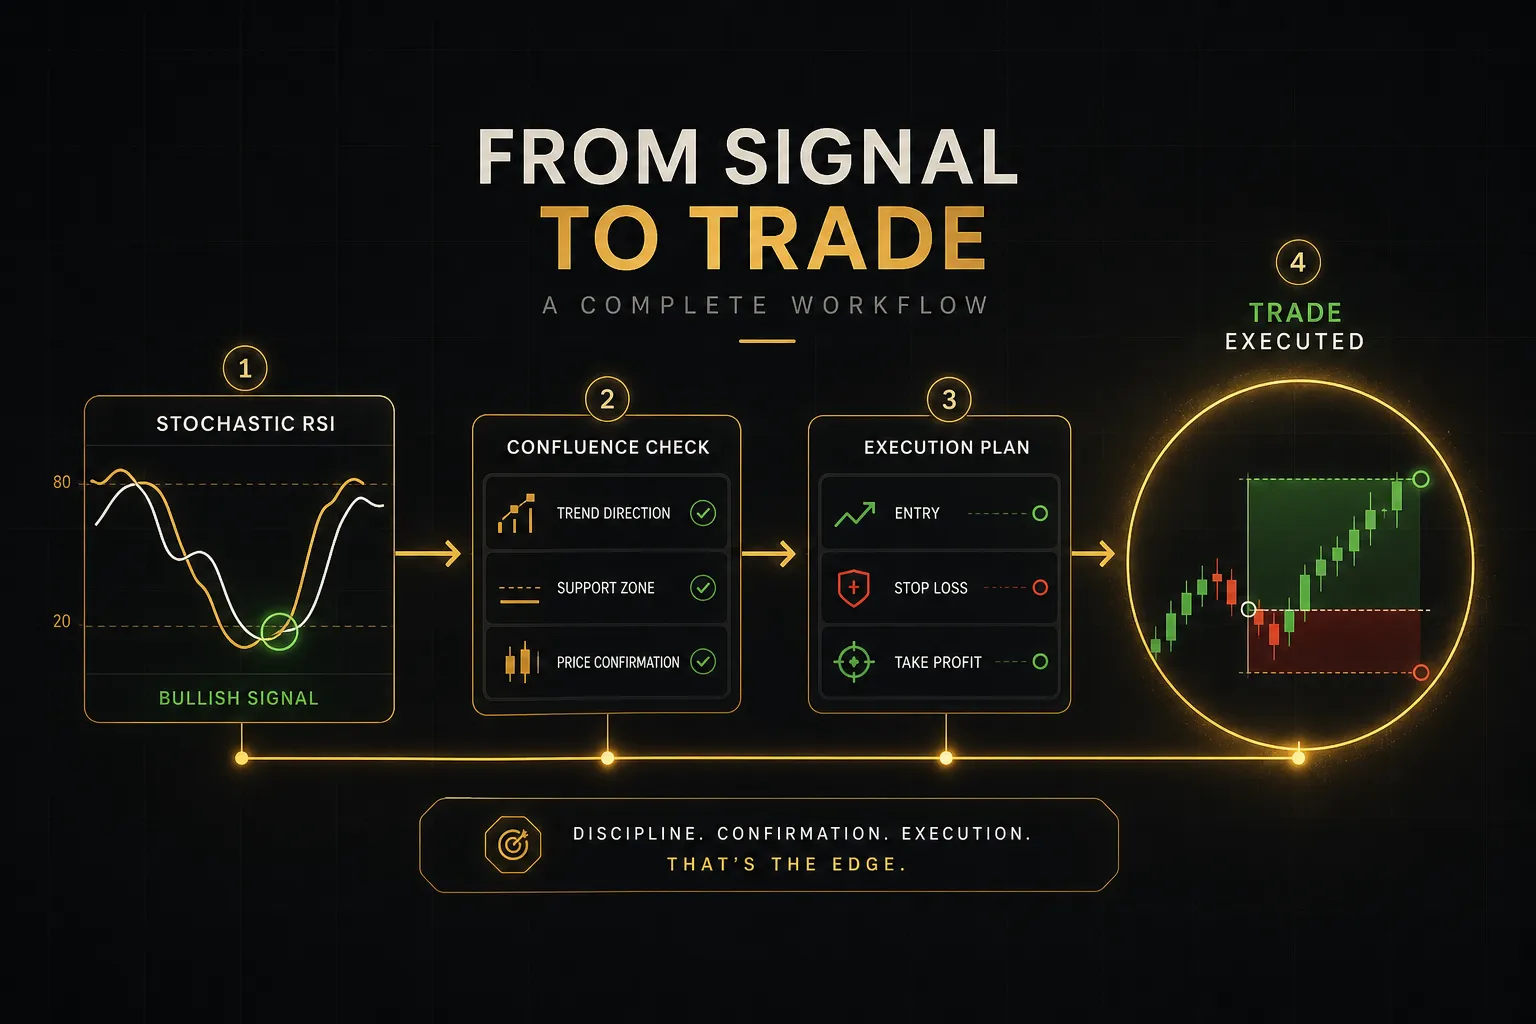
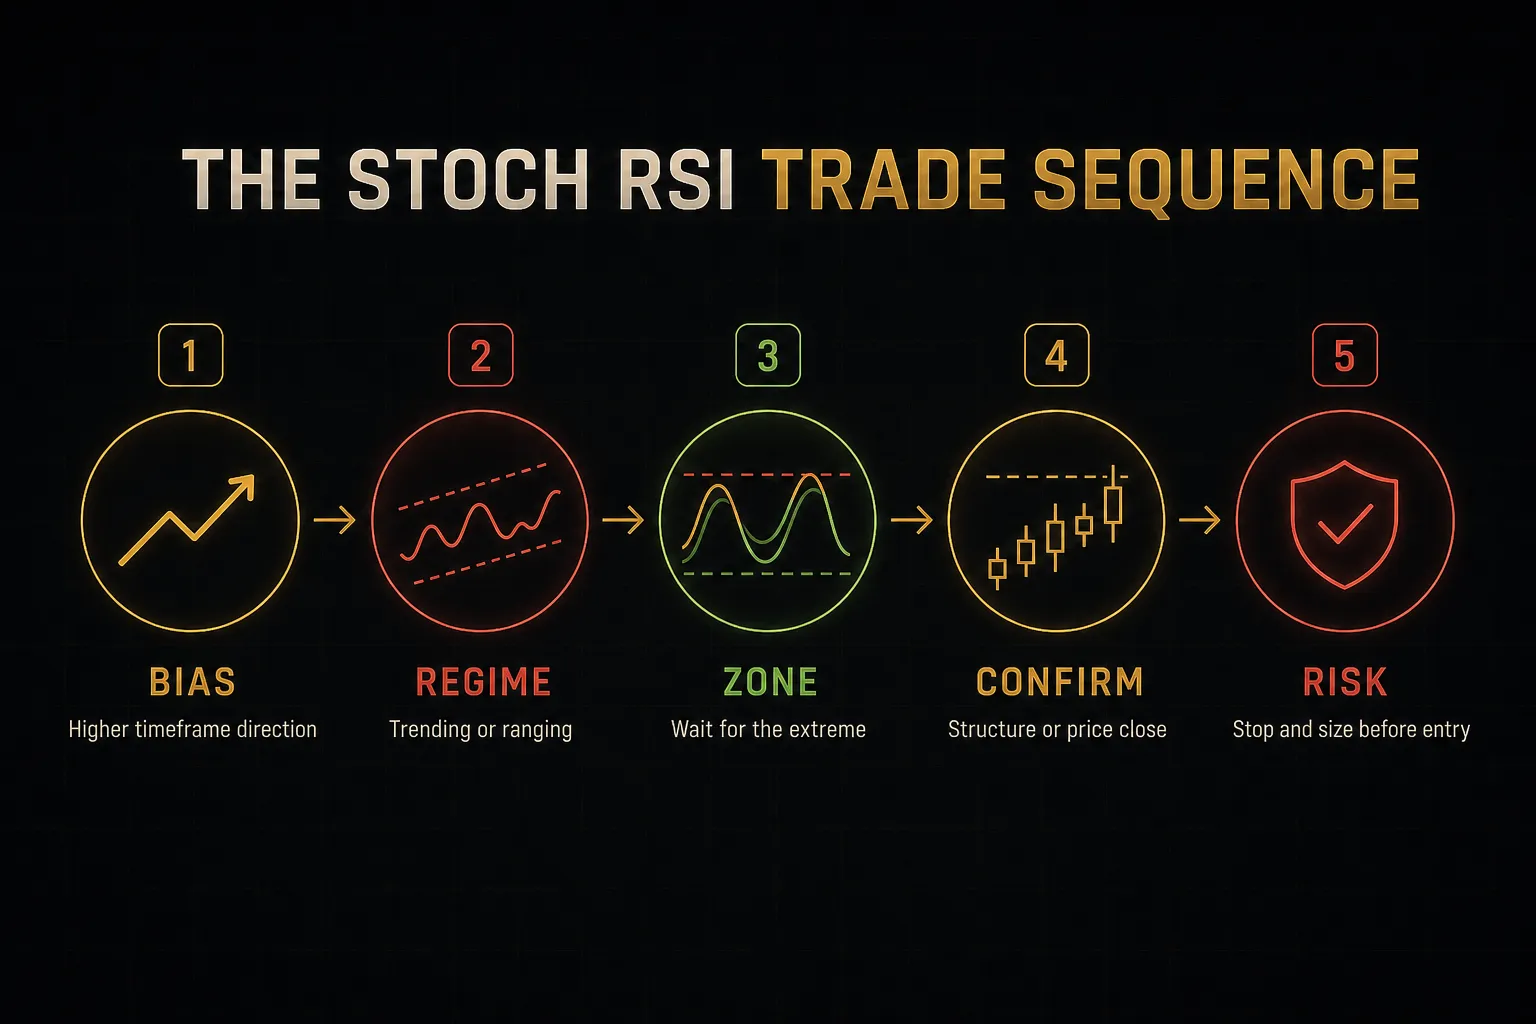
Turning that into a repeatable process is where results come from. Here’s the full sequence, in order, with nothing skipped.
- Establish higher-timeframe bias first. Before opening the oscillator, check the timeframe two or three steps above your trading timeframe. If you trade the 15-minute, your bias comes from the 4-hour. Structure, moving average slope, or an ADX reading gives you a direction: long-only, short-only, or stand aside.
- Classify the market regime. Trending or ranging determines whether extremes mean reversal or continuation. A market with ADX under 20 and overlapping candles is a range. Higher highs and higher lows with expanding bars is a trend. Get this wrong and every subsequent step is wrong too.
- Wait for Stoch RSI to reach the appropriate zone. In an uptrend bias, you want %K dropping into or below 0.20 during a pullback. In a downtrend bias, you want a rally pushing it above 0.80. You are never using the oscillator to pick direction, only to time entry within a direction you already chose.
- Demand a confirmation layer. This is what separates a valid setup from an oscillator blip. Acceptable confirmations include a break of a short-term structure high, a VWAP reclaim, a bullish engulfing close at a known support level, or a multi-timeframe alignment check such as PipTrend’s 12-timeframe confirmation table showing agreement across the chart hierarchy. One confirmation minimum. Two is better.
- Take the entry on the trigger candle close, not mid-candle. A %K/%D crossover inside the extreme zone plus a confirming price close is your trigger. Entering mid-bar because the lines look like they’re about to cross is how traders end up long into a candle that closes red.
- Place the stop against structure, not against the oscillator. Your invalidation point is the swing low that would break your setup thesis, usually a few ticks below the pullback low for a long. The Stoch RSI reading tells you nothing about where price becomes wrong. Structure does.
- Size the position from account risk, not conviction. Fix your risk at a set percentage per trade, commonly 0.5% to 1% of account equity. Position size = (account equity × risk %) ÷ (entry price − stop price). A 0.99 Stoch RSI reading does not justify doubling size. Extremeness of an oscillator value has no relationship to probability of success.
- Define the exit before you enter. A fixed multiple of your risk, such as 2R, or a structural target like the prior swing high. Optionally, use an opposite-extreme Stoch RSI reading as a partial-exit signal, since it does flag momentum exhaustion reasonably well in trending conditions.
- Log the trade and the reasoning. Record the bias, regime, confirmation used, and outcome. After thirty trades you’ll see which confirmation layers actually filter and which ones you added out of habit.
The failed signal. Picture a stock in a powerful uptrend, price riding above a rising 50-period moving average. Stoch RSI crosses above 0.80 on the daily and a trader shorts it. Over the next fifteen sessions, the oscillator stays above 0.80 nine separate times and price advances 11%.
There was no bias check, no regime classification, no confirmation.
The signal was real.
The decision was not.
The confirmed pullback. Same stock, same uptrend.
This time the trader waits.
Price pulls back to the rising 50-MA over six sessions and Stoch RSI drops to 0.12. On the seventh session, %K crosses above %D inside the oversold zone and price closes above the prior day’s high, holding the moving average.
Entry on that close, stop below the pullback low (2.1% away), size calculated for 0.75% account risk. Target at the prior swing high, roughly 2.5R.
Identical indicator.
Opposite outcomes.
The difference was entirely in the process wrapped around it.
Why Stochastic RSI Generates False Signals
False Signals During Strong Trends
The false signal problem is not a flaw someone forgot to fix.
It’s mathematically baked into the construction.
Remember that RSI is already bounded between 0 and 100. During a strong uptrend, RSI might oscillate in a narrow band between 62 and 78. The stochastic layer then normalises that 16-point band across the full 0 to 1 range.
A two-point RSI move, trivial in isolation, becomes a 0.13 swing in Stoch RSI.
That’s the amplification mechanism.
Small, meaningless movements in the underlying RSI get magnified into dramatic-looking oscillator swings. Near the extremes, where the range compresses further, the effect intensifies.
So in a trend, the indicator generates a continuous stream of exhaustion warnings that never resolve. Traders reading them as reversal signals get run over repeatedly, and then conclude the indicator “doesn’t work.”
It works fine.
It’s just answering a different question than they’re asking.
Timeframe Conflicts and Indicator Correlation
Two structural mistakes compound the noise problem.
The first is trading a fast lower-timeframe signal directly against a dominant higher-timeframe trend. A 5-minute Stoch RSI oversold cross means very little when the daily chart is in a clean downtrend with every rally being sold. Countertrend scalps off an oscillator extreme have low win rates and, more damagingly, terrible risk-reward, because the moves against the trend are small and the moves with it are large.
Check alignment first, always.
The second is redundancy disguised as confirmation. Traders stack RSI, Stochastic RSI, and the stochastic oscillator on one chart, then feel reassured when all three flash oversold together. But all three are derived from the same recent price momentum.
Their agreement carries almost no independent information.
Real confirmation comes from a different type of input: volume, market structure, a volatility measure, session context, or higher-timeframe alignment.
Three momentum oscillators agreeing is one opinion stated three times.
Platform Differences and Flat Readings
When Stoch RSI looks broken on your chart, it’s usually one of four things.
Thin or illiquid instruments. On low-volume small caps, exotic FX pairs, or micro-cap crypto, the RSI input itself becomes erratic because a handful of trades move price disproportionately. The stochastic layer then amplifies that noise into an unreadable mess.
Insufficient historical bars. A 14-period RSI feeding a 14-period stochastic with 3-period smoothing needs roughly 35 to 40 bars before it stabilises. Load a chart with 20 bars and you’ll see flat lines pinned at 0 or 1.
Not a bug.
Just not enough data.
Settings mismatched to volatility. Default 14, 14, 3, 3 was designed around daily equity charts. Applied to a 1-minute crypto chart, it produces near-constant extreme readings. Applied to a weekly chart of a low-volatility utility, it barely moves.
Adjust the indicator smoothing and lookback to fit the instrument’s actual behaviour.
Scale confusion. Again: 0 to 1 versus 0 to 100. Verify which your platform uses before setting alert levels, or you’ll build alerts that never fire.
One last warning about backtesting. Any Stoch RSI rule set will look profitable if you test enough parameter combinations on the same data.
That’s data snooping, and it produces edges that vanish live.
Test your rules on out-of-sample data you never optimised against, and model realistic transaction costs and slippage. A strategy generating 25 signals per 100 bars is extremely sensitive to costs.
At a half-tick of slippage per trade, many high-frequency oscillator systems that look good on paper are negative in practice.
Stochastic RSI FAQ
What is the best setting for Stochastic RSI?
There is no universal best setting, and any source claiming otherwise is selling something. The default 14, 14, 3, 3 suits swing analysis on daily charts, giving a reasonable balance between responsiveness and noise.
Faster settings such as a 9-period RSI lookback with 5-period stochastic lookback produce more signals on intraday charts, but the added responsiveness comes with substantially more false triggers. Increase the %K and %D smoothing values if your chart looks unreadable.
Test any change on out-of-sample data before trusting it.
Is Stoch RSI better than RSI?
Neither is better.
They solve different problems. RSI measures momentum against price and moves slowly enough to be readable on its own, making it strong for trend strength assessment and divergence analysis.
Stochastic RSI measures where RSI sits within its own range, generating roughly five times as many signals over the same period. That extra sensitivity is useful for timing entries inside a bias you already established, and actively harmful if you use it to pick direction.
How do you use the Stochastic RSI indicator?
Use it to time entries within a direction you’ve already determined, never to choose the direction itself. Establish higher-timeframe bias, classify whether the market is trending or ranging, then wait for the oscillator to reach an extreme that aligns with your bias.
Require a confirmation layer before entering: a structure break, a price close beyond a key level, or multi-timeframe agreement. Place the stop against price structure and size the position from a fixed account risk percentage.
What does Stochastic RSI 14 3 3 3 mean?
Those four numbers are the RSI lookback, the stochastic lookback, the %K smoothing, and the %D smoothing. In this labelling, 14 is the number of bars feeding the underlying relative strength index, and the following values control the stochastic range calculation and the two smoothing averages applied to the percentage K line and percentage D signal line.
Field order and labelling vary by platform, so verify which input is which before assuming your settings match someone else’s chart.
What is the difference between RSI and Stochastic RSI?
RSI is calculated from price, Stochastic RSI is calculated from RSI. That extra transformation makes Stoch RSI two steps removed from raw price action.
The practical consequence is amplification: small RSI movements become large oscillator swings, so Stoch RSI reaches extremes far more often and stays there longer during trends.
RSI plots on 0 to 100 with 30/70 thresholds. Stoch RSI typically plots 0 to 1 with 0.20/0.80 thresholds, though some platforms scale it to 100.
Does Stochastic RSI work for day trading?
It works for day trading only when paired with a defined bias and a confirmation step. Used as a standalone scalping trigger on 1-minute or 5-minute charts, it produces a high volume of signals that transaction costs and slippage will consume.
Day traders who use it successfully treat it as an entry-timing tool inside a higher-timeframe directional view, typically checking the 1-hour or 4-hour for bias before acting on anything under 15 minutes.
Treat It as One Input, Not the Answer
Everything in this article reduces to one shift in thinking. Stochastic RSI tells you that momentum is stretched relative to its own recent range. It does not tell you what price will do next.
Context supplies the meaning. In a range, a 0.90 reading near resistance is a fade opportunity. In a trend, the same reading is confirmation to hold, and the actual opportunity comes on the pullback that follows.
Same number, opposite trades.
Here’s the one thing to do before your next signal.
Write down, in advance, two things: your higher-timeframe bias and the specific confirmation you’ll require.
A structure break. A close above a level. Multi-timeframe agreement.
Whatever it is, commit to it in writing before the crossover happens, not while you’re watching the lines converge and feeling the pull to click.
That small act of pre-commitment is what stops a crossover from becoming a reflex.
Reliable results don’t come from finding a better oscillator or a magic parameter set. They come from a repeatable process: bias, setup, trigger, risk.
Every one of those four steps involves judgment that no indicator can make for you. Stoch RSI handles a narrow slice of the trigger step, and it handles that slice well.
Ask it to do more than that and it will disappoint you… every single time.
Risk Disclaimer: Trading involves risk. Past performance doesn't guarantee future results. Only trade with money you can afford to lose. PipTrend is a tool to assist your trading decisions, not financial advice.