The Supertrend Indicator Explained for Real Trading Decisions
On this page
Why Most Supertrend Guides Fall Short
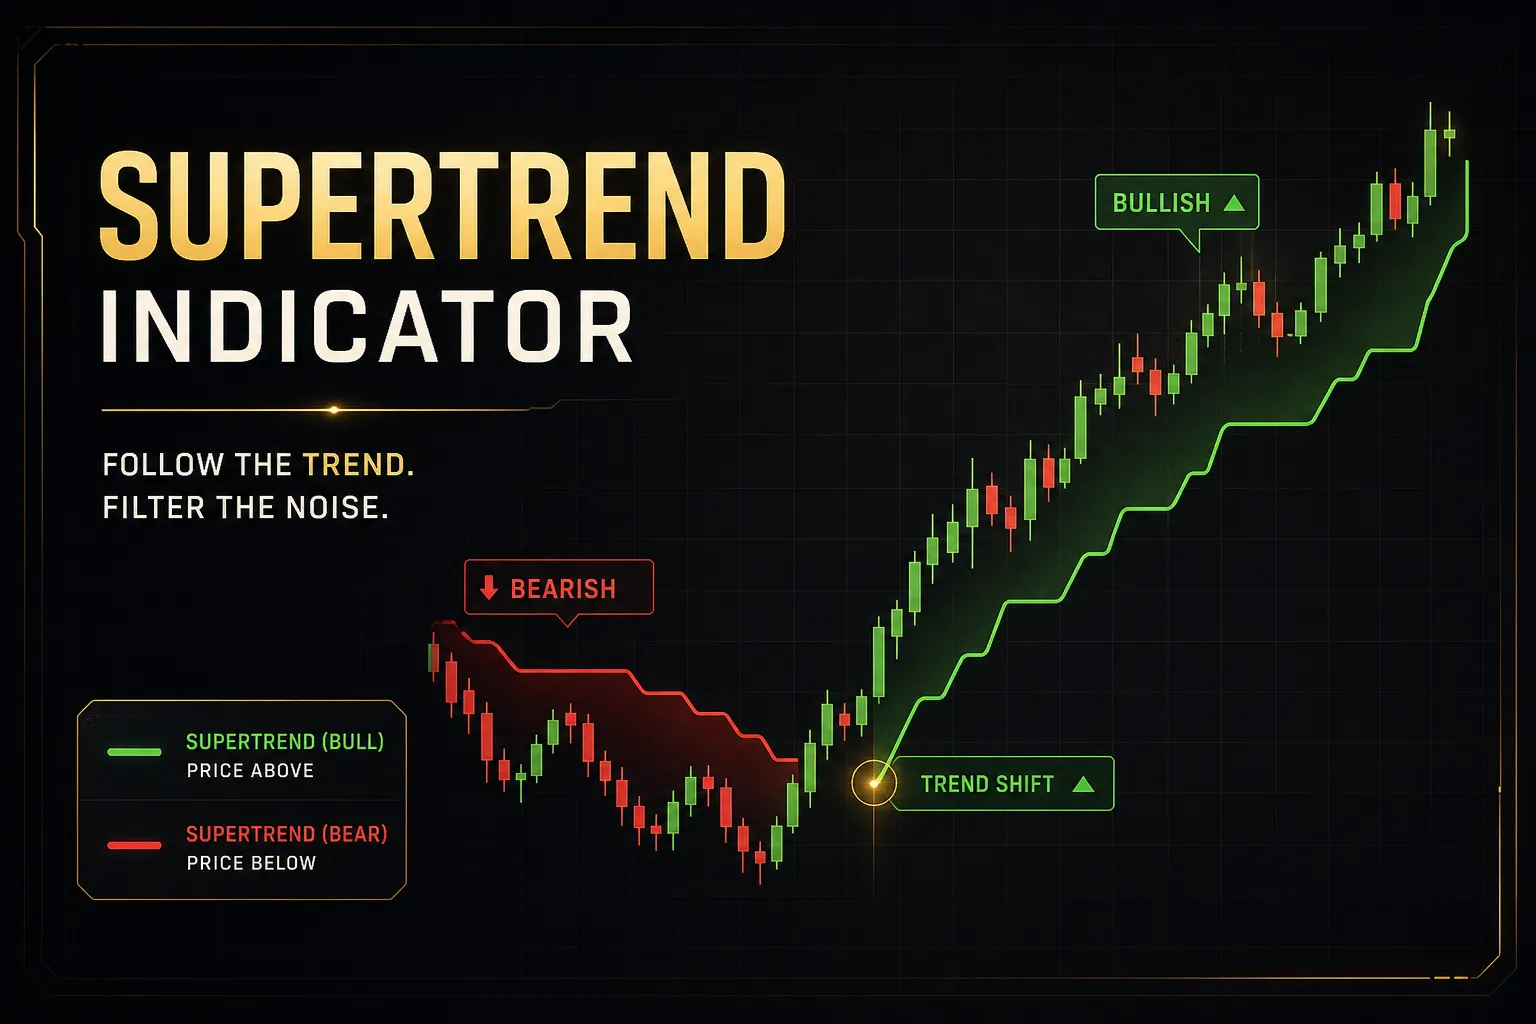
Search for “supertrend indicator” and you’ll find hundreds of articles that say the same thing: green line means buy, red line means sell.
That’s technically true.
It’s also how traders lose money.
The Supertrend indicator is a volatility-adjusted trend line, and like every trend-following indicator, it has a failure mode that nobody puts in the headline.
It gets shredded in sideways markets. It flips mid-candle and reverses before close.
And the default settings that work beautifully on a daily stock chart can produce whipsaw after whipsaw on a five-minute forex pair.
This guide takes a different angle.
Instead of stopping at the color of the line, it covers the decisions that actually determine whether Supertrend helps or hurts you: how to tune the ATR period and multiplier for your market, how to spot the range-bound conditions where the indicator breaks down, how to build a confirmation process around candle-close signals and the higher-timeframe trend, and how to size positions when the ATR-based stop is wide.
Supertrend works on stocks, forex, crypto, futures, and indices.
But it behaves differently in each.
We’ll unpack exactly how, and what to do about it.
How Supertrend Actually Calculates Direction
Here’s something most traders using Supertrend can’t answer: why does the line sometimes hug price tightly and sometimes sit far away? The answer is in the formula, and understanding it changes how you read every signal.
The ATR and Band Formula
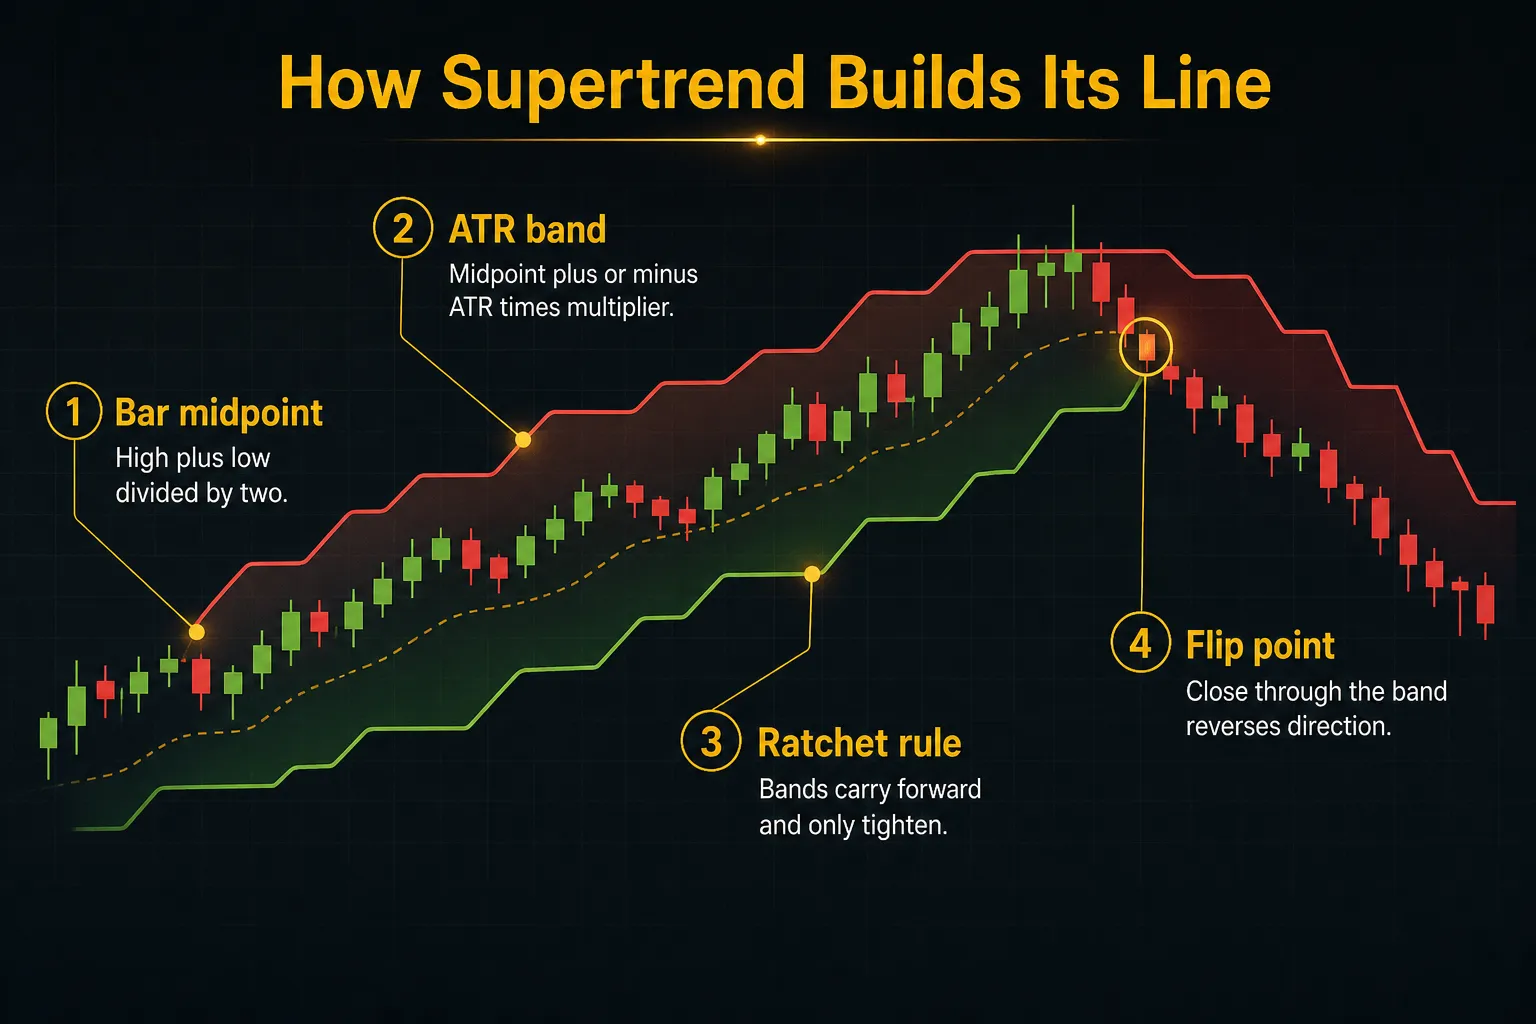
Supertrend is built on the Average True Range, a measure of how much an instrument typically moves per bar. The calculation starts with two basic bands:
The basic upper band is (high + low) / 2 plus the ATR multiplied by a chosen factor. The basic lower band is (high + low) / 2 minus that same ATR-multiplier product.
In other words, the indicator draws a channel around the midpoint of each bar, and the width of that channel expands and contracts with volatility.
But here’s the part that matters.
The final bands don’t recalculate fresh on every bar. The final upper band only moves down (or holds) while price stays below it, and the final lower band only moves up (or holds) while price stays above it.
Each band carries forward from the previous bar unless price forces a reset.
This ratcheting behavior is why the Supertrend line acts as dynamic support and resistance. In an uptrend, the line below price can only rise or stay flat, never retreat.
Price closing through that line is what triggers a flip from bullish to bearish, and vice versa.
One misconception worth killing right now: ATR does not measure direction. It measures the magnitude of movement only.
A rising ATR means bigger bars, not bullish bars.
Plenty of traders treat expanding ATR as a buy signal, and that’s simply reading the tool wrong.
Direction comes entirely from price closing through the band, not from the ATR itself.
What the 10 and 3 Settings Mean
Open Supertrend on almost any platform and you’ll see the defaults: 10 and 3.
The 10 is the ATR period, meaning volatility is averaged over the last 10 bars. The 3 is the ATR multiplier, meaning the bands sit three ATRs away from the bar midpoint.
These defaults are starting points.
Nothing more.
They were never optimized for your instrument, your timeframe, or 2026 market conditions. A 10, 3 configuration that filters noise well on a daily S&P 500 chart may be far too slow for scalping EUR/USD on a one-minute chart, and far too twitchy for a low-liquidity altcoin.
Treat 10, 3 the way you’d treat factory suspension settings on a race car.
Fine for the drive home.
Not what you compete with.
Leading, Lagging, or Both?
Traders argue endlessly about whether Supertrend leads or lags. The honest answer: it lags by construction.
The flip only happens after price has already closed through the band, so the trend change is confirmed after it starts, never before.
So why does it feel leading to some traders? Because compared to a slow tool like a 50-period exponential moving average, Supertrend reacts quickly.
The ATR-based band adapts to volatility in real time, so flips often arrive earlier than a moving average crossover would.
Supertrend doesn’t predict trend changes. It confirms them faster than most alternatives. That distinction shapes how you should trade it.
Reading and Trading Supertrend Signals
A flip from red to green looks decisive on a chart.
In live trading, it’s messier than that.
The difference between a confirmed signal and an intrabar head-fake is where most Supertrend losses actually come from.
Confirming Signals on Candle Close
Here’s the trap.
During a live bar, price can push through the Supertrend band, flip the line to green, and then pull back below the band before the candle closes.
The flip vanishes.
If you entered the moment the color changed, you’re now holding a position based on a signal that no longer exists.
This is intrabar noise, and it’s brutal on lower timeframes where a single burst of volume can pierce the band for thirty seconds.
The fix is simple discipline: candle-close confirmation. A Supertrend signal only counts when the bar that produced it has fully closed.
Yes, waiting costs you a few pips or cents of entry price.
But the alternative is taking every fake-out the market throws at you.
Over a hundred trades, the confirmed-close rule is almost always the cheaper policy.
Placing Stops and Managing Exits
The Supertrend line is a natural trailing stop.
In a long trade, the line sits below price and ratchets upward as the trend develops, giving you a logical, volatility-adjusted exit level that tightens as the move matures. Many traders use Supertrend purely for this, entering on other signals and trailing out on the flip.
But there’s a position sizing consequence most guides skip.
When ATR is high, the Supertrend line sits far from price, which means your stop is wide.
The correct response is to reduce position size so your dollar risk stays constant, not to accept a bigger loss because “that’s where the indicator says the stop goes.”
If you normally risk 1% of your account per trade and the ATR-based stop is twice as wide as usual, you take half the size.
Same risk, adapted structure.
This is how volatility-adjusted stops and fixed-fractional position sizing work together instead of against each other.
It also helps to be clear about which of three distinct jobs you’re asking Supertrend to do:
As a directional filter, it tells you which side of the market to trade and nothing else. As an entry trigger, the flip itself is your signal to act. As a trailing-exit mechanism, it manages an open trade.
These are different applications with different strengths, and mixing them carelessly (entering on a flip, then exiting on the same line two bars later in chop) produces exactly the churn that gives the indicator a bad name.
Does Supertrend Repaint?
No, confirmed Supertrend signals do not repaint.
Once a bar closes and the flip is locked in, that historical signal never changes. What people call “repainting” is almost always live-bar movement: the line and its color can shift while the current candle is still forming, because the calculation updates tick by tick until the close.
Platform differences add to the confusion. Some implementations plot the flip provisionally during the bar, others wait for close, and some alert systems (including default TradingView alerts) can fire on intrabar conditions if configured that way.
If your alert fires and the signal later “disappears,” the indicator didn’t repaint.
Your alert was set to trigger before confirmation.
The practical rule: set alerts to trigger on bar close, and evaluate all backtests on closed-bar data only.
Tuning Settings for Different Markets
Ask ten profitable traders for their Supertrend settings and you’ll get ten different answers.
That’s not a contradiction.
It reflects a real trade-off that you have to resolve for your own market and timeframe.
Faster Settings vs Wider Settings
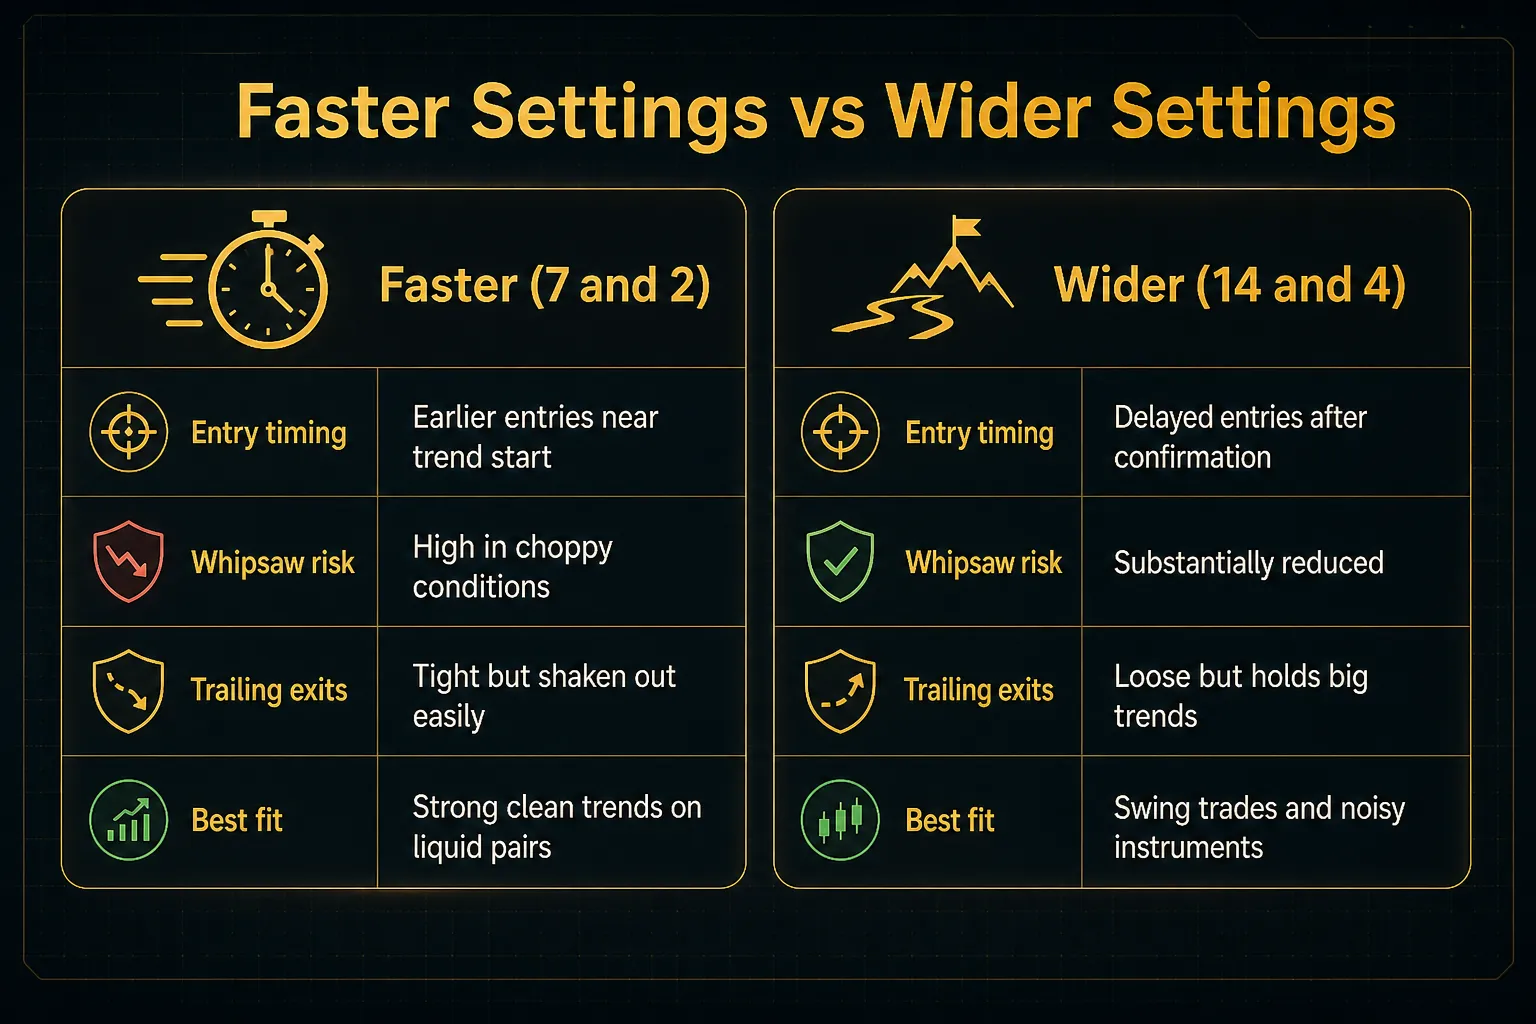
Lower ATR periods and smaller multipliers (say 7 and 2) make the bands hug price. You get earlier entries and tighter trailing stops, but you also get flipped out by ordinary noise.
More signals, more whipsaws.
Higher values (say 14 and 4) push the bands further out. Whipsaws drop dramatically, but entries arrive later and you give back more profit before the trailing exit triggers.
Fewer signals, more lag.
Neither is “better.”
A scalper trading momentum bursts needs speed and accepts noise. A swing trader on daily charts needs to survive pullbacks and accepts lag.
The mistake is running one configuration everywhere and blaming the indicator when it underperforms.
Day Trading, Forex, Crypto, and Stocks
Each asset class throws its own curveballs at Supertrend.
Forex has session transitions.
Spreads expand sharply during the daily rollover window, and high-impact news like NFP or central bank decisions can spike ATR and trigger flips that reverse within minutes. Many forex traders simply stand aside for 15 to 30 minutes around scheduled news rather than trusting any flip that occurs inside it.
Crypto trades 24/7 with no session close, so there’s no natural daily reset and weekend liquidity thins out noticeably.
Prices also differ slightly between exchanges, meaning your Supertrend on Binance data may flip a bar earlier or later than the same settings on Coinbase data.
On low-liquidity pairs, thin order books produce erratic wicks that pierce bands and cause junk flips.
Stocks gap overnight, which can jump price straight through the Supertrend line and produce a flip at the open with no tradeable entry near the signal level. Index futures behave more smoothly but carry their own session-open volatility bursts.
Here are reasonable starting points by context.
Note the word starting.
Every one of these needs forward-testing on your specific instrument before real money touches it.
| Asset Class / Style | Typical Timeframe | Starting Settings (ATR Period, Multiplier) | Key Caveat |
|---|---|---|---|
| Intraday scalping (forex, indices) | 1 to 5 minute | 7, 2 to 10, 2 | Avoid session rollover and news windows |
| Forex intraday | 15 minute to 1 hour | 10, 3 | Filter with the 4-hour higher-timeframe trend |
| Crypto majors (BTC, ETH) | 1 hour to 4 hour | 10, 3 to 12, 3.5 | Expect thinner weekend liquidity and wider wicks |
| Crypto altcoins | 4 hour | 14, 4 | Widen the multiplier to survive erratic spikes |
| Stock swing trading | Daily | 10, 3 to 14, 3 | Overnight gaps can invalidate signal-level entries |
| Index/futures position trades | Daily to weekly | 14, 4 | Fewer signals; pair with position sizing discipline |
Resist the urge to optimize these to two decimal places on historical data. A setting of 11.7 and 2.93 that “beat” 10 and 3 in a backtest is almost certainly overfitting, and it will fall apart the moment market conditions shift.
Building a Full Confirmation Process
A flip is information, not an instruction.
The traders who make Supertrend work treat every signal as a hypothesis that has to pass through a filter before it becomes a trade. Here’s how to build that filter properly.
Why Range-Bound Markets Break Supertrend
Supertrend has one structural weakness, and it’s not subtle.
In a sideways market, price oscillates back and forth through the bands, producing a bullish flip near the top of the range and a bearish flip near the bottom.
You buy high, sell low, and repeat.
Five or six consecutive whipsaw losses in a tight range is completely normal, and it’s the single biggest destroyer of confidence in the indicator.
The market spends a lot of time doing exactly this.
Depending on the study and timeframe, trending conditions account for maybe 30 to 40% of price action. The rest is consolidation, which means the majority of raw Supertrend flips occur in the regime where the indicator performs worst.
So the real skill isn’t reading the signal.
It’s reading the market regime before you accept the signal. Three practical checks:
First, look at price structure.
Trending markets print higher highs and higher lows (or the inverse). If the last several swings are overlapping and horizontal, you’re in a range and every flip is suspect.
Second, use a trend-strength gauge like the average directional index. An ADX reading below roughly 20 signals weak directionality, which is a yellow flag for any trend-following indicator.
You don’t need to trade ADX; you just need it as a regime thermometer.
Third, measure the recent price band. If the last 20 bars fit inside a range barely wider than one or two ATRs, there isn’t enough directional energy for a flip to mean anything.
Confirmation Tools That Add Real Value
The classic beginner mistake is stacking three trend indicators (Supertrend, a moving average, and MACD histogram color, say) and calling it confirmation.
It isn’t.
Those tools mostly measure the same thing, so they agree together and fail together.
Real confirmation comes from tools that answer a different question.
The relative strength index answers the exhaustion question. If Supertrend flips bullish but RSI is already above 70, the move may be stretched and due for a pullback.
That’s information Supertrend cannot give you.
MACD answers the momentum-shift question. A bullish Supertrend flip backed by a fresh MACD crossover tells you momentum is turning in the same direction, not just fading.
A flip with MACD still pointed the other way deserves skepticism.
An exponential moving average like the 200 EMA answers the baseline question: which side of the long-term trend are we on?
Taking only Supertrend longs above the 200 EMA and only shorts below it is one of the simplest and most effective filters available. Intraday traders often substitute VWAP for the same role.
Then there’s the most powerful filter of all: the higher-timeframe trend.
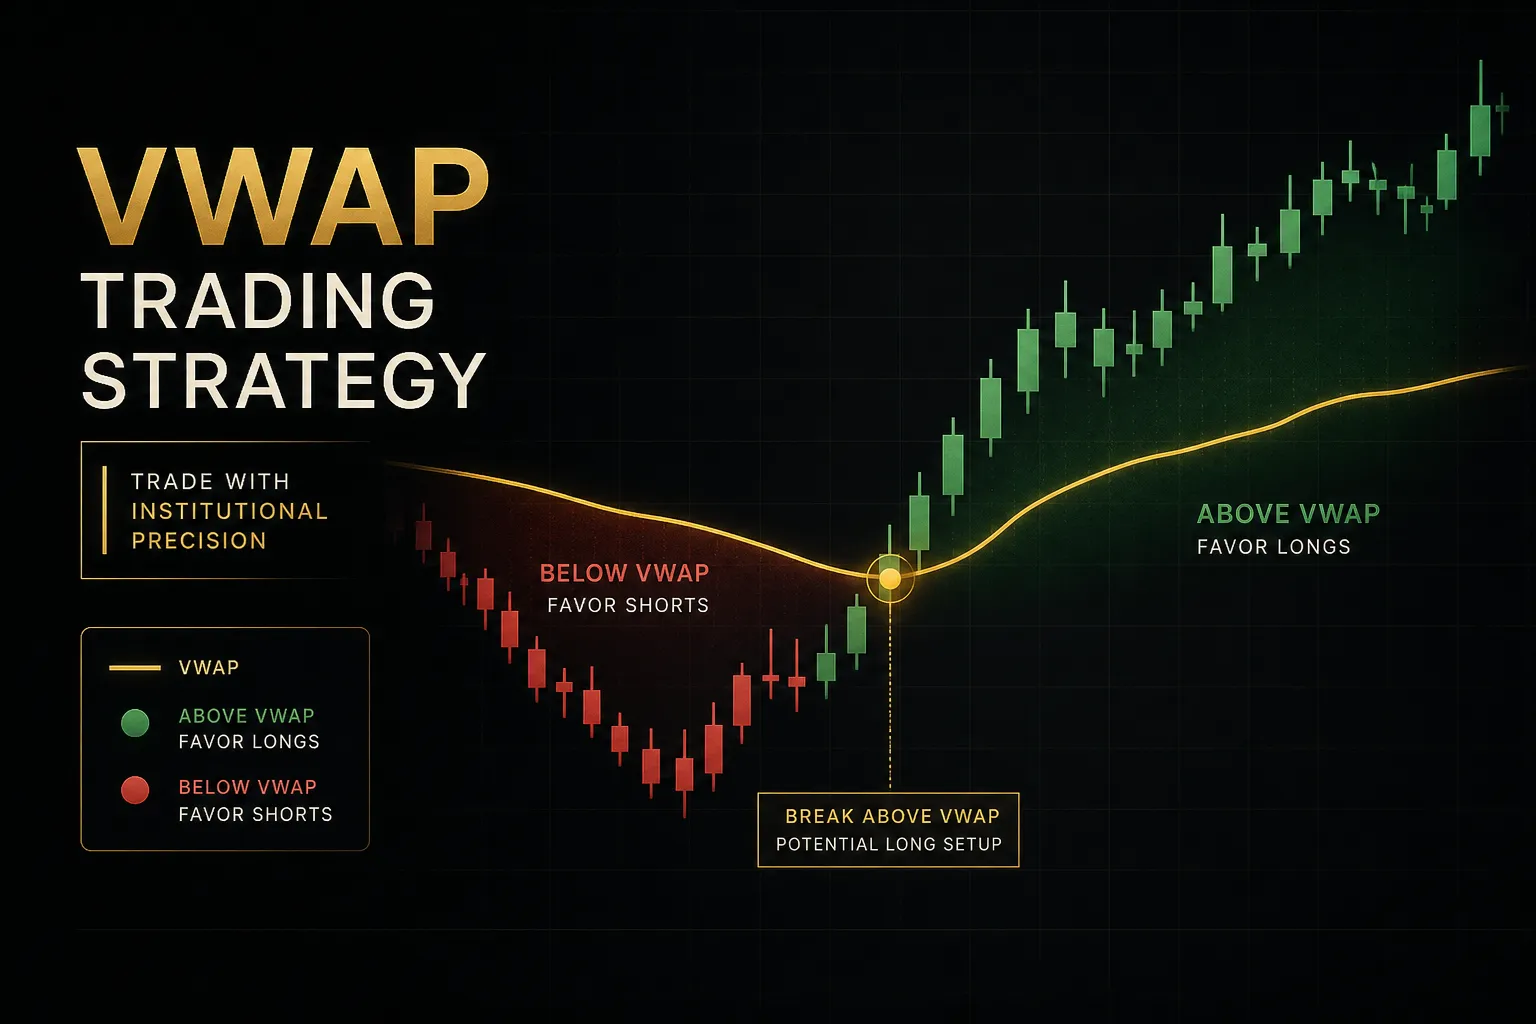
The workflow is simple. Check Supertrend direction on a timeframe four to six times larger than your execution chart. If the 4-hour Supertrend is bullish, you only take bullish flips on the 1-hour chart and ignore bearish ones as counter-trend noise.
This one rule eliminates a huge share of range-market whipsaws automatically.
Checking a dozen timeframes manually gets tedious fast, which is why some traders systematize it.
PipTrend, for example, offers a 12-timeframe alignment dashboard that shows Supertrend-style direction across every timeframe at a glance, plus non-repainting signal locking so a confirmed signal can’t quietly change after the fact.
Whether you use a tool like that or build your own checklist, the principle is the same: confluence should be structured and repeatable, not eyeballed differently every trade.
A Backtesting Checklist Before You Trust It
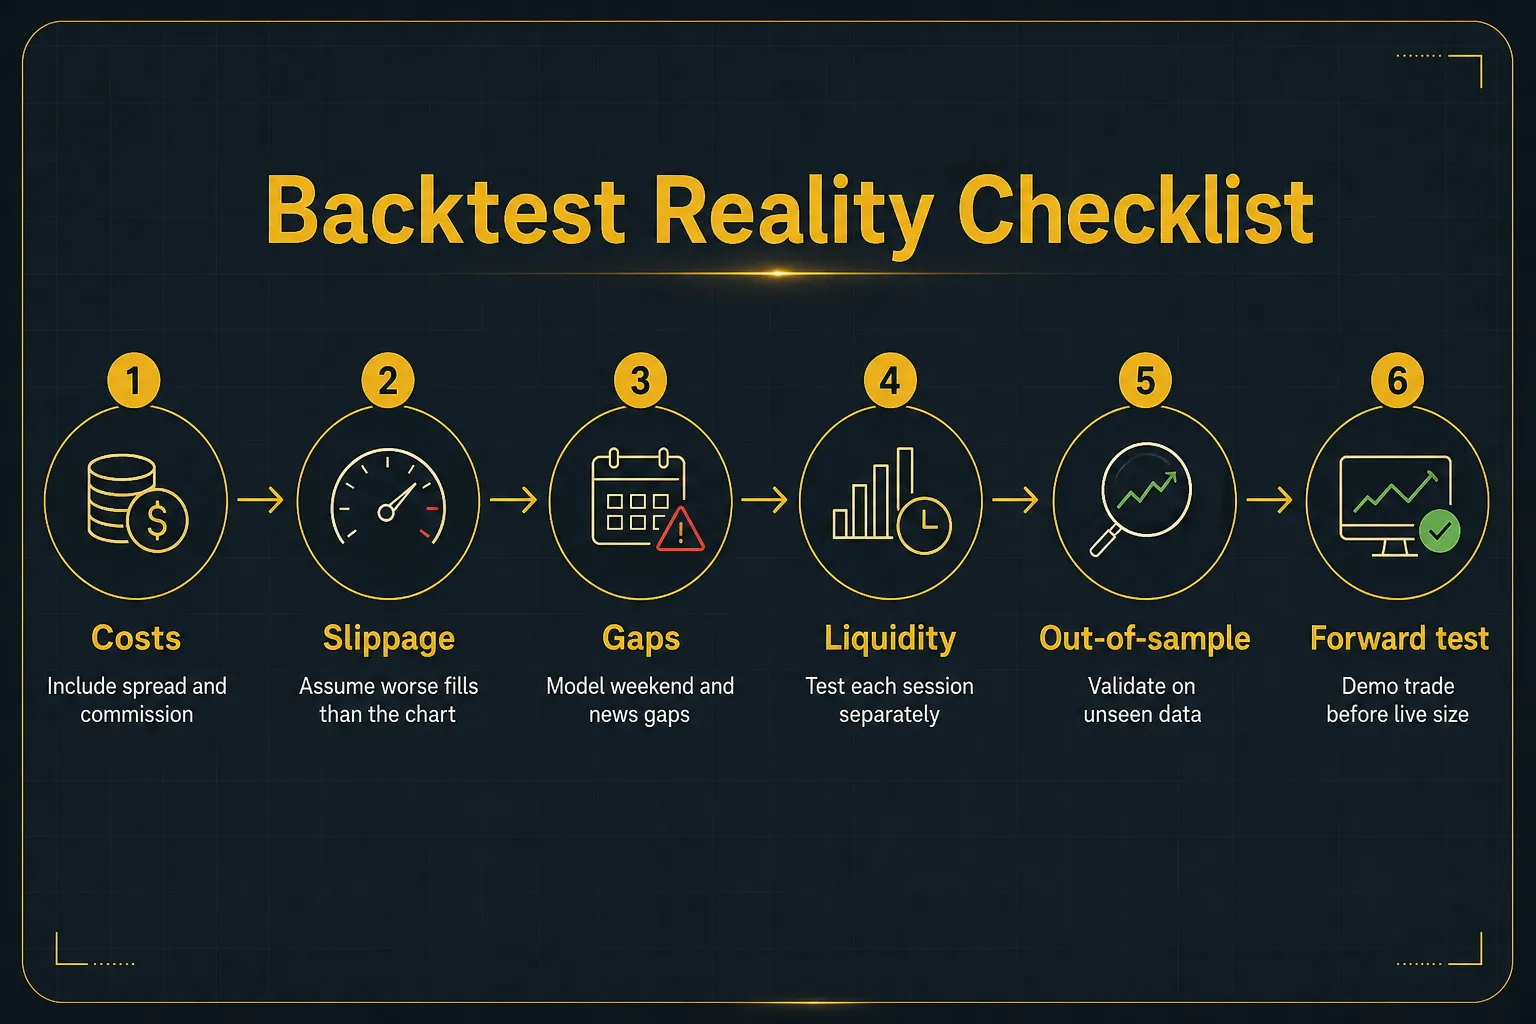
A backtest that ignores trading costs is fiction.
Before you trust any Supertrend configuration, your test needs to account for the frictions that eat real returns:
The out-of-sample step deserves emphasis.
Optimize your settings on one chunk of history, then validate on data the optimization never saw. If performance collapses on the unseen data, you’ve overfit, and the settings are memorizing the past rather than capturing anything durable.
Out-of-sample testing is the single best defense against this.
When you review losing trades, classify them.
Was it a genuine trend failure? Range noise you should have filtered? A news shock no indicator could catch? Poor execution on your part? Or parameters unsuited to the instrument?
Each category has a different fix, and lumping them together as “the indicator lost” teaches you nothing.
And stop chasing win rate.
A Supertrend system with a 40% win rate and a 2.5-to-1 risk-reward ratio is solidly profitable, because expectancy (average win times win rate, minus average loss times loss rate) is what compounds your account.
Trend-following systems routinely win less than half the time and still make money by letting winners run.
Judge your system on expectancy and maximum drawdown, not on how often it feels good.
A 40% win rate with 2.5-to-1 reward-to-risk beats a 65% win rate with 0.8-to-1. Expectancy pays the bills. Win rate just flatters the ego.
Common Questions About Supertrend
What is the best setting for the Supertrend indicator?
There is no single best setting; the default 10, 3 (ATR period of 10, multiplier of 3) is a reasonable starting point, not an optimum.
Faster settings like 7, 2 suit intraday scalping on liquid instruments, while wider settings like 14, 4 suit daily-chart swing trading and volatile crypto pairs.
Whatever you choose, validate it with out-of-sample testing on your specific instrument before trading live.
How accurate is the Supertrend indicator?
Supertrend’s raw signal accuracy is typically below 50% in mixed conditions, and that’s fine, because accuracy is the wrong metric.
Trend-following systems profit through expectancy: modest win rates paired with winners that run several times larger than losers.
Judge Supertrend by expectancy, risk-reward ratio, and drawdown, and improve it by filtering signals with the higher-timeframe trend and regime checks rather than chasing a higher win rate.
Is Supertrend good for day trading?
Yes, Supertrend works for day trading if you tighten the settings, wait for candle-close confirmation, and avoid known chop windows.
On 1 to 15 minute charts, use faster parameters, stand aside during forex rollover and high-impact news, and filter entries with VWAP or the higher-timeframe direction.
Without those filters, intraday noise will generate constant whipsaw flips.
Which indicator is best to combine with Supertrend?
The most valuable pairings answer questions Supertrend can’t: ADX for trend strength, RSI for momentum exhaustion, and a 200 EMA or VWAP as a directional baseline.
Avoid stacking additional trend-following indicators, since they duplicate what Supertrend already measures and fail at the same moments.
The higher-timeframe Supertrend direction itself is arguably the single best filter.
Does the Supertrend indicator repaint?
No, Supertrend does not repaint on closed bars; a confirmed flip is permanent in the historical data.
The line and color can move during the live bar because the calculation updates until the candle closes, which is why some traders mistakenly report repainting.
Set alerts to fire on bar close and the issue disappears entirely.
Is Supertrend a leading or lagging indicator?
Supertrend is a lagging indicator by construction, since a flip only occurs after price has already closed through the ATR band.
It often feels faster than tools like a 50-period moving average because its volatility-adjusted bands adapt in real time, but it confirms trend changes rather than predicting them.
Trade it as a confirmation and exit tool, not a forecast.
The One Rule That Matters Most
If you take one thing from this guide, take this: never act on a Supertrend flip until the candle closes and the signal agrees with the higher-timeframe direction. Those two conditions, applied without exception, eliminate the majority of the whipsaw losses that make traders abandon the indicator.
And remember what Supertrend is not.
It’s not a prediction engine. It won’t see news shocks coming, and it won’t save an account that ignores stop-loss discipline and position sizing.
No indicator does.
What it will do, tuned to your market and wrapped in a proper confirmation process, is keep you on the right side of real trends and get you out before they fully reverse.
Test your settings on your own instrument and timeframe first. Demo it, measure the expectancy, and only then trade live size.
The traders who skip that step fund the ones who don’t.
Sources
Risk Disclaimer: Trading involves risk. Past performance doesn't guarantee future results. Only trade with money you can afford to lose. PipTrend is a tool to assist your trading decisions, not financial advice.