
You load your chart at 7:00 AM New York session. EUR/USD looks bullish on the Daily, but the CCI indicator just hit +150. Do you buy the trend or wait for the pullback? You hesitate for twenty minutes. Price drops 40 pips, then reverses without you. The CCI crosses back above zero. You chase the entry and get stopped out fifteen minutes later when it reverses again. This happens because direction and entry are two different decisions, and most traders treat the CCI as a single answer to both questions.
The Commodity Channel Index (CCI) was developed by Donald Lambert in 1980 to measure price deviation from its statistical average. It oscillates above and below zero, with readings beyond +100 and -100 signaling potential overbought or oversold conditions. While originally designed for commodities, the cci indicator works across Forex, Crypto, Indices, and Stocks when applied systematically. The problem is not the indicator itself, but how traders apply it without multi-timeframe confirmation, institutional price levels, or a repeatable process for separating trend from entry timing.
Understanding CCI Calculation and Core Mechanics
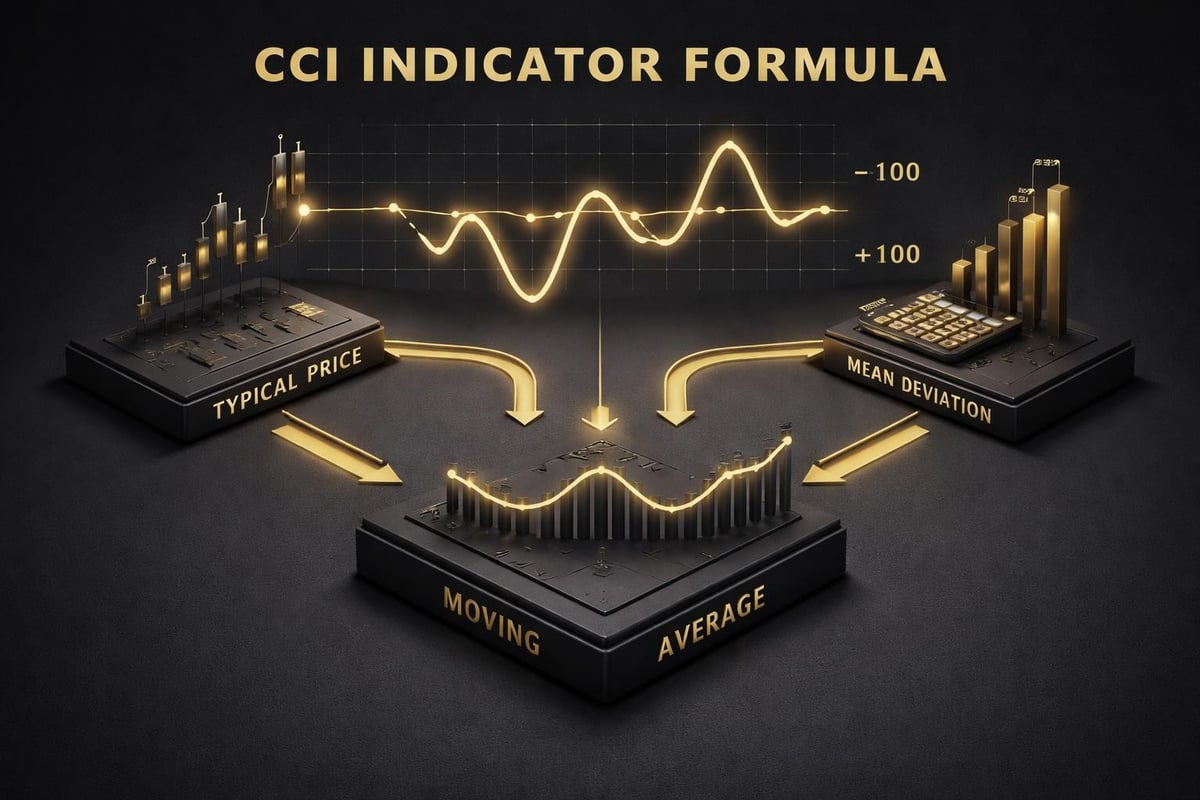
The cci indicator uses a specific formula: (Typical Price – Simple Moving Average) / (0.015 x Mean Deviation). Typical Price equals (High + Low + Close) / 3 for each candle. The standard period is 20, though you can adjust this based on your trading style and timeframe. A 20-period setting on the Daily chart behaves differently than on the 5-minute chart. You need to understand what the number actually measures before applying it.
The 0.015 constant ensures approximately 70-80% of CCI values fall between -100 and +100 under normal conditions. When price moves beyond these boundaries, the cci indicator signals statistical extremes. This does not mean automatic reversal. It means price has deviated significantly from its mean, which can indicate strong momentum continuation or exhaustion depending on context. You cannot trade the number alone without price action confirmation.
Default Settings Versus Optimized Parameters
Most platforms default to 20-period CCI. For day trading on 5-minute or 15-minute charts, consider testing 14-period for faster signals or 30-period for smoother, less noisy readings. Swing traders on H4 and Daily charts often use 20 or 30 periods. The key is consistency across your timeframes. If you use 20-period on Daily, use 20-period on H4 and H1 for coherent multi-timeframe analysis.
You can apply the cci indicator to different price inputs beyond typical price. Some traders use Close only, others use weighted calculations. Typical price (High + Low + Close / 3) remains standard because it incorporates the full candle range. Test your modifications on at least 100 trades with documented results before applying them live. Settings matter less than having a systematic approach to timing entries based on confirmed signals.
Reading CCI Signals Across Multiple Timeframes
The cci indicator crossing above zero on the 5-minute chart means nothing if the H1 and H4 are oversold at -180. You need timeframe alignment. Start with your highest timeframe for directional bias, then move down for entry precision. For day traders, that means Daily for bias, H4 for setup, H1 for trigger, 15-minute for entry. For swing traders, Weekly for bias, Daily for setup, H4 for trigger.
When the Daily cci indicator crosses above +100, you have strong bullish momentum. If H4 shows CCI at +150 while H1 just crossed above zero, you have divergence between timeframes. Wait for alignment. The best entries occur when the higher timeframe shows momentum (CCI above +100 or below -100) while the lower timeframe pulls back to zero or slightly beyond, then reverses in the direction of the trend. This creates high-probability, high-reward setups with clear invalidation points.
Overbought and Oversold Conditions
CCI above +100 indicates overbought conditions. CCI below -100 indicates oversold conditions. This does not mean reversal is imminent. In strong trends, the cci indicator stays above +100 for extended periods. You will see readings of +200, +250, even +300 during parabolic moves. Trading against these readings without confirmation will drain your account quickly.
Instead, use overbought and oversold levels to identify potential exhaustion zones where you can take profit on existing positions or wait for confirmation before entering new trades. When CCI reaches +200 on your entry timeframe while your directional timeframe shows divergence (price making higher highs while CCI makes lower highs), you have a warning signal. Tighten stops, scale out partial positions, or avoid new entries until alignment returns.
| CCI Level | Market Condition | Action for Trend Traders | Action for Counter-Trend Traders |
|---|---|---|---|
| Above +200 | Extreme Overbought | Trail stops, scale out | Wait for bearish divergence + price action |
| +100 to +200 | Strong Bullish | Hold, add on pullbacks to zero | Avoid shorts |
| -100 to +100 | Normal Range | Wait for directional break | Range-bound strategies |
| -100 to -200 | Strong Bearish | Hold shorts, add on rallies to zero | Avoid longs |
| Below -200 | Extreme Oversold | Trail stops, scale out shorts | Wait for bullish divergence + price action |
Combining CCI With Price Action and Support Resistance
The cci indicator alone cannot tell you where to place your entry. You need confluence with actual price levels. When CCI crosses above zero, check where price is relative to recent highs and lows, VWAP, session open, and major support/resistance zones. An entry at a clean demand zone with CCI confirmation carries more weight than a CCI signal in the middle of a range.
Look for CCI oversold conditions (-150 or lower) occurring at established support levels on your chart. When price touches a Weekly support zone while the Daily cci indicator reaches -180, then both H4 and H1 show bullish divergence (price making lower lows while CCI makes higher lows), you have a high-probability long setup. Your entry triggers when CCI crosses back above -100 and price breaks above the previous candle high. Your stop sits below the support zone with a clear invalidation point.
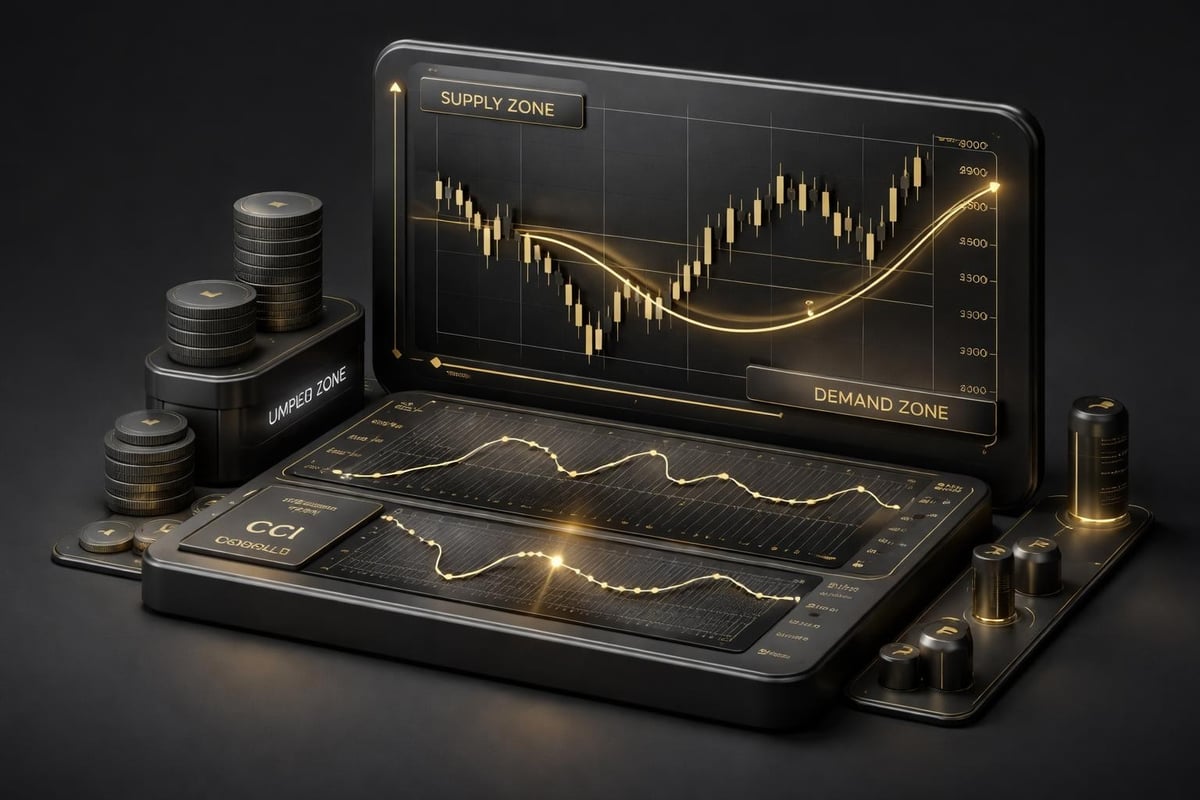
The same process applies for shorts. Wait for CCI overbought readings (+150 or higher) at established resistance, preferably coinciding with session highs, VWAP rejection, or supply zones. When the cci indicator shows bearish divergence across multiple timeframes and price breaks below the previous candle low, you have your entry trigger. This separation between directional bias (from higher timeframes) and entry timing (from lower timeframes plus price action) prevents the scenario described at the beginning of this article.
Divergence Patterns for Reversals and Continuations
Bullish divergence occurs when price makes a lower low but the cci indicator makes a higher low. This signals weakening bearish momentum. Bearish divergence occurs when price makes a higher high but CCI makes a lower high. This signals weakening bullish momentum. Both patterns increase probability when they appear at extreme levels (beyond +100 or -100) and across multiple timeframes.
Regular divergence signals potential reversals. Hidden divergence signals trend continuation after pullbacks. Hidden bullish divergence shows price making a higher low while CCI makes a lower low during an uptrend. Hidden bearish divergence shows price making a lower high while CCI makes a higher high during a downtrend. You use hidden divergence to add to existing positions, not to initiate new ones against the trend.
Practical CCI Trading Strategies for Different Timeframes
For scalping on 1-minute and 5-minute charts, use a 14-period cci indicator with tight +50 / -50 thresholds instead of +100 / -100. Your directional bias comes from the 15-minute or 1-hour chart. When the 15-minute shows CCI above +100 and price above VWAP, you only take long scalps on the 5-minute when CCI pulls back to -50 then crosses back above zero. Your target is 5-10 pips with a 1:1.5 or 1:2 risk-reward ratio. You exit if CCI crosses back below zero.
For day trading on 15-minute and 1-hour charts, use a 20-period cci indicator. Your directional timeframe is H4 or Daily. When the Daily shows bullish momentum (CCI above +100), wait for the H1 to pull back to oversold (-100 or lower) at a demand zone or session low. Your entry triggers when H1 CCI crosses back above -100 and price breaks the previous candle high. Target 20-40 pips with stops below the demand zone. This approach aligns with the principles outlined by trading analytics platforms that emphasize confluence across timeframes.
Swing Trading and Position Building
Swing traders operate on H4, Daily, and Weekly charts. Use a 20 or 30-period cci indicator. Your directional bias comes from Weekly and Daily timeframes. When both show CCI above +100, wait for the H4 to pull back to zero or slightly oversold. Your entry occurs when H4 CCI crosses back above zero with a confirmed candle close above a key level. Targets range from 100-300 pips depending on the pair and volatility. Stop placement sits below the H4 swing low.
Position traders add to winning trades as the trend extends. When your initial entry on Daily CCI crossing above zero reaches +50 pips in profit and the Weekly cci indicator crosses above +100, you add a second position at the next H4 pullback to zero. This pyramiding approach maximizes trend capture while maintaining strict risk management. Each additional position carries its own stop below the most recent swing low. Your average entry improves while your risk per position decreases as earlier entries move into profit.
Managing Risk and Drawdown with CCI Signals
The cci indicator does not prevent losing trades. It provides structure for decision-making. Your risk per trade should never exceed 1-2% of account balance regardless of how strong the CCI signal appears. Prop firm traders working under strict drawdown limits (4-5% daily, 10% total) need even tighter risk controls. You calculate position size based on stop distance, not on confidence in the signal.
When trading with CCI confirmation, your stop placement comes from price structure, not the indicator reading. If you enter long when CCI crosses above -100 at a demand zone, your stop sits below that demand zone plus a buffer for spread and volatility. On EUR/USD with 10-pip stop distance and 1% risk on a $10,000 account, you risk $100, which equals 10 standard lots (assuming $1 per pip). Adjust position size accordingly. The detailed mechanics of CCI as a statistical measure help traders understand why fixed-percentage risk matters more than signal strength.

Track your CCI-based trades separately from other strategies. After 50 trades, calculate your win rate, average winner, average loser, and maximum consecutive losses. If your win rate sits at 45% but your average winner is 2.5 times your average loser, you have a profitable system. If your win rate reaches 60% but your average winner barely exceeds your average loser, you need to improve your exits and target selection. The cci indicator provides entry structure, but you control the exit.
Exit Strategies and Profit Taking
You can exit when the cci indicator crosses back into normal range (below +100 for longs, above -100 for shorts). This captures momentum moves but often leaves profit on the table during extended trends. A more nuanced approach uses trailing stops based on swing structure while monitoring CCI for divergence signals. When CCI shows bearish divergence at extreme levels (+200 or higher) while you hold a long position, tighten your trailing stop to the most recent swing low.
Partial profit-taking preserves capital and removes emotional pressure. Take 50% off at 1.5R (1.5 times your risk), move your stop to breakeven, and trail the remaining position. When CCI reaches extreme levels (+200 for longs, -200 for shorts), take another 25% off and trail the final 25% until stopped out. This approach captures both quick momentum moves and extended trend runs without requiring perfect timing.
Building a Unified System Around CCI
The cci indicator answers the question of momentum strength and direction, but it does not tell you where institutional liquidity sits or when multiple timeframes align for optimal entry timing. Traders who rely solely on the CCI make entries in the middle of ranges, chase momentum without confirmation, and struggle with consistency. You need three components: directional bias from higher timeframes, entry precision at institutional levels, and multi-timeframe confirmation for trade management.
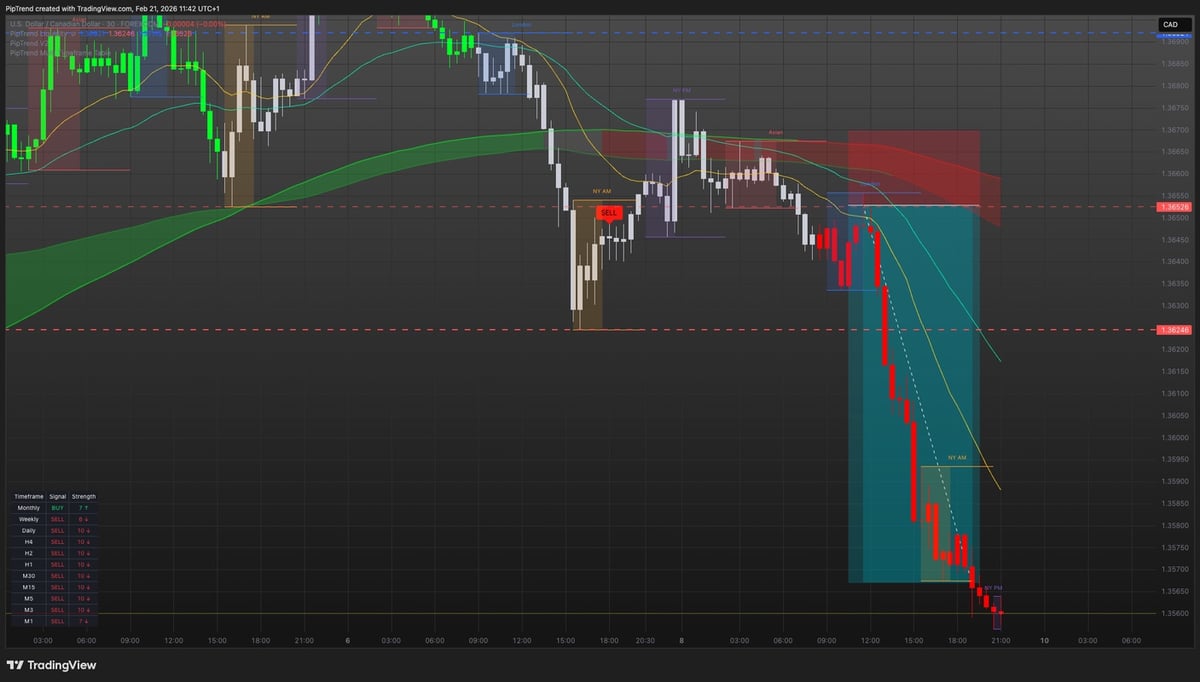
PipTrend solves this by combining directional signals (non-repainting BUY/SELL after candle close), institutional entry levels (VWAP, session highs/lows, supply/demand zones), and a 12-timeframe confirmation table that shows alignment across 1-minute through Monthly charts in one view. This creates a repeatable process where you know your direction before you look for entries, you enter at levels where institutions operate, and you manage the trade with full visibility across all relevant timeframes. For traders who want to incorporate CCI as part of a broader systematic approach, you need tools that separate these three decisions clearly.
 AI Trading Indicator - PipTrend">
| System Component | CCI Indicator Role | Additional Tools Needed | Combined Effect |
|---|---|---|---|
| Direction | Shows momentum strength and overbought/oversold | Multi-timeframe trend confirmation, non-repainting signals | Clear bias before entry search |
| Entry Timing | Divergence and zero-line crosses | VWAP, session levels, supply/demand zones | Precise institutional entries |
| Trade Management | Extreme readings and divergence for exits | 12-timeframe table, swing structure | Systematic exit rules with multi-timeframe visibility |
When you combine the cci indicator with institutional price levels and multi-timeframe confirmation, you transform a single oscillator into part of a complete trading system. You stop treating every CCI cross as an entry signal. You start using it as one data point among several that must align before you risk capital. This shift from indicator reliance to systematic process creates consistency and repeatability.
Common CCI Mistakes and How to Avoid Them
Trading every zero-line cross generates excessive trades and whipsaw losses. The cci indicator crosses zero multiple times during consolidation periods. You need confirmation from higher timeframes and price action before treating a zero-line cross as valid. If the Daily shows CCI at -20 (neutral) and ranging price action, ignore zero-line crosses on the 5-minute chart. Wait for the Daily to establish direction beyond +100 or -100 first.
Ignoring extreme readings in strong trends destroys accounts. When the cci indicator reaches +250 during a parabolic move, shorting based on "overbought" conditions puts you against institutional momentum. Instead, wait for the first pullback where CCI returns to +100 or lower, then look for bullish continuation patterns to add to longs. The same principle applies to oversold conditions below -200 during strong downtrends. Resources like AgenaTrader’s documentation emphasize waiting for trend confirmation rather than counter-trading extremes.
Mixing timeframes without hierarchy creates conflicting signals. You cannot trade a bullish 5-minute CCI signal while the H4 and Daily remain bearish. Establish your hierarchy: Weekly for position trades, Daily for swing trades, H4 for day trades, 15-minute for scalps. Your directional timeframe is two to three levels above your entry timeframe. Your management timeframe is one level above your entry. This structure prevents the confusion that leads to impulsive trades.
Repainting Indicators and Signal Reliability
Some cci indicator variations repaint, meaning they change past signals after new price data arrives. A signal that looked perfect three candles ago disappears or shifts when you review your chart. This makes backtesting meaningless and forward testing unreliable. Verify that your CCI implementation only generates signals after candle close. On TradingView, ensure your alerts trigger "Once Per Bar Close" rather than "Once Per Bar" to avoid repainting.
Confirmed signals after candle close provide reliable data for system testing and live trading. You may miss the first few pips of a move by waiting for confirmation, but you gain signal reliability and reduced false triggers. When building a systematic approach around the cci indicator, prioritize signal consistency over getting the absolute best entry price. A repeatable entry at a slightly worse price outperforms inconsistent entries at theoretically optimal prices.
Integrating CCI Into Your Current Strategy
If you already trade based on support and resistance, add the cci indicator as a momentum filter. Only take long setups at support when CCI is oversold or showing bullish divergence. Only take short setups at resistance when CCI is overbought or showing bearish divergence. This simple addition filters out many false breakouts and increases your win rate without requiring a complete strategy overhaul.
If you trade breakouts, use the cci indicator to confirm momentum behind the break. When price breaks above a key resistance level with CCI already above +100, you have momentum confirmation. When price breaks above resistance while CCI sits at -50, you likely have a false breakout. Wait for CCI to cross above zero before entering. The same logic applies to breakdowns below support levels.
For traders focused on specific sessions (London, New York, Asia), apply the cci indicator to session-based timeframes. The New York session often generates directional moves on the 1-hour chart. If the Daily cci indicator shows bullish momentum and price breaks above the London high during early New York with H1 CCI crossing above zero, you have a high-probability long entry. Target the daily VWAP or previous session high with stops below the London low. According to trading metrics documentation, CCI responds effectively to session-based volatility changes across different market hours.
Testing and Documenting Your CCI Approach
Forward test any cci indicator strategy for at least 50 trades before risking significant capital. Use a demo account or micro lots. Document every trade with entry CCI reading, exit CCI reading, timeframes used, price levels, and outcome. After 50 trades, analyze your data. What CCI level produced the best entries? Which timeframe combination gave the highest win rate? At what CCI extreme did your trades typically reverse?
Your testing reveals patterns specific to your trading style and the assets you trade. EUR/USD may show different CCI characteristics than BTC/USD or NAS100. The 20-period setting may work perfectly on Daily charts but generate too many false signals on 5-minute charts for your trading personality. The only way to know is systematic documentation and analysis. Adjust one variable at a time (period length, overbought/oversold levels, timeframe combination) and test for another 20-30 trades before making additional changes.
Build a checklist based on your testing results. Before every trade, confirm all checklist items are present. Example: Daily CCI above +100, H4 CCI below -100 or showing bullish divergence, H1 CCI crossing above zero, price at VWAP or demand zone, risk 1% with 1:2 RR minimum. When all items check off, you enter. When any item is missing, you wait. This removes discretion and emotional decision-making from your trading process.
The cci indicator provides valuable momentum and trend strength data when applied systematically across multiple timeframes with clear rules for direction, entry, and exits. Most traders fail not because the indicator is flawed, but because they lack a unified system that separates these three distinct decisions. PipTrend combines non-repainting directional signals, institutional entry levels, and 12-timeframe confirmation into one coherent system that removes the guesswork from CCI-based trading. Test the approach with a 3-day free trial and see how systematic decision-making replaces emotional reactions.