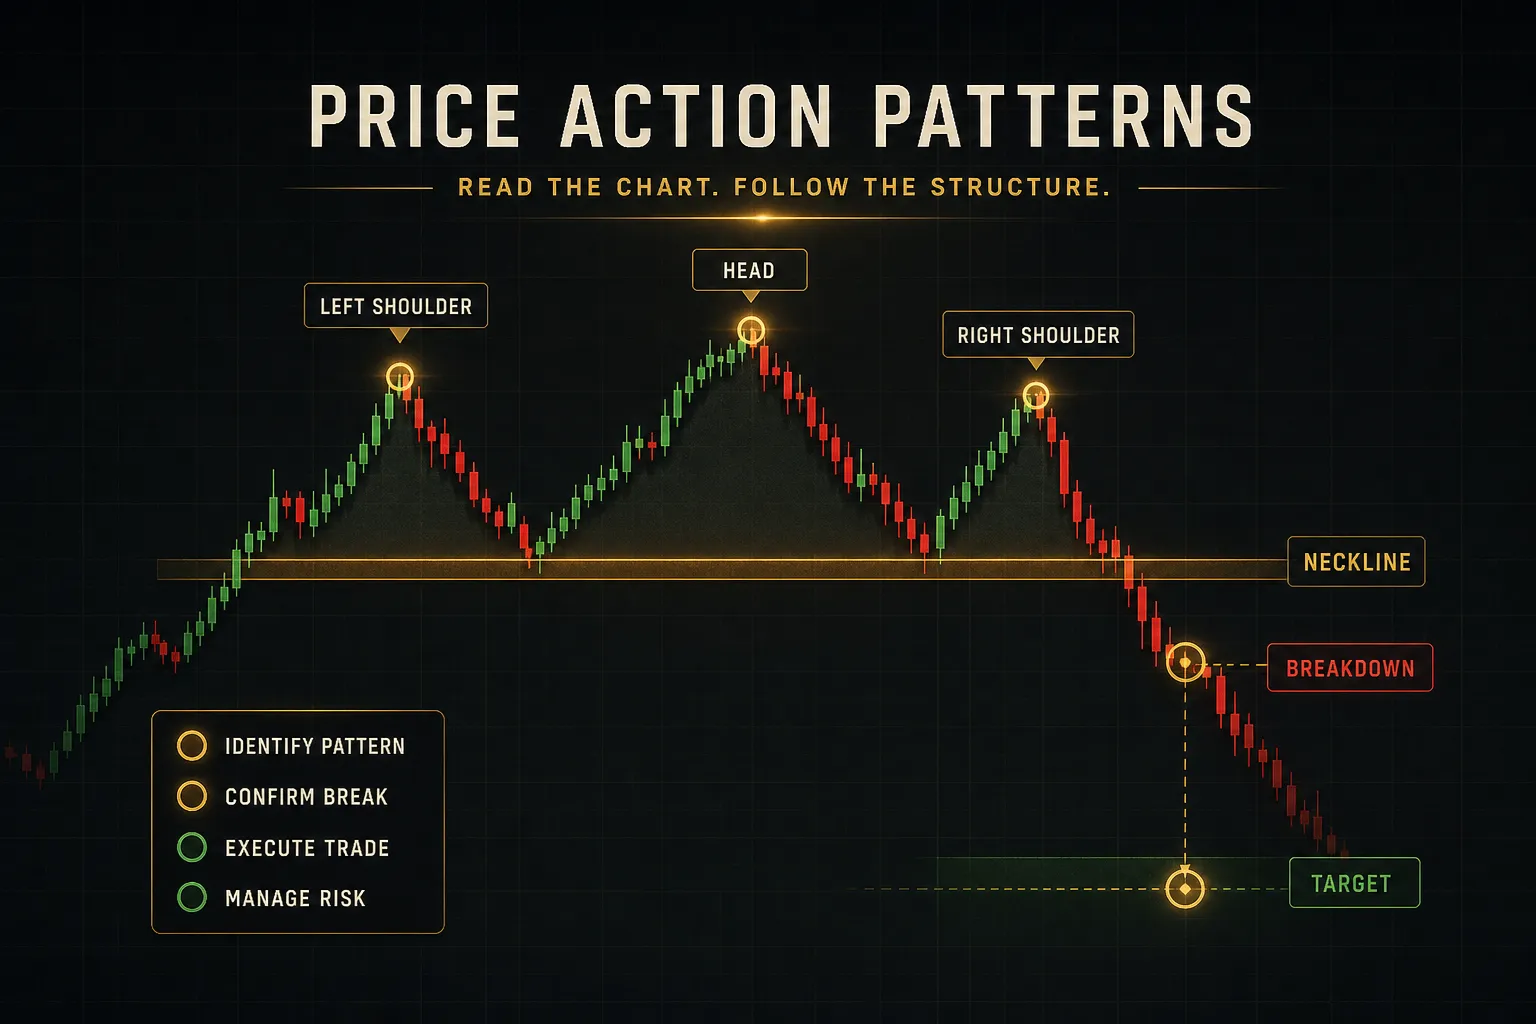
Reading Candlestick Indicators Without the Guesswork
On this page
Why Most Candle Signals Mislead Traders
A trader spots a hammer on the 15-minute chart, clicks buy, and watches price slice straight through the low three candles later.
Sound familiar?
The mistake is not the hammer.
The mistake is treating a shape as a decision instead of a data point.
A candle tells you what happened between the open and the close of one time period. It does not tell you what happens next, and it never has.
Most losing trades built on candlestick indicators come from skipping three questions: Where did this form? Did the candle actually close? And what else agrees with it?
This guide separates three things that get lumped together and shouldn’t be.
A candlestick chart is a format.
A candlestick pattern is a visual arrangement.
A technical indicator is a calculation.
Only one of those produces a number you can test.
Then we’ll build the part that matters: confirmation rules, timing, and risk parameters that turn a shape into a plan with defined downside.
An honest note before anything else.
Academic testing of candlestick patterns has produced mixed results across markets, timeframes, and methodologies. Some studies find modest edges at key levels. Others find nothing after transaction costs.
Anyone selling you a 90% win-rate pattern is selling you something.
Patterns give you context and timing. They do not give you certainty, and any system built on the assumption that they do will eventually hand back everything it made.
The goal here is a repeatable process for identifying bullish reversal, bearish reversal, and trend continuation conditions, then confirming them before risking capital. Not a catalogue of shapes to memorize.
Process beats recognition every time.
What Candlestick Indicators Really Are
Here’s a distinction that costs traders money when they miss it: a hammer cannot be plotted as a line, calculated as a value, or backtested without you first writing the rules that define it.
An RSI reading can.
That difference is the entire reason “candlestick indicator” is a loose phrase rather than a technical one.
Chart, Pattern, or Indicator?
A candlestick chart is a price-plotting format, nothing more. It displays the open, high, low, and close for each period as a body with wicks, invented by Japanese rice traders and popularised in Western markets in the early 1990s.
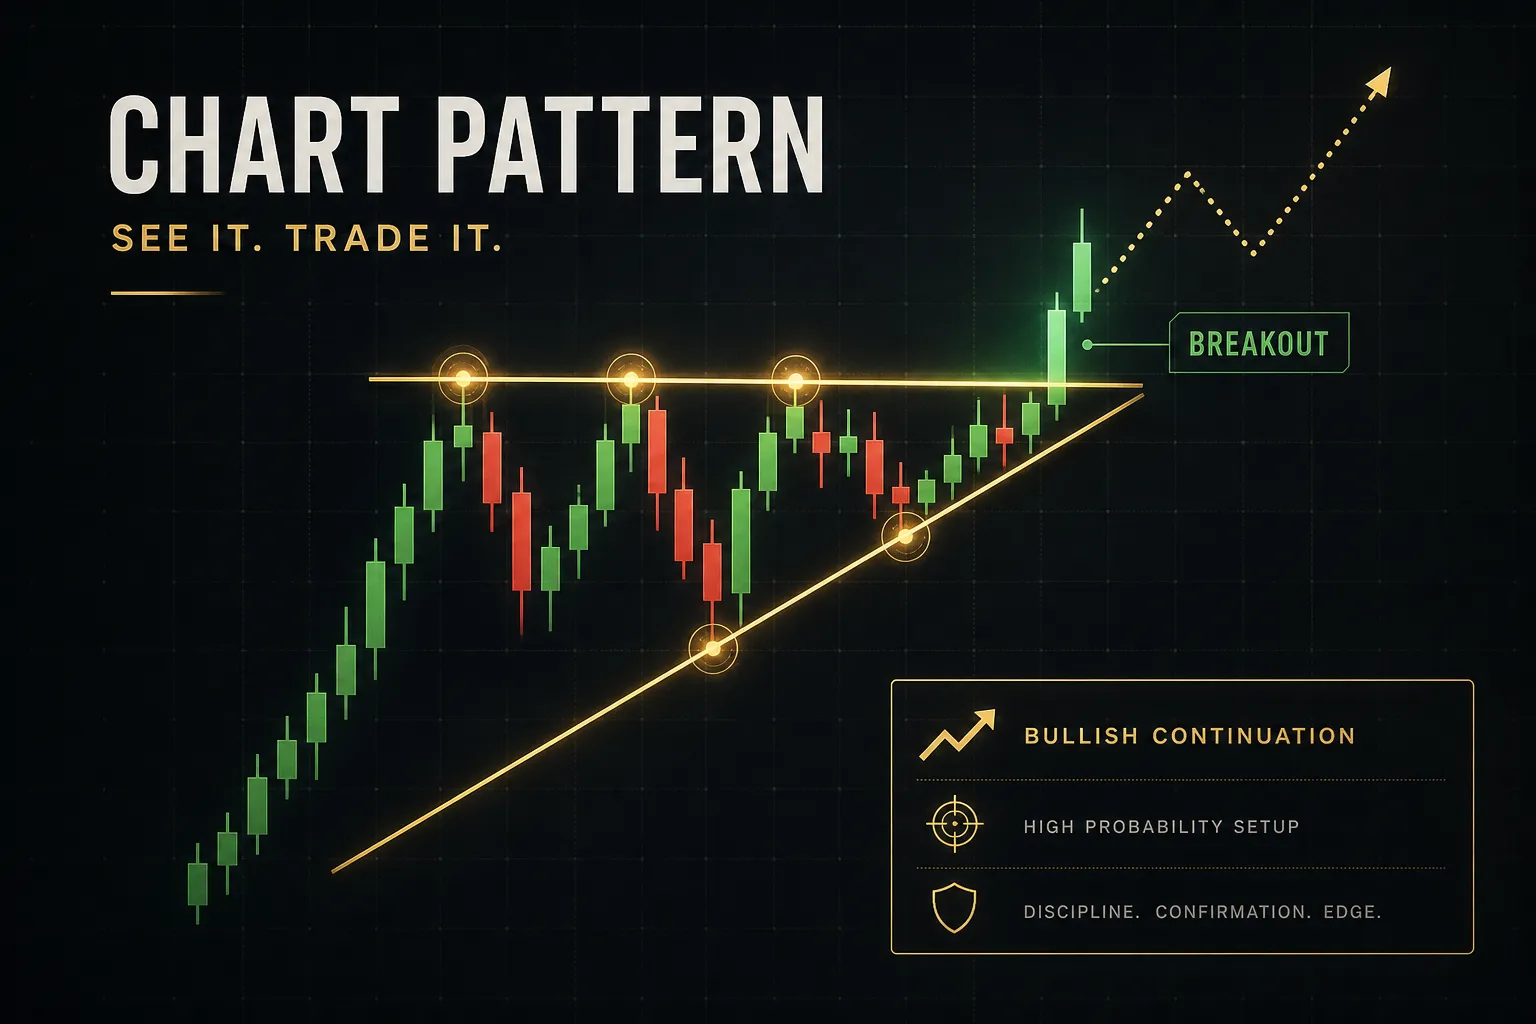
A candlestick pattern is a visual arrangement of one, two, or three candles that traders have named and catalogued.
Engulfing, doji, morning star.
These are descriptions of price action, not formulas.
A technical indicator is a mathematical calculation applied to price or volume data.
The relative strength index measures the ratio of average gains to average losses over a lookback period. MACD subtracts one exponential moving average from another. Average true range averages the true price range across recent bars.
Each produces a specific number at every bar.
So patterns are not indicators in the strict sense.
But traders pair them constantly, and that pairing is where the phrase comes from.
The pattern flags the moment. The indicator adds an objective, testable filter to it.
Charting platforms muddy this further by offering “candlestick pattern indicators” that scan bars and mark detected formations automatically.
Useful for screening.
Just remember the platform is applying somebody’s chosen thresholds, and those thresholds vary wildly between tools.
Anatomy of a Single Candle
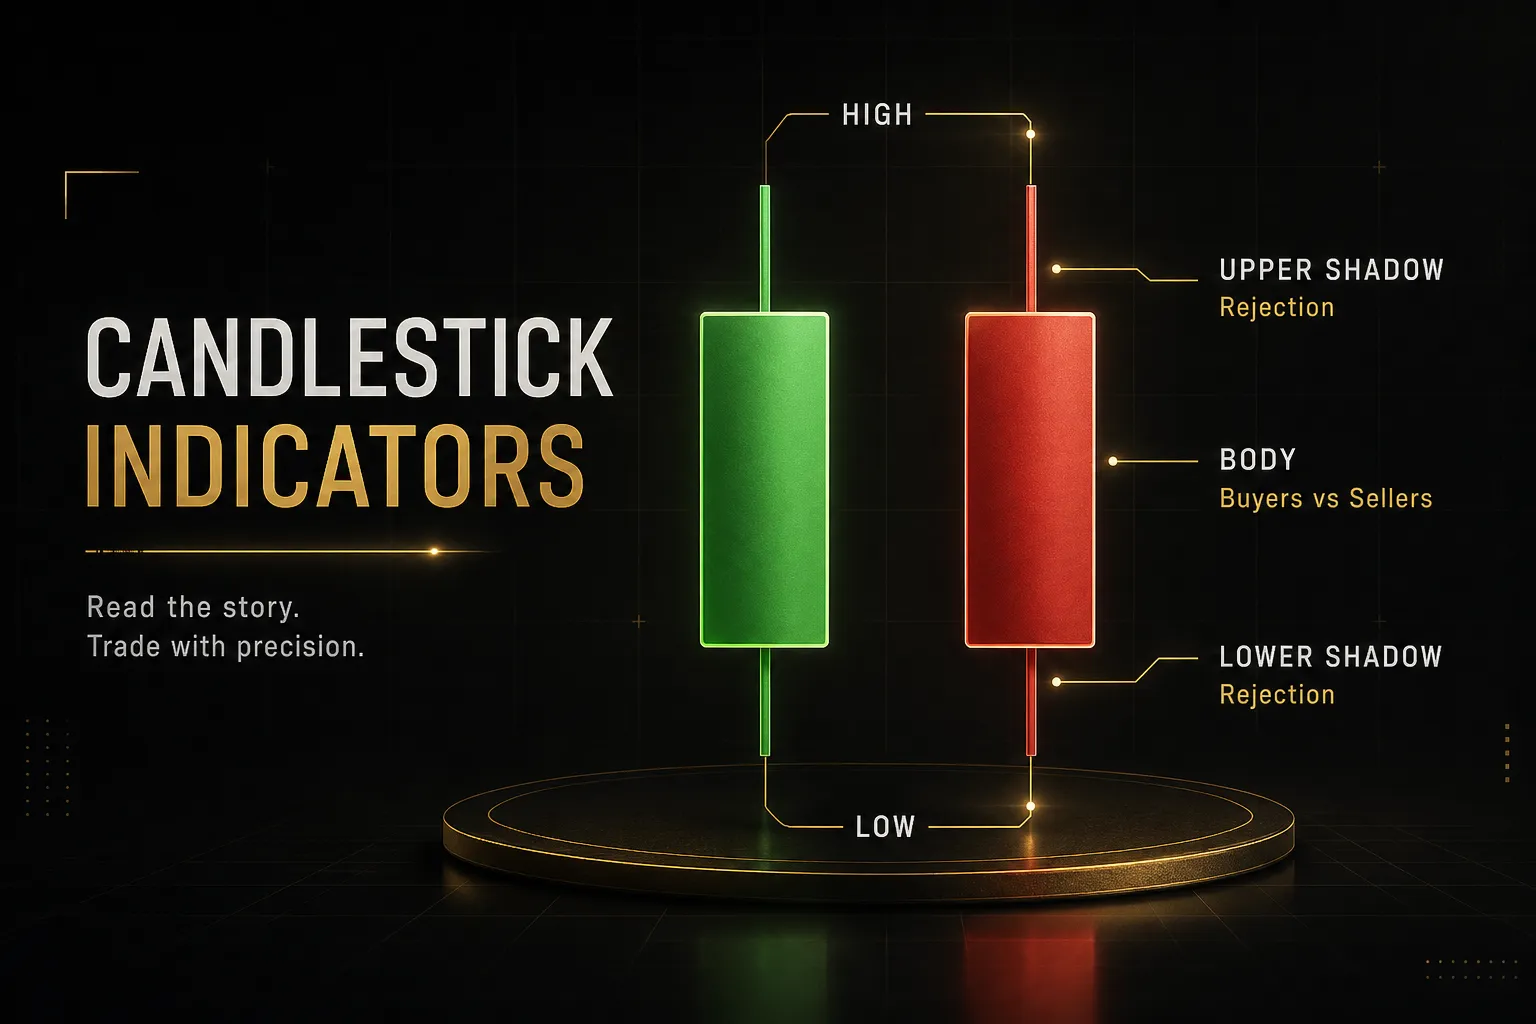
Every candle encodes four prices.
The open is where the period began, the close is where it ended, and the high and low mark the extremes reached along the way.
The real body is the block between open and close.
Filled or red means the close was below the open. Hollow or green means the close was above it.
The thin lines above and below are the upper shadow and lower shadow, also called wicks.
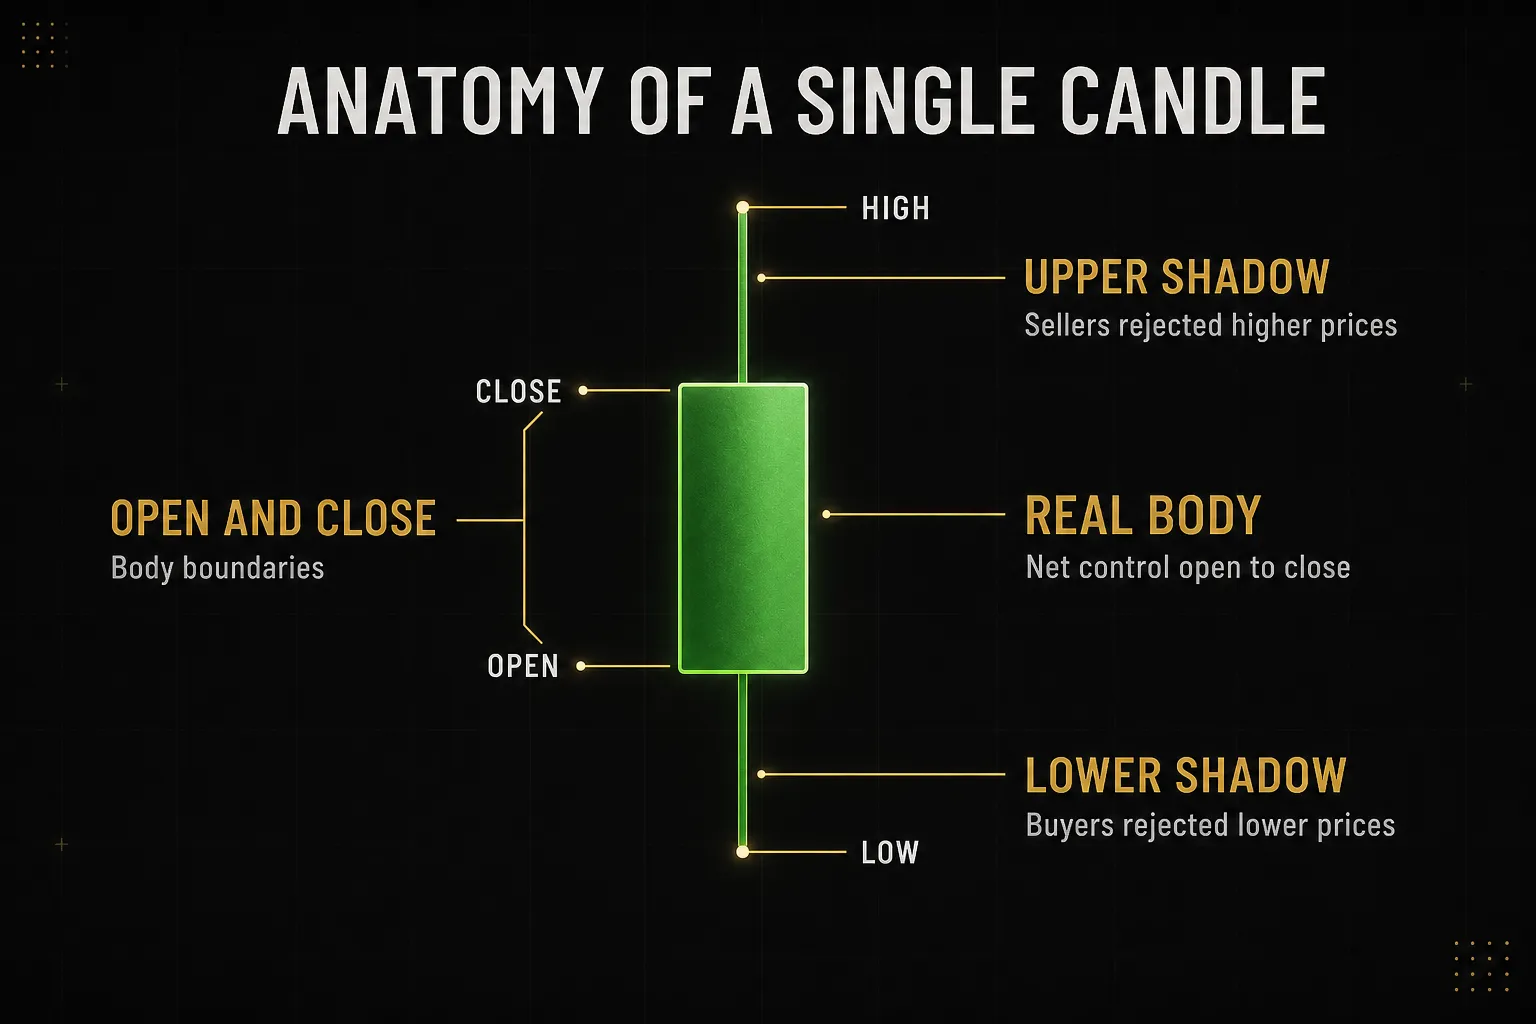
Body size measures conviction.
A long body means one side dominated from start to finish. A tiny body means the period ended roughly where it started, regardless of the fight in between.
Wick length measures rejection.
A long lower shadow says price fell, then buyers pushed it back. A long upper shadow says the opposite: sellers absorbed the advance and drove price back down before the close.
Now the part most guides skip. What counts as “long”?
Vague definitions make patterns untestable, so use ratios. A workable set of thresholds: calculate the total range (high minus low), then measure the body as a percentage of that range.
- Long body: real body is 70% or more of the total range. Strong directional conviction.
- Normal body: body between 30% and 70% of range. Ordinary two-sided trading.
- Spinning top: body under 30% of range with visible wicks on both sides. Indecision.
- Doji: body 5% or less of the total range. Open and close essentially equal.
- Hammer-type wick: one shadow at least twice the body length, with the opposite shadow under 10% of range.
Adjust these to your market and timeframe if backtesting suggests it.
The specific numbers matter less than having numbers at all.
Without them, “long body” means whatever you want it to mean after the fact, which is exactly how hindsight bias sneaks into a strategy.
Context Changes Everything
Take two identical hammers.
Same body ratio, same wick length, same colour.
One forms in the middle of a three-week range on a slow Tuesday. The other forms at a level that has held price four times in six months, after a sharp decline, on twice the average volume.
Same shape.
Completely different trades.
One is noise, the other is information, and the shape alone cannot tell you which is which.
Trend and Location Matter Most
Reversal patterns need something to reverse.
That sounds obvious until you see how often traders take a “bullish engulfing” that appears after two sideways days of chop.
- Prior trend is a requirement, not a nice-to-have. A bullish reversal pattern needs a measurable downtrend before it: lower highs and lower lows across at least the previous five to ten candles, or price trading below a declining moving average.
- Location determines whether anyone cares. Patterns forming at tested support and resistance, prior swing highs or lows, or established supply and demand zones carry far more weight than the same shape in open space. Those are the levels where resting orders actually sit.
- Mid-range signals are the lowest-quality setups available. If price has room to travel in both directions before hitting structure, a reversal candle is telling you almost nothing about the next move.
- Confluence with market structure raises the odds. A hammer at a level that also coincides with a rising 50-period moving average and a prior breakout point is a different proposition than a hammer alone.
- After a false breakout, reversal candles gain significance. Price pushes beyond a level, fails, and closes back inside. The trapped traders on the wrong side become fuel for the move against them.
- Timeframe sets the weight. A daily engulfing candle reflects a full session of participation. A 1-minute engulfing candle reflects ninety seconds of order flow and one large market order.
Patterns Worth Learning First
There are over a hundred named candlestick patterns.
Serious traders use maybe five.
Depth beats breadth here, because a pattern you can define precisely is a pattern you can test, and a pattern you can test is the only kind worth trading.
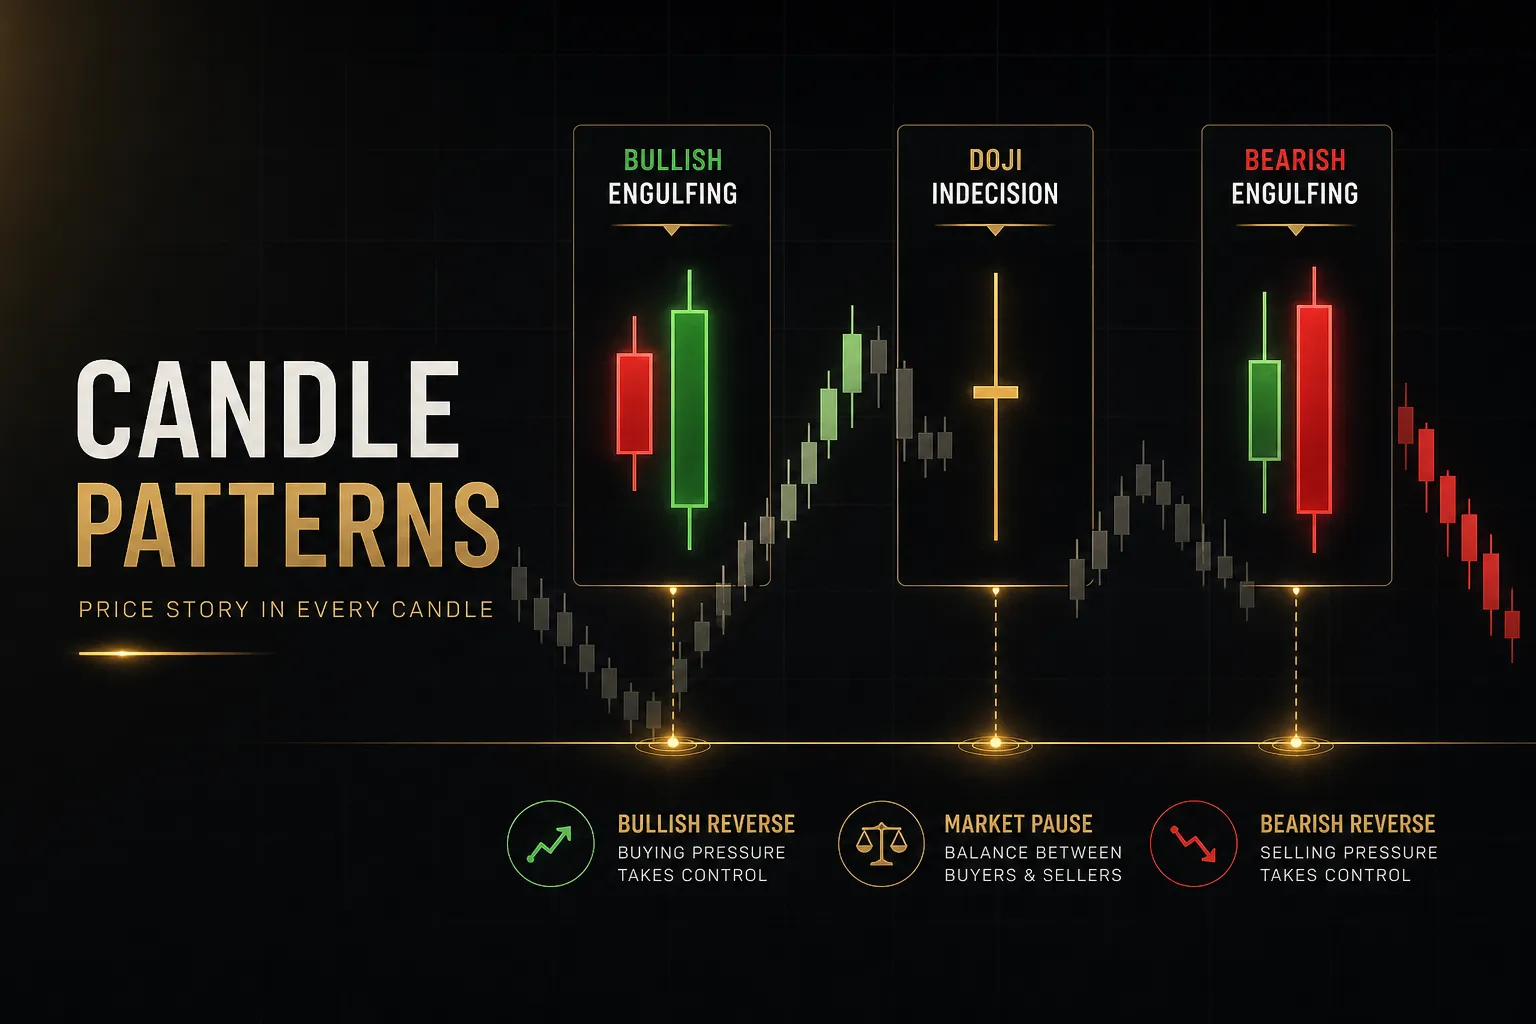
- Bullish engulfing. Requires a prior downtrend. Candle one closes down. Candle two opens at or below candle one’s close and closes above candle one’s open, so its real body fully covers the previous body. Wicks do not need to be engulfed. The wider candle two’s body relative to candle one, the stronger the signal.
- Bearish engulfing. The mirror image after an uptrend. Candle one closes up, candle two opens at or above that close and closes below candle one’s open. Best readings come when candle two’s body exceeds 1.5 times candle one’s body.
- Hammer. Requires a prior downtrend. Small real body positioned in the upper third of the range, lower shadow at least twice the body length, upper shadow under 10% of the total range. Body colour is secondary, though a green body reads slightly stronger.
- Hanging man. Identical geometry to the hammer, but it forms after an uptrend and warns of a bearish reversal. Requires confirmation from the next candle more urgently than the hammer does.
- Doji. Open and close within 5% of the total range. Signals equilibrium, not direction. A doji at a major level after an extended trend means something. A doji in low-volume midday chop means the market went to lunch.
- Morning star. Three candles after a downtrend. Candle one has a long bearish body. Candle two has a small body that gaps down or at minimum closes below candle one’s close. Candle three has a long bullish body closing above the midpoint of candle one. In forex and crypto, the gap requirement is usually relaxed to a simple body separation, since those markets rarely gap.
- Evening star. The bearish counterpart after an uptrend. Long bullish candle, small-bodied candle above it, then a long bearish candle closing below the midpoint of the first.
Look-Alikes That Confuse Traders
Most misreads come from three specific confusions, and all three are avoidable with a rule.
- Hammer versus hanging man. The candles are geometrically identical. The only difference is what came before. Downtrend equals hammer and a potential bullish reversal. Uptrend equals hanging man and a potential bearish reversal. Always check the preceding trend before naming the candle.
- Doji versus spinning top. A doji has a near-zero body, 5% of range or less. A spinning top has a small but clearly visible body, roughly 10% to 30% of range, with shadows on both sides. The doji signals genuine equilibrium. The spinning top signals a mild directional lean amid indecision. Different implications, different quality.
- Inverted hammer versus shooting star. Same shape again, long upper shadow with a small body near the low. Inverted hammer after a downtrend hints at reversal upward. Shooting star after an uptrend warns of reversal downward.
- Engulfing versus harami. Engulfing means candle two swallows candle one. Harami means candle two sits inside candle one’s body. Opposite structures. Traders scanning quickly reverse them more often than you’d expect.
From Signal to Confirmed Trade
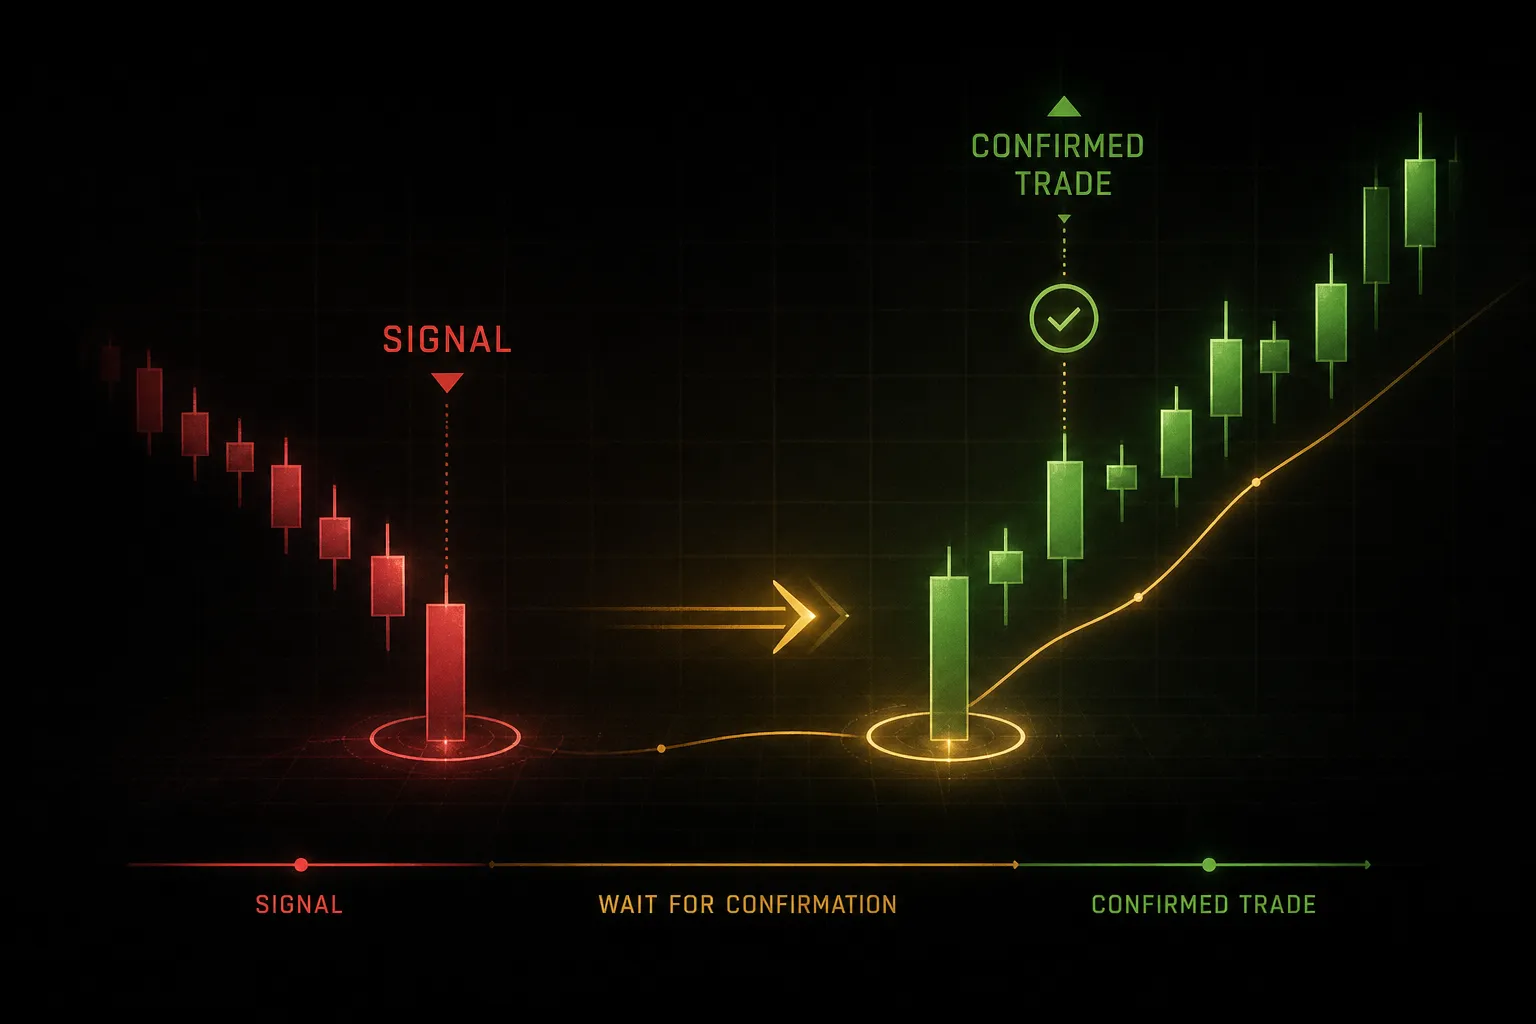
A pattern that looks perfect at minute 43 of a 60-minute candle may not exist at minute 60. This is the single largest source of unnecessary losses in candlestick trading, and it has a fix that costs nothing: wait.
Wait for the Close
An intrabar candle is a live, changing object.
That gorgeous hammer with the long lower wick becomes a plain bearish bar the moment price slips back down before the close.
Nothing repainted in a technical sense. The candle simply had not finished forming.
Only closed candles are valid.
Every pattern definition in this article assumes the close has printed.
Many traders extend this into the 3-candle rule: a setup candle establishing context, a signal candle forming the pattern, and a confirmation candle closing in the expected direction.
You give up some entry price. You avoid a large share of the failures.
Stacking Confluence Without Clutter
Four momentum oscillators on one chart do not give you four opinions.
They give you the same opinion four times.
Confluence means combining tools that measure different things.
- Market structure and levels. Support, resistance, swing points, and supply and demand zones. This measures location.
- Volume. A reversal candle on above-average volume reflects genuine participation. Volume confirmation measures conviction, and it’s the one input that has no overlap with price-derived tools.
- A moving average. The 50 or 200 period, simple or exponential, to define trend direction and bias. This measures trend.
- One momentum tool. RSI or MACD, not both. RSI divergence at a reversal candle is a meaningful add. This measures momentum.
- Average true range. For volatility-scaled stops and targets rather than fixed pip or point distances. This measures volatility.
Five categories, one tool each.
That is a complete picture without redundancy.
Multi-timeframe analysis adds a dimension that single-chart indicators cannot.
Tools such as PipTrend’s 12-timeframe confirmation dashboard let you check whether the higher-timeframe bias agrees with a pattern you found on a lower chart, while marked entry levels like VWAP or plotted supply and demand zones handle the separate question of where to trigger.
Direction confirmation and entry trigger are two different decisions, and separating them is what stops the impulsive click on a single pretty candle.
A Complete Trade Example
Here is the full sequence on a hypothetical EUR/USD daily setup, from identification to sizing.
- Establish context. Price has declined for eleven sessions into a horizontal level that produced two prior bounces. The daily close sits below the 50-day moving average but the level itself has history. Location qualifies.
- Identify the signal candle. The daily candle closes as a hammer: body in the upper third, lower shadow 2.4 times the body, negligible upper shadow. Volume runs 40% above the 20-day average. The pattern is valid only because the close printed.
- Check confluence. RSI on the daily shows bullish divergence against the prior low. The 4-hour structure has printed a higher low. Three independent inputs agree: location, participation, momentum. That is enough. Adding a fourth oscillator adds nothing.
- Define the entry trigger. Buy stop one pip above the hammer’s high, valid for the next two sessions. Price must demonstrate follow-through. If the trigger is not hit, the setup expires unfilled and you lose nothing.
- Set the invalidation level. The hammer’s low. A close below it means the rejection failed and the thesis is dead, regardless of what you hoped would happen.
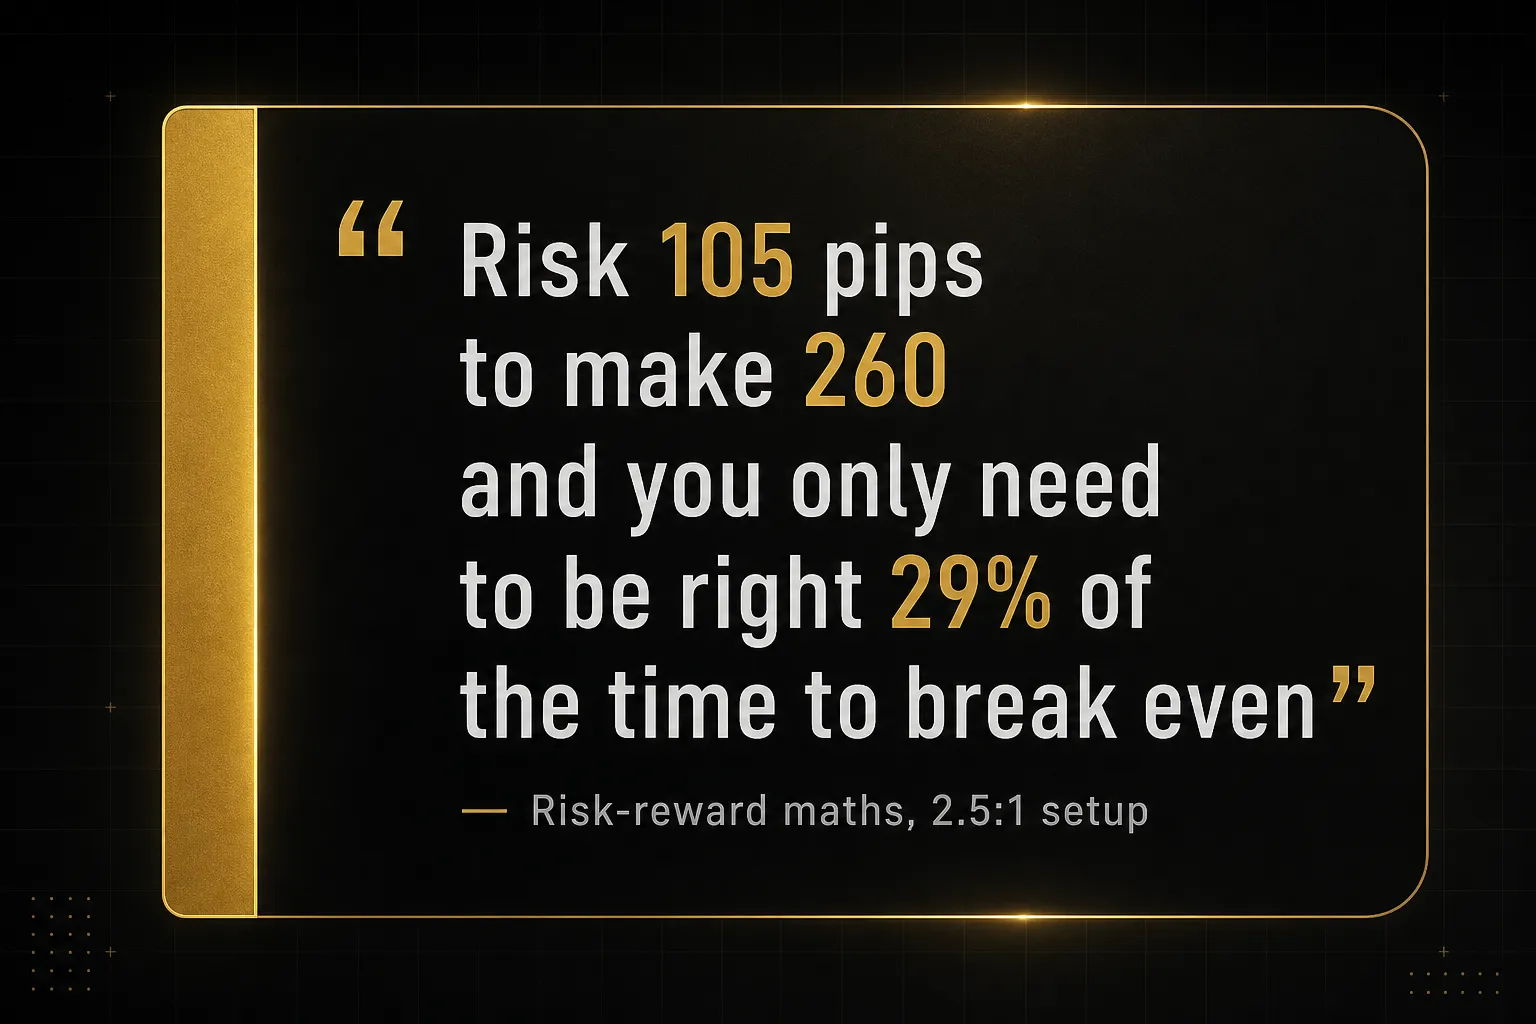
- Place the stop-loss. Either a few pips beyond the hammer’s low or 1.5 times the 14-period ATR below entry, whichever sits further out. If ATR reads 70 pips, that’s a 105-pip buffer against normal noise. Volatility-scaled stops survive ordinary movement. Tight stops get taken out by it.
- Define the target. The nearest significant resistance, the prior swing high 260 pips above entry. Take partial profit at the midpoint if that suits your plan, but decide before entry, never during.
- Calculate the risk-reward ratio. Risk 105 pips to make 260. That’s roughly 2.5 to 1. Below 1.5 to 1, skip the trade. The maths stops working when your winners barely exceed your losers.
- Size the position. Risk a fixed 1% of account equity. On a $25,000 account, that’s $250 across 105 pips of risk, which sets the position size. Position sizing flows from stop distance, never the reverse.
- Write it down before entry. Trigger, invalidation, stop, target, size. Recorded in advance, unchangeable in the heat of the trade. This one habit separates a process from a reaction.
What the Evidence Actually Shows
Ask ten traders which pattern works best and you’ll get ten confident answers.
Ask them for the backtest and the room goes quiet.
Backtesting Candlestick Rules
Backtesting a candlestick strategy starts with definitions precise enough that a computer could apply them without you present.
Body-to-range ratios, wick multiples, required prior trend length, exact entry trigger, exact exit.
If any rule needs your judgement in the moment, you cannot test it.
Split your data.
Build rules on one period, then test them on a period you never looked at during development.
Out-of-sample testing is the only defence against curve-fitting a strategy to noise.
Then separate two numbers that get conflated constantly.
Win rate is the percentage of trades that profit.
Trade expectancy is average win times win rate, minus average loss times loss rate.
A 35% win rate at 3:1 reward makes money. A 70% win rate at 0.4:1 loses it.
Expectancy is the number that pays your bills.
The pitfalls that inflate backtest results are well documented and easy to fall into.
Data snooping means testing dozens of variations and reporting the best. With enough attempts, random data produces winners.
Hindsight bias creeps in when you visually scan charts and only notice the patterns that worked.
Survivorship bias shows up in stock testing when delisted companies are missing from the dataset.
Then there’s cost.
Spread, commission, and slippage turn many marginal edges negative, particularly on lower timeframes where signal frequency is high and per-trade profit is small.
A strategy earning 8 pips per trade dies on a 2-pip spread plus slippage.
And regime change.
A pattern that performed well in the low-volatility grind of 2017 may behave differently in the conditions of 2022 or 2026.
Markets shift. Backtests do not know that.
Forex, Stocks, and Crypto Differ
Pattern definitions that require gaps were written for markets that gap. Applying them unchanged across asset classes produces phantom signals.
Forex trades nearly continuously across sessions, so traditional gaps appear mainly at the Sunday open. Morning and evening star definitions requiring a gap almost never trigger, which is why forex traders substitute a body-separation rule instead.
Stocks gap regularly on earnings, guidance, and overnight news. Classic Japanese pattern definitions built around gaps translate most directly here.
Opening and closing prices carry genuine significance because of concentrated auction volume.
Crypto runs 24/7, so daily candle boundaries are arbitrary conventions rather than session events. A “daily close” on Bitcoin means whatever your exchange’s UTC cutoff says it means, and volatility clusters differently than in equities.
Futures have defined session boundaries with overnight electronic trading. The same instrument produces different candles depending on whether your chart uses regular trading hours or the full electronic session.
Same market, different patterns.
The honest bottom line: no candlestick pattern has been shown to reliably predict future price with high probability on its own.
The research base is mixed, and results vary with market, timeframe, and methodology.
Treat patterns as probabilistic context that improves the odds when combined with location, volume, and trend.
Not certainty.
Candlestick Indicator FAQs
What Are the Best Candlestick Indicators?
The most useful combination pairs a small set of well-defined patterns with three or four non-overlapping indicators. Engulfing patterns and hammers at established support and resistance, confirmed by volume, a 50-period moving average for trend, and RSI or MACD for momentum.
Average true range rounds it out by scaling stops to current volatility. More tools past that point add redundancy, not insight.
What Is the Most Accurate Pattern?
No single candlestick pattern is consistently the most accurate across studies. Reported hit rates vary widely depending on market, timeframe, and how the researcher defined the pattern.
That said, engulfing patterns and pin bar or hammer setups occurring at significant levels tend to have the most supporting research behind them. Accuracy comes overwhelmingly from location and confirmation rather than the shape itself.
Using Candlesticks in Technical Analysis
Candlesticks function as a timing and context layer inside a broader technical analysis process. You first identify market structure and trend direction, mark support and resistance or supply and demand zones, then watch for candlestick patterns to signal when price reacts at those levels.
The pattern narrows your entry window.
The structure decides whether you should be looking at all.
Do Professional Traders Use Candlesticks?
Yes, but rarely as a standalone strategy. Professionals typically read candlesticks as one input among several, weighted alongside market structure, volume, order flow, and higher-timeframe direction.
Almost none of them take a trade because a single pattern appeared. The pattern refines entry timing within a thesis that already existed for other reasons.
What Is the 3-Candle Rule?
The 3-candle rule requires three sequential candles before entry: a setup candle establishing context, a signal candle forming the pattern, and a confirmation candle closing in the expected direction.
Waiting for that third close filters out a meaningful share of failed patterns.
The cost is a worse entry price. The benefit is fewer trades that never had a chance.
Which Indicator Confirms a Candlestick Signal?
Volume is the strongest confirming input because it measures participation rather than repackaging price. A reversal candle on above-average volume carries far more weight than the same candle on thin trading.
Beyond volume, moving averages confirm trend alignment, RSI flags overbought or oversold conditions and divergence, and MACD confirms momentum shifts.
Pick one from each category. Not three from the same one.
Trade the Close, Not the Hype
Before your next trade, do one thing.
Write down the exact close-confirmation rule and the precise invalidation level you’ll use, in advance, in writing.
Not a mental note.
A written rule you cannot renegotiate at minute 43 of a live candle.
Candlestick indicators earn their place as a shared language for reading context and confirming timing. They are not an edge by themselves, and every backtest that claims otherwise has usually skipped costs, out-of-sample data, or both.
So use a simple filter.
If a pattern appears without trend context, without a meaningful level, and without a second independent input agreeing, skip it.
There will be another.
If it aligns with market structure, shows volume confirmation, and a confirming indicator agrees, then plan the trade properly: entry trigger, stop, target, size, risk-reward.
Defined risk before entry.
Every time.
Sources
Risk Disclaimer: Trading involves risk. Past performance doesn't guarantee future results. Only trade with money you can afford to lose. PipTrend is a tool to assist your trading decisions, not financial advice.