Stop Trusting CCI's +100 Signal Blindly
On this page
Why CCI Confuses So Many Traders
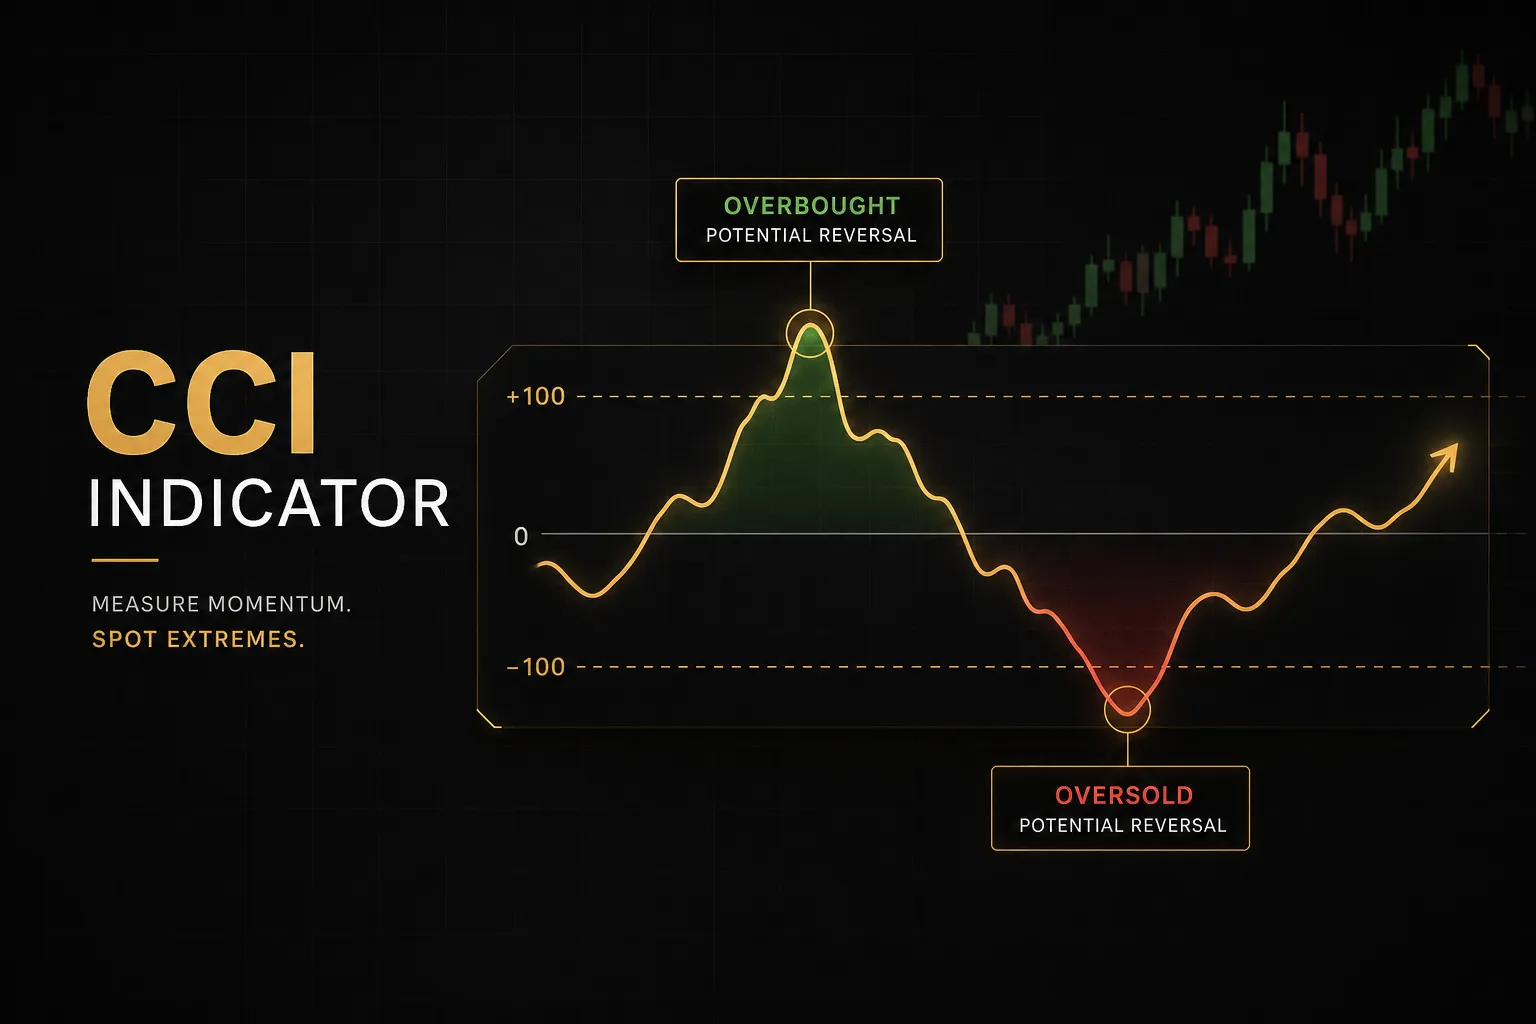
Most traders learn the Commodity Channel Index in about ninety seconds. Above +100 is overbought, below -100 is oversold, trade the reversal.
Then they lose money for six months wondering why the “rule” keeps failing.
Here’s the problem.
CCI is an unbounded oscillator, which means it has no ceiling and no floor. RSI can never exceed 100. Stochastics can never exceed 100. CCI can print +400 on a Tuesday and keep climbing.
That single structural difference breaks the mental model most people bring from other momentum oscillator tools.
A reading of +100 on CCI is not an extreme. Historically it’s roughly the boundary where price has moved meaningfully away from its own average, and in a strong trend, price stays there.
So the +100 line is a threshold, not a trigger.
Context decides what it means.
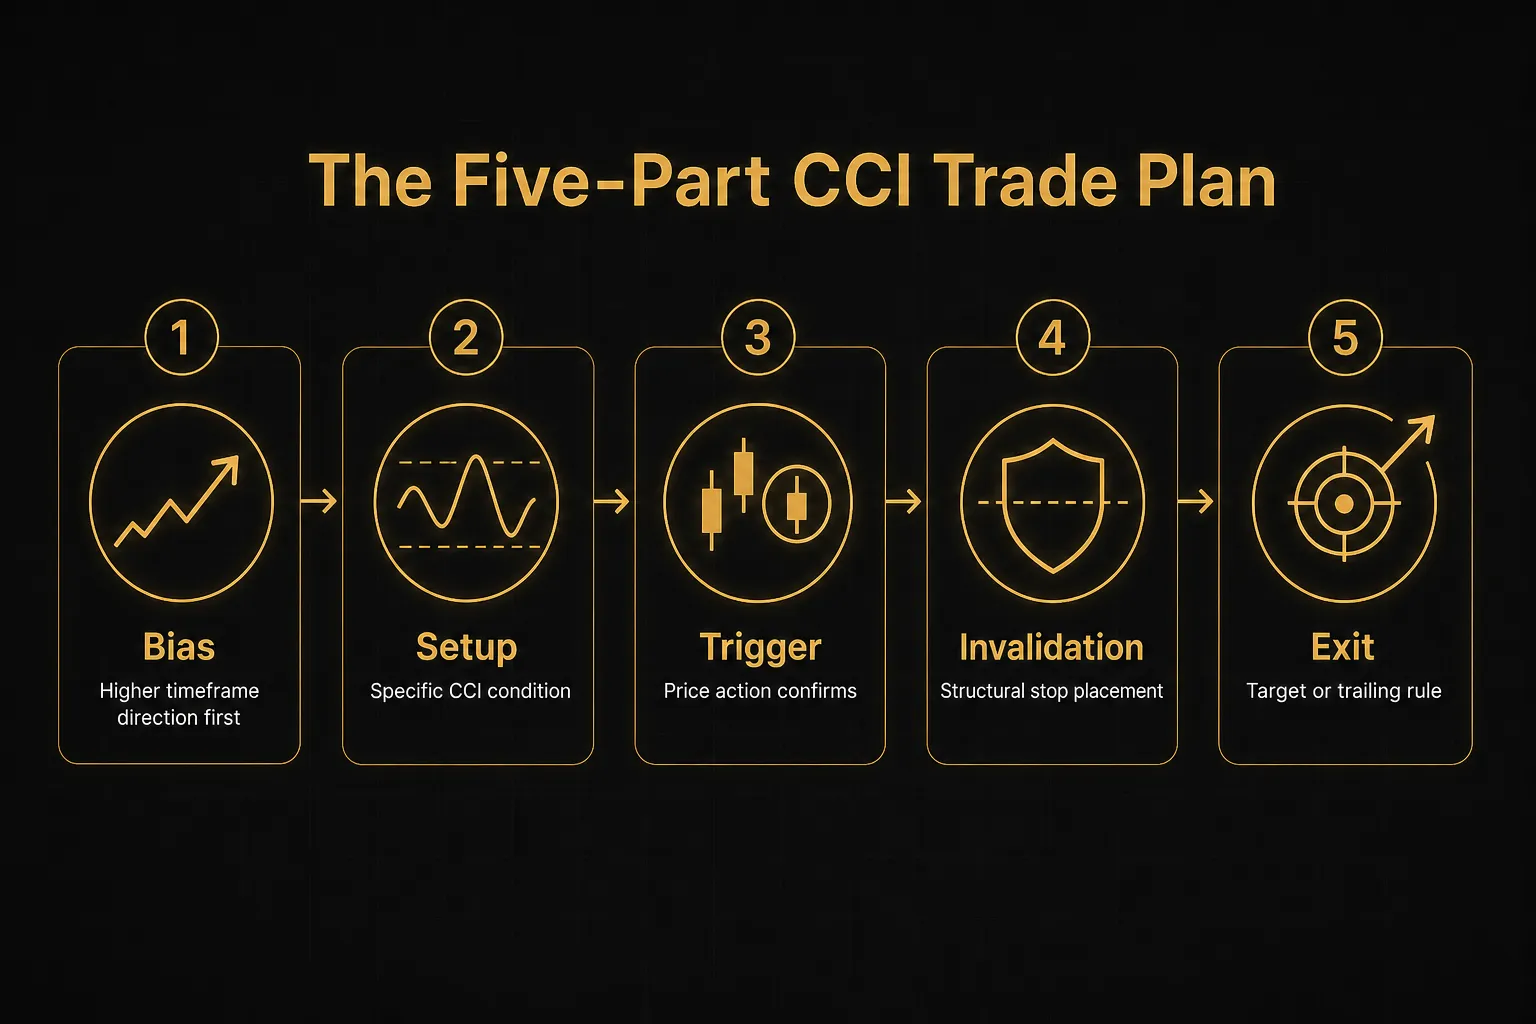
This guide builds a proper decision framework around that idea: bias (which direction the higher timeframe favors), setup (what CCI condition you’re waiting for), trigger (the price action confirmation that gets you in), invalidation (where you’re wrong), and exit (how you get paid).
And because CCI behaves differently across forex, stocks, crypto, commodities, and indices, we’ll cover how the same reading carries different weight depending on what you’re trading.
How the CCI Indicator Works
Donald Lambert published the Commodity Channel Index in 1980 in Commodities magazine. He designed it to spot cyclical turns in commodity markets, which is where the name comes from, though traders now apply CCI indicators to every liquid asset class on the planet.
Lambert’s core idea was simple and still holds up: measure how far current price has strayed from its own statistical average, then scale that distance into a readable number.
The CCI Formula Explained
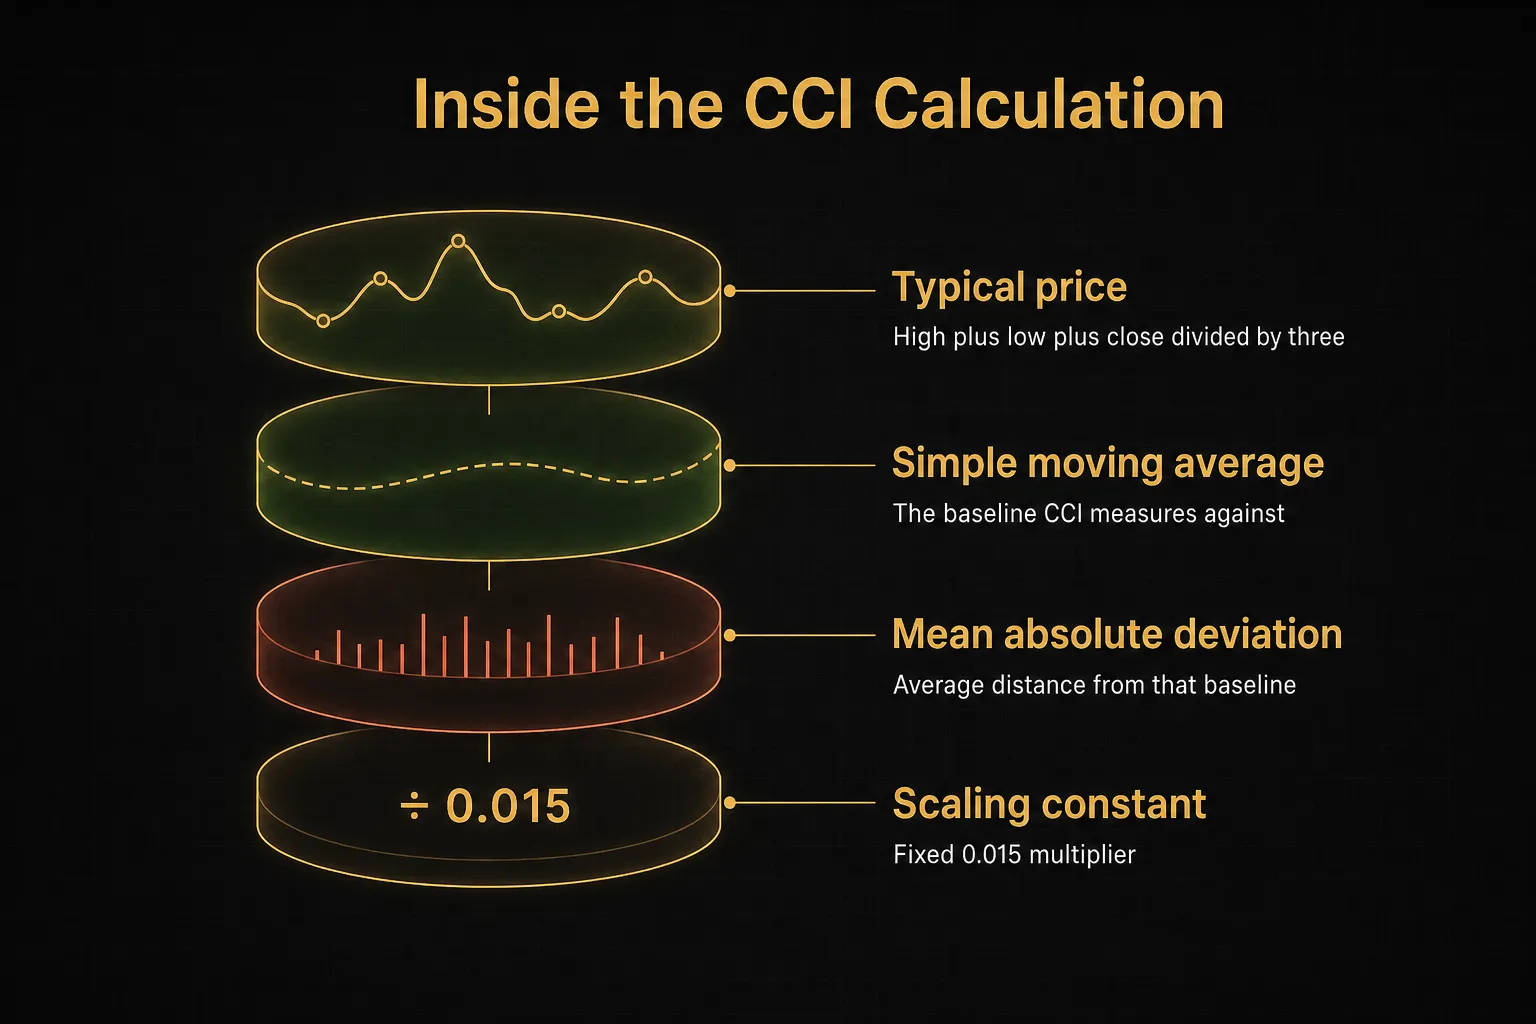
The calculation has three moving parts. First, typical price, which is the average of the high, low, and close for each bar: (High + Low + Close) / 3.
Second, a simple moving average of that typical price over your chosen lookback period. Third, the mean absolute deviation, which is the average distance between each typical price and that moving average, ignoring direction.
Put together:
CCI = (Typical Price − SMA of Typical Price) / (0.015 × Mean Deviation)
The numerator is your raw price deviation from the mean. The denominator normalizes that deviation against how much the asset typically wanders, which is what makes readings roughly comparable across instruments with different price levels.
That 0.015 constant is not magic.
Lambert chose it deliberately so that roughly 70 to 80 percent of readings would fall between -100 and +100 under normal conditions.
It’s a scaling decision, nothing more.
Which is exactly why nothing caps the output. If price deviates far enough, CCI prints whatever the math produces.
The mean absolute deviation piece matters more than most people realize. Standard deviation, the input behind Bollinger Bands and many RSI-adjacent tools, squares the differences, so large outliers dominate the result.
Mean absolute deviation treats every distance linearly.
The practical effect: CCI is somewhat less desensitized by a single violent bar than standard-deviation tools are.
After a news spike, a Bollinger-based measure widens sharply and mutes subsequent signals.
CCI adjusts more gradually, which is why it often keeps producing readable signals right after volatility events.
What Positive and Negative Values Mean
A positive CCI means the current typical price sits above its moving average. Buyers have pushed price above its recent equilibrium.
Negative means the opposite.
Zero is the equilibrium point, and the zero-line crossover is the cleanest structural signal CCI offers.
It tells you momentum has changed sides, full stop.
The magnitude tells you about intensity, not sustainability.
A CCI of +250 says price is unusually far above its own average right now. It says nothing about whether that gap closes in the next hour or widens for three more days.
Traders who forget that distinction spend their careers shorting strength.
Reading CCI Signals in Context
Ask ten traders what CCI reading counts as “extreme” and you’ll get ten answers. They’re all right, and that’s the point.
Because CCI has no upper or lower bound, extreme levels are entirely asset-specific and regime-specific. A reading of +200 on EUR/USD daily is genuinely unusual.
The same +200 on a small-cap biotech during an FDA announcement is a Tuesday.
Before you use fixed thresholds, look at twelve months of history on the exact instrument and timeframe you trade.
Find where CCI actually turned.
That’s your reference range, not the textbook number.
Why ±100 Isn’t an Automatic Signal
Lambert himself never framed +100 as a sell signal. In his original work, a move above +100 was a signal to enter long, because it indicated a new upward cycle had begun with enough force to be worth trading.
The overbought/oversold interpretation came later, from traders applying range-bound logic to a tool built for cycle detection.
Both interpretations work. In different market regimes.
In a ranging market, price oscillates around a stable mean by definition. Extremes reliably pull back, so mean reversion logic pays. CCI touches -150 near range support, you buy, price returns to the middle.
Clean.
In a trending market, the opposite happens.
A sustained reading above +100 that holds for ten, twenty, or forty bars is trend continuation evidence, not a reversal warning. The mean itself is climbing, so price staying above it is exactly what should happen.
The practical rule: how long CCI stays extreme matters more than how extreme it gets.
A single spike to +180 that snaps back within two bars is a mean-reversion candidate. A grinding forty-bar residency above +100 is a trend you should be trading with, not against.
So the first question is never “is CCI overbought?” It’s “am I in a range or a trend?” Answer that with structure, higher highs and higher lows, moving average slope, or an average true range expansion check, before you interpret a single CCI value.
CCI Across Forex, Stocks, and Crypto
The same indicator behaves like three different tools depending on the asset class.
Major forex pairs are the most well-behaved. Central bank policy anchors them, liquidity is enormous, and CCI on EUR/USD or USD/JPY tends to respect the ±100 to ±200 band with reasonably reliable reversion. Session timing matters though: the London-New York overlap produces genuine moves, while the Asian session on European pairs produces noise that fires false CCI signals constantly.
Crypto is the wild end.
Bitcoin and altcoins routinely push CCI past ±300 and stay there through multi-day momentum runs. Twenty-four-hour trading means no session structure to filter by, and weekend liquidity gaps create spikes that mean nothing.
Wider thresholds and a volatility filter are not optional here.
Equity indices like the S&P 500 or Nasdaq trend hard and mean-revert violently, often in the same month. CCI extremes during a low-volatility grind higher are continuation signals. The same extremes during a VIX spike are reversal-relevant.
Regime awareness is everything.
Individual stocks add gap risk. Earnings, guidance, and sector news create overnight moves that jump straight past your invalidation level. CCI reads the gap after the fact.
Commodities, CCI’s original home, are news-driven in bursts. Crude oil reacts to inventory reports and OPEC headlines, agriculture to weather and crop data.
Between events, CCI works well for cycle timing. During events, it lags the news by definition.
Choosing Settings and Signal Types
Default settings exist because software vendors had to pick something. Not because 20 periods is optimal for your instrument, timeframe, or holding period.
Most platforms ship CCI at 14 or 20. Lambert’s original recommendation was to use a period covering roughly one-third of a full market cycle.
If your instrument cycles every 60 bars, that’s a 20-period CCI.
Picking a CCI Period
Three settings cover the vast majority of practical use cases, and the tradeoff between them is entirely about noise versus lag.
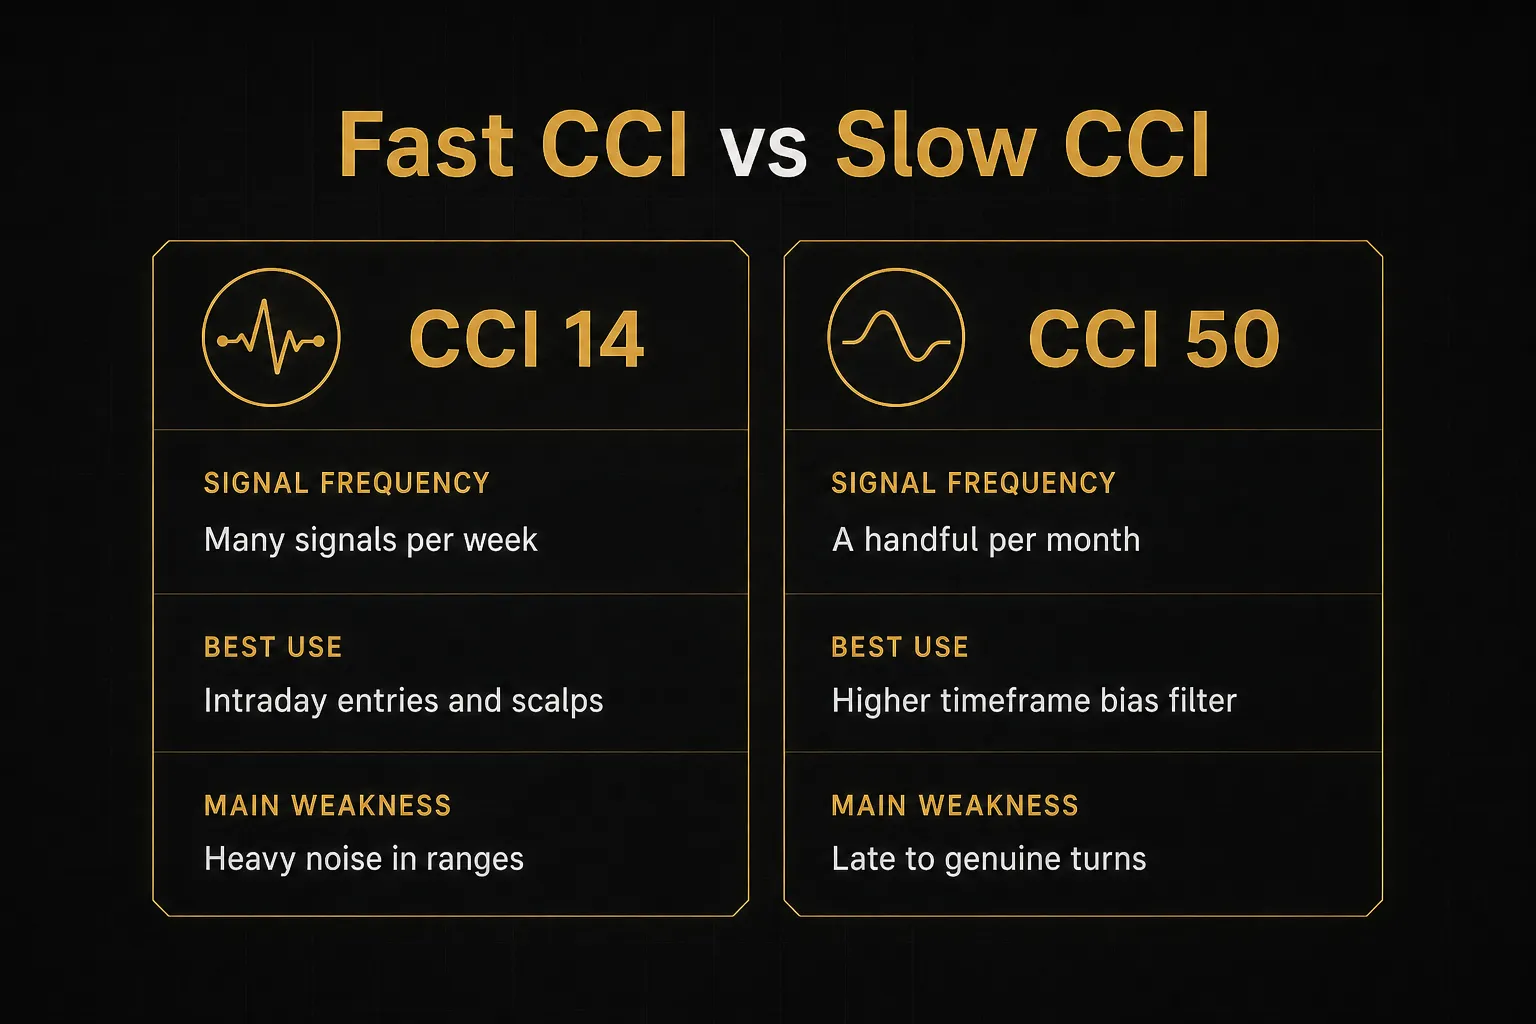
- CCI 14 (fast). Reacts within a few bars of a momentum shift, generates the most signals, and suits scalping or 5-minute to 15-minute intraday work. It also fires constantly in chop. Expect a materially higher false-signal rate and plan for smaller position sizes or tighter filters to compensate.
- CCI 20 (balanced). The most widely used setting, and the reasonable default for swing trading on 1-hour to daily charts. It smooths enough to ignore single-bar noise while still turning fast enough to be tradable. If you’re unsure where to start, start here and change nothing for at least 100 trades.
- CCI 50 (slow). Produces few signals but they carry weight. Best used as a higher-timeframe bias filter rather than an entry tool: if daily CCI 50 is above zero, only take long setups on your execution timeframe. This is where CCI adds the most value to multi-timeframe analysis.
- Anything below 10. Generally counterproductive outside of very specific high-frequency contexts. The signal-to-noise ratio collapses and you end up trading random fluctuations in the mean absolute deviation term rather than actual price movement.
One more rule that saves a lot of pain: fix your period before you look at results. Optimizing the lookback until the backtest looks pretty is curve-fitting, and it will not survive contact with live markets.
Four Signals CCI Actually Gives
CCI produces four distinct events, and they carry completely different risk profiles. Traders who blur them together end up with an unmeasurable strategy.
- Zero-line crossover. CCI crosses from negative to positive or vice versa. This is the cleanest momentum-shift signal and works best as a trend-following filter on higher timeframes. Weakness: in ranging conditions it whipsaws across zero repeatedly, so pair it with a trend or ATR filter.
- ±100 breakout. CCI pushes above +100 or below -100. Read this as strength confirmation, closer to Lambert’s original intent. It’s a continuation signal, particularly powerful when it coincides with a break of support and resistance and elevated volume.
- Exit from an extreme zone. CCI crosses back below +100 or back above -100 after a sustained stay. This is the mean-reversion signal, and it’s meaningfully safer than shorting into strength because you’re waiting for momentum to actually roll over rather than predicting that it will.
- Divergence. Price makes a new extreme, CCI does not. The earliest warning of the four, and the least reliable on its own. Divergence is a heads-up to tighten management, not a standalone entry.
Notice that signals two and three point in opposite directions.
That’s not a contradiction, it’s the range-versus-trend question showing up again.
Decide the regime first, then pick which of the four signals you’re even allowed to trade.
Regular and Hidden Divergence
Divergence is where CCI earns its reputation, and where most traders get burned by entering too early.
- Regular bearish divergence. Price prints a higher high, CCI prints a lower high. Buying pressure is fading even though price is still climbing. Reversal warning.
- Regular bullish divergence. Price prints a lower low, CCI prints a higher low. Selling pressure is exhausting. Potential bottom forming.
- Hidden bearish divergence. Price prints a lower high, CCI prints a higher high. Counterintuitive, but this signals downtrend continuation, a pullback that’s running out of steam.
- Hidden bullish divergence. Price prints a higher low, CCI prints a lower low. Uptrend continuation, and one of the better pullback-entry signals in the whole toolkit.
The universal rule: never enter on divergence alone. Divergence can persist through three, four, or five swings while price keeps trending, and each failed entry costs you.
Wait for price action confirmation.
A break of the swing low that formed the divergence, an engulfing candle at a known resistance level, or a zero-line crossover in the divergence’s direction. Confirmation costs you a few pips of entry price and saves you from the majority of failed divergence trades.
Building a Full CCI Trade Plan
An indicator reading is not a trade.
It’s one input into a decision that requires four other components before capital moves.
Here’s the sequence, in the order you should actually run it.
- Establish market bias on a higher timeframe. Before touching your execution chart, determine direction on a timeframe 4x to 6x higher. If you trade the 15-minute, check the 1-hour and 4-hour. Use structure (higher highs and higher lows), a 50 or 200-period moving average slope, or a CCI 50 zero-line position. If the higher timeframe is flat or conflicting, your best trade is no trade.
- Define the setup condition. This is where CCI enters. In an uptrend bias, your setup might be “CCI 20 dips below -100 on the execution timeframe” (a pullback in a trend) or “hidden bullish divergence forms at a prior support level.” Write the condition down as a specific, checkable statement. If you can’t write it, you can’t test it.
- Wait for the entry trigger. The setup says the location is right. The trigger says the market agrees. Acceptable triggers: CCI crossing back above -100, a bullish engulfing candle, a break of the pullback’s high, or a zero-line crossover. Never enter on the setup alone. This single discipline eliminates a large share of false signals.
- Set invalidation before entry. Your stop goes where the trade idea is proven wrong structurally, below the swing low that formed the setup, or beyond a level defined by 1.5x to 2x average true range. Never place it based on how much you’re willing to lose. Place it based on where the market says you’re wrong, then use position sizing to make that distance affordable.
- Define the exit in advance. Either a fixed target at a measured level (prior resistance, a 2:1 or 3:1 risk-reward ratio) or a trailing rule (exit when CCI crosses back through zero, or trail below each new higher low). Pick one and stick with it for the full test period. Switching mid-trade is how good systems produce bad results.
- Log the trade regardless of outcome. Record the bias, setup, trigger, invalidation, exit, and result. Without a log you have anecdotes, not data.
One warning that deserves its own paragraph: do not stack CCI with RSI and Stochastics and call it confirmation.
All three are momentum oscillators derived from recent price. They agree most of the time because they measure overlapping information, which produces false confidence rather than genuine confirmation.
If you want a second input, choose something structurally different. Volume, market structure, session timing, or a volatility measure like ATR.
Independent information adds edge.
Redundant information adds delay.
Example: Adding Multi-Timeframe Confirmation
Consider a EUR/USD long. The 4-hour chart shows higher highs and higher lows with CCI 50 holding above zero.
Bias: bullish.
The 15-minute chart pulls back and CCI 20 dips to -140 near a prior support shelf.
Setup: valid.
You wait.
CCI crosses back above -100 on a bullish engulfing candle.
Trigger: fired.
Stop goes 12 pips below the swing low, target at the previous 4-hour high, giving roughly 2.6:1.
That’s a complete plan built on two timeframes.
Systems designed around this principle push the concept much further, aligning directional agreement across as many as 12 timeframes before flagging a setup, then providing separate entry levels and trade management rules rather than a single alert. PipTrend works this way, and the structural lesson applies whether you use a system like that or build the checks manually.
The takeaway is not about any specific tool.
It’s that a CCI reading answers one question out of five, and treating it as the whole answer is the error that costs traders money.
Avoiding False CCI Signals
False signals are not random.
They cluster around identifiable conditions, which means most of them are avoidable with a filter.
- Low-liquidity sessions. The Asian session on European pairs, the hour before major market opens, and holiday periods produce thin, erratic price movement that swings CCI without meaningful order flow behind it. Restrict trading to your instrument’s high-liquidity window.
- Wide spreads. A 3-pip spread on a 15-pip target destroys your expected value before the trade starts. Check spread conditions, especially around rollover and in exotic pairs or low-cap crypto.
- News volatility spikes. NFP, CPI, central bank decisions, and earnings releases move price faster than any lagging calculation can register. CCI will print a dramatic reading after the move is done. Stand aside for 15 to 30 minutes around scheduled high-impact events.
- Choppy, directionless ranges. The single biggest source of zero-line whipsaw. Filter with ATR: if current ATR is below its own 20-period average, momentum signals are unreliable. Wait for expansion.
- Overly short CCI periods. A CCI 7 on a 5-minute chart will produce a dozen signals per session and most will be noise. Lengthen the period or lengthen the timeframe.
- Missing volume confirmation. On stocks, futures, and crypto where real volume data exists, a ±100 breakout on below-average volume is materially weaker than the same breakout on expanding volume. Use it.
Backtesting a CCI Strategy
Most backtests are worthless, not because the strategy fails but because the testing method guarantees a flattering result.
- Eliminate look-ahead bias. CCI recalculates as a bar forms and only finalizes at the close. If your test uses the completed bar’s CCI value to enter at that bar’s open, you’ve used information that didn’t exist yet. Enter on the next bar’s open. Always.
- Test across at least three market regimes. A trending period, a ranging period, and a high-volatility crisis period. A strategy that only works in one regime is not a strategy, it’s a description of the past. Minimum sample: 200 trades, or two full years of daily data.
- Fix all settings before viewing results. Declare your CCI period, thresholds, stop logic, and exit rules in writing first. Then run the test once. Adjusting parameters until equity curves look good is curve-fitting, and the more parameters you tune, the more certain the failure.
- Include realistic costs. Spread, commission, and slippage. A strategy with a 55 percent win rate and a 1:1 payoff is profitable on paper and unprofitable after a 1.5-pip round-trip cost.
- Reserve out-of-sample data. Develop on 70 percent of your history, then test once on the untouched 30 percent. If performance collapses, you optimized noise.
- Journal losses alongside wins. Log every trade, and specifically categorize the losses: bad regime, missed confirmation, news event, or simply a valid trade that lost. Only that categorization tells you whether to fix the rules or fix the discipline.
Common Questions About CCI
What is the best CCI setting for day trading?
CCI 14 or CCI 20 on a 5-minute to 15-minute chart is the standard starting point for day trading, with CCI 20 offering the better balance for most traders. Shorter periods react faster but generate substantially more false signals in choppy intraday conditions. Whichever you choose, pair it with a higher-timeframe bias filter (1-hour or 4-hour) and fix the setting for at least 100 trades before evaluating it.
Optimizing the period after seeing results is curve-fitting.
Is CCI better than RSI?
Neither is better; they measure different things and suit different conditions.
RSI is bounded between 0 and 100 and compares average gains to average losses, making it more consistent for overbought and oversold assessment in range-bound markets. CCI is unbounded and measures price deviation from the mean, which makes it better at capturing the intensity of a move and confirming strong trend continuation.
Running both together adds little, since they draw on overlapping information rather than providing independent confirmation.
What does a CCI of 100 mean?
A CCI reading of +100 means the typical price is roughly 1.5 mean absolute deviations above its simple moving average, indicating unusually strong upward momentum. It does not automatically mean overbought.
In a ranging market, +100 often marks a mean-reversion opportunity. In a trending market, crossing +100 is a continuation signal and CCI can stay above that level for dozens of bars.
Duration above the threshold matters more than the number itself.
What does a CCI of -100 mean?
A CCI of -100 means typical price sits about 1.5 mean absolute deviations below its moving average, showing strong downward momentum. Whether that’s a buying opportunity depends entirely on market regime.
In a range, -100 near support is a reasonable mean-reversion setup once CCI crosses back above the level. In a downtrend, -100 confirms sellers are in control, and buying it is fighting the dominant flow.
How accurate is the CCI indicator?
CCI has no fixed accuracy rate, because its performance depends almost entirely on market condition and how it’s confirmed. In clearly trending or clearly ranging conditions with proper filters and price action confirmation, well-constructed CCI systems commonly test in the 45 to 60 percent win-rate range with positive expectancy driven by risk-reward, not hit rate.
Used alone in choppy markets, accuracy drops toward coin-flip territory.
The indicator is a measurement tool, not a prediction engine.
How do you use the CCI indicator to identify buy and sell signals?
Start by establishing higher-timeframe bias, then use CCI for one of four signals: a zero-line crossover, a ±100 breakout, an exit from an extreme zone, or a divergence. In an uptrend, a common approach is waiting for CCI to dip below -100 during a pullback, then buying when it crosses back above -100 with a confirming candle.
In a range, buy when CCI exits oversold near support and sell when it exits overbought near resistance. In every case, wait for price action confirmation and set your invalidation level before entering.
Turning CCI Into a Real Edge
The whole framework compresses into one decision rule.
If price is trending strongly, treat extreme CCI readings as strength confirmation and hunt pullback entries in the trend’s direction. If price is ranging, treat the same extremes as mean-reversion opportunities with tighter risk and faster exits.
Everything else, the period selection, the divergence types, the volatility filters, is detail hanging off that single question: range or trend?
No indicator removes uncertainty.
CCI will not tell you where the market is going, and it will never replace disciplined stop placement or sane position sizing. It measures one thing well: how far price has moved from its own average, and how fast.
Your next step is deliberately small.
Pick one CCI period.
Write down your bias rule, your setup condition, and your invalidation logic on a single page. Then run it on a demo chart for two weeks and log every trade before a single dollar goes at risk.
Two weeks of honest data beats two years of guessing.
Risk Disclaimer: Trading involves risk. Past performance doesn't guarantee future results. Only trade with money you can afford to lose. PipTrend is a tool to assist your trading decisions, not financial advice.