Crude Oil Futures Contract Explained for Traders
On this page
What a Crude Oil Futures Contract Really Is
Most new traders think they are buying oil.
They are not.
They are taking on a standardized obligation that gets repriced against them, or in their favor, every single trading day.
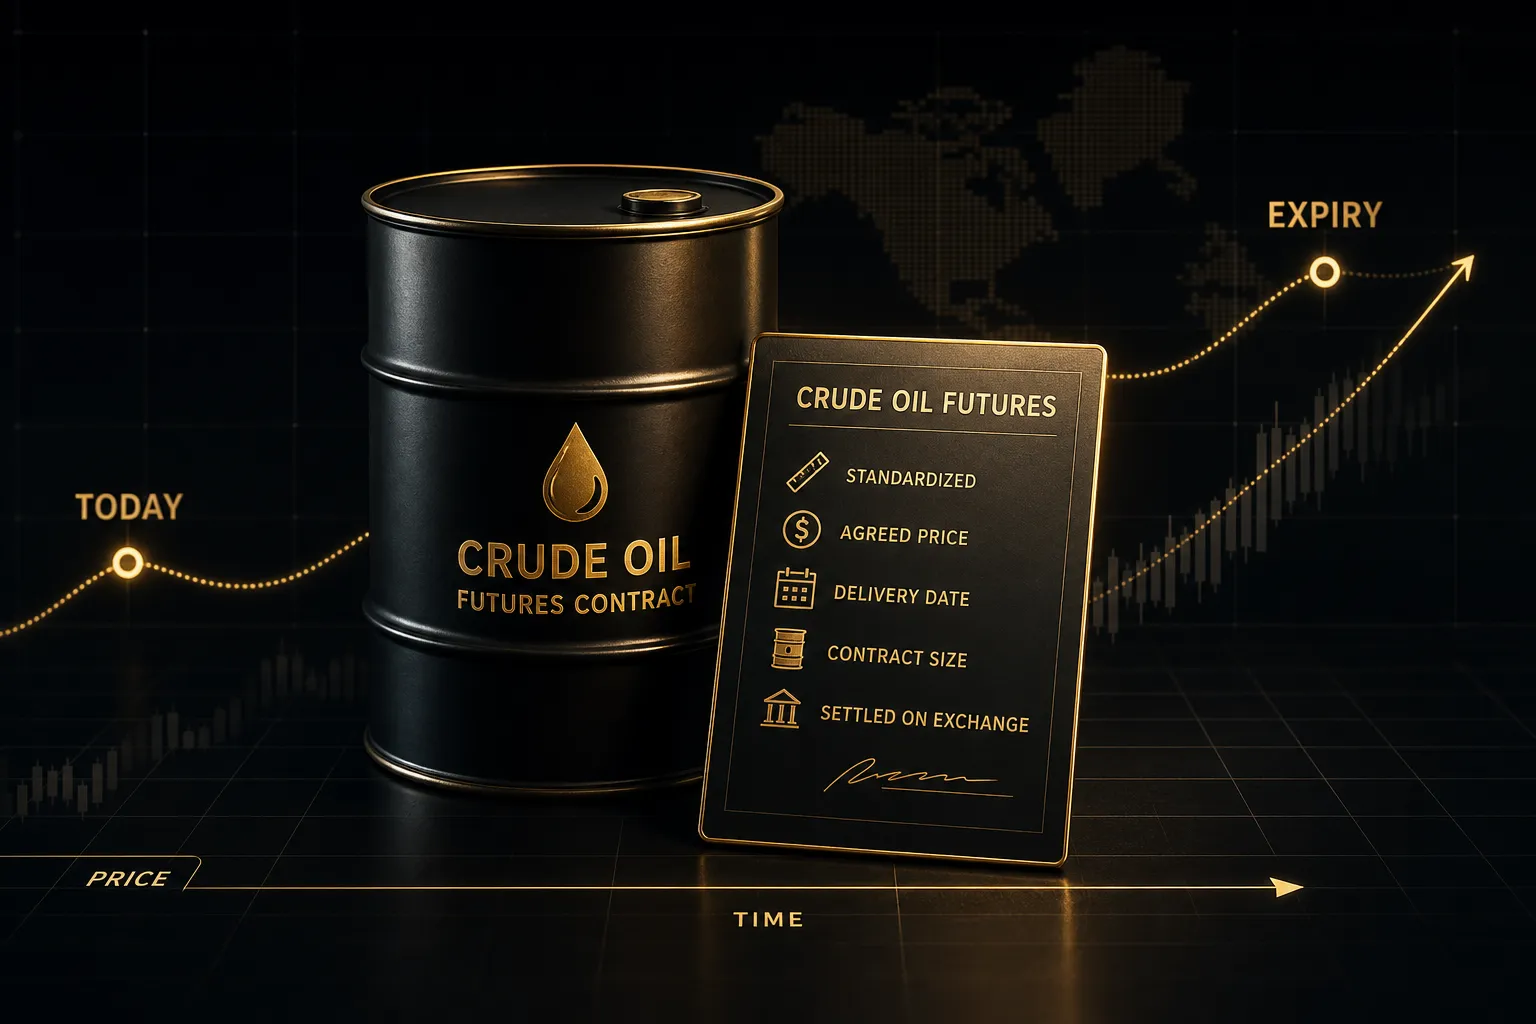
A crude oil futures contract is an exchange-traded, centrally cleared agreement to buy or sell 1,000 barrels of West Texas Intermediate crude at an agreed price on a specified future date. The size, the quality grade, the delivery point, and the expiration calendar are all fixed by the exchange.
The only variable you negotiate is price.
That standardization is what separates a futures contract from a private forward agreement.
There is no handshake, no counterparty credit check, no custom terms.
The clearinghouse steps between buyer and seller, and your position is marked to market daily, with cash moving in and out of your account as variation margin.
Roughly 99% of crude oil futures contracts never result in a barrel changing hands. They are offset before delivery, closed by an equal and opposite trade.
This guide follows a practical workflow.
Understand what the contract actually obligates you to do. Calculate your real dollar exposure per tick. Read the futures curve so you know whether time is working for or against you. Layer fundamental analysis and technical analysis together. Then define your risk before you click buy.
The focus here is NYMEX WTI, symbol CL, listed by CME Group. It is the deepest, most heavily traded crude benchmark for US-based traders, and its mechanics carry over to almost every other energy contract you might trade later.
How the Contract Is Built
Every detail of a CL contract exists for a reason, and most of those reasons trace back to one goal: making two strangers able to trade a physical commodity without ever meeting.
Standardized and Exchange-Cleared
The building blocks of the contract are fixed in the futures contract specifications published by the exchange. Here is what each one does:
- Contract size: 1,000 barrels. Every CL contract represents exactly 1,000 barrels of crude. Not approximately. Exactly. This is why a $1 move in the quoted price equals $1,000 per contract.
- Quality specification. The deliverable grade is light sweet crude meeting defined sulfur content (0.42% or less) and API gravity limits (between 37 and 42 degrees). Several foreign grades are deliverable at set premiums or discounts, which keeps the contract from being cornered by a single producer.
- Delivery point: Cushing, Oklahoma. All physical settlement happens at the Cushing pipeline hub. That single geographic point matters enormously, because Cushing is landlocked. When storage there fills up, the contract can dislocate from global oil prices.
- Minimum price fluctuation: $0.01 per barrel. That is the tick size, and it produces a tick value of $10.00 per contract.
- Clearinghouse guarantee. CME Clearing becomes the buyer to every seller and the seller to every buyer. You never carry counterparty credit risk against the trader on the other side of your fill. You carry it against the clearinghouse, which is backed by a multi-billion-dollar financial safeguards waterfall.
- Trading hours. CL trades nearly around the clock on Globex, Sunday evening through Friday afternoon US Central time, with a daily maintenance break. Liquidity is not evenly distributed across those hours. Not even close.
CL, QM, and MCL Symbols
Crude futures symbols encode three things: the product, the contract month, and the year. Read CLZ26 as CL (WTI crude) + Z (December) + 26 (2026).
The month codes are standardized across all futures markets: F=January, G=February, H=March, J=April, K=May, M=June, N=July, Q=August, U=September, V=October, X=November, Z=December.
The front-month futures contract is the nearest expiration still trading. It usually carries the heaviest volume and the tightest spreads, which is why most active traders live there.
But as expiration approaches, open interest migrates to the next month.
In the final week before expiry, the “front month” and the “most active month” are often two different contracts, and trading the wrong one means wider spreads and thinner books.
CME lists three WTI contracts scaled for different account sizes:
- CL (standard WTI). 1,000 barrels, $10.00 per $0.01 tick. The institutional benchmark and the most liquid crude contract on earth, routinely trading hundreds of thousands of contracts a day.
- QM (E-mini crude). 500 barrels, half the size of CL. Minimum fluctuation is $0.025 per barrel, giving a $12.50 tick value. Note the trap: the tick is larger in dollars than CL’s even though the contract is smaller, because the tick increment is coarser. Liquidity is modest.
- MCL (Micro WTI). 100 barrels, one-tenth of CL, with a $0.01 tick worth $2.50. Launched in 2021, MCL has become the standard entry point for retail traders who want real crude exposure without $10 per tick swings.
One more distinction that trips people up.
NYMEX WTI futures are physically delivered. ICE Brent crude oil futures are financially settled against an index. Cash-settled lookalike products exist for both benchmarks.
Never assume settlement type from the ticker.
Check the spec sheet for the exact contract you are trading.
What a Move Actually Costs You
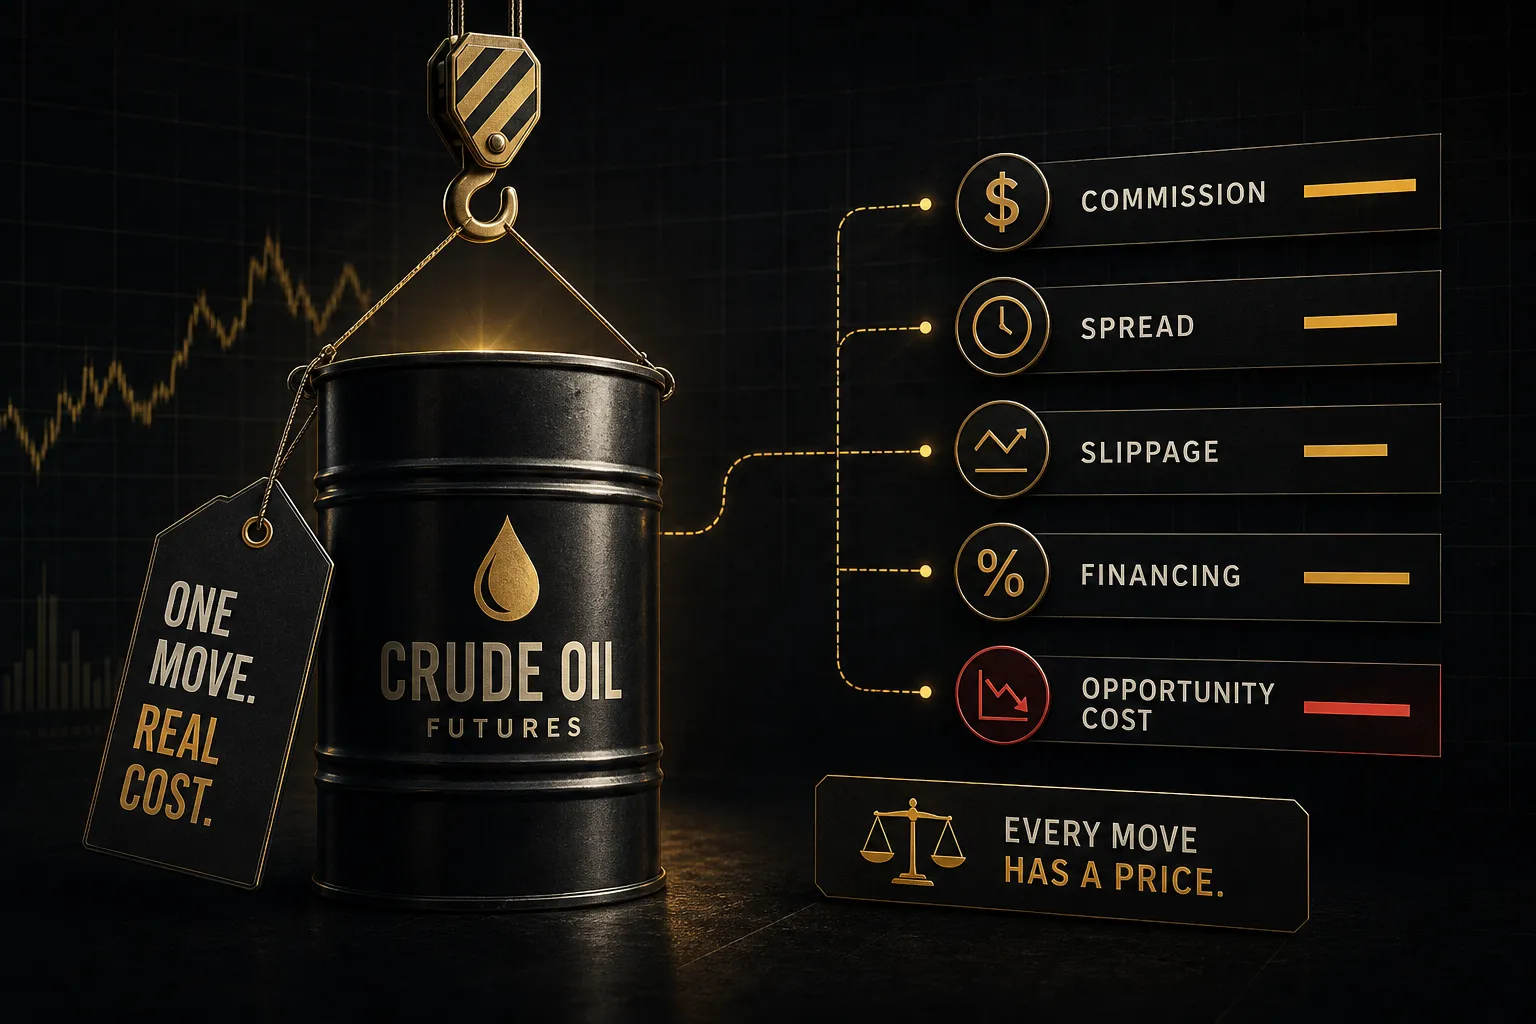
Here is the number that surprises people: at $75 per barrel, a single CL contract controls $75,000 of crude oil.
The margin to hold it overnight might be around $6,000. Some brokers will let you day-trade it for a few hundred dollars.
Margin Is a Performance Bond, Not a Down Payment
When you buy a house with 20% down, the 20% is your equity in the asset.
Futures margin does not work that way at all.
Initial margin is a good-faith performance bond, a deposit the clearinghouse holds to cover potential one-day losses on your position.
You have not purchased 20% of a barrel.
You have posted collateral against an obligation covering the full 1,000 barrels.
The practical consequence: your losses are not capped at your margin deposit.
If crude gaps $8 against a single CL position overnight, that is an $8,000 loss regardless of whether you posted $6,000 or $600.
The shortfall becomes a debit balance you owe your broker.
Maintenance margin is the lower threshold your account equity must stay above.
Fall below it and you get a margin call, requiring you to either wire funds or reduce position size.
Ignore it and the broker liquidates for you, at whatever price the market offers.
Margin levels are not fixed.
CME raises them when volatility rises, sometimes mid-session, and brokers routinely apply their own higher requirements on top.
A margin figure quoted in an article from 2023 is worthless in 2026.
Pull the current numbers from your broker’s margin table before every position.
Calculating Real Dollar Risk
Work the arithmetic before the trade, not after. Assume crude moves $0.50 per barrel against you, a completely ordinary intraday range component:
- One CL contract: 50 ticks x $10.00 = $500
- One QM contract: 20 ticks x $12.50 = $250
- One MCL contract: 50 ticks x $2.50 = $125
On a $10,000 account, that routine $0.50 wiggle is 5% of equity in CL and 1.25% in MCL.
Same market view.
Same chart.
Radically different survival odds.
| Contract | Size (barrels) | Tick Size | Tick Value | Notional at $75/bbl | Typical Overnight Margin Range |
|---|---|---|---|---|---|
| CL (WTI Crude) | 1,000 | $0.01 | $10.00 | $75,000 | $5,000, $9,000 |
| QM (E-mini Crude) | 500 | $0.025 | $12.50 | $37,500 | $2,500, $4,500 |
| MCL (Micro WTI) | 100 | $0.01 | $2.50 | $7,500 | $500, $900 |
Margin ranges are indicative only and shift with volatility.
Verify current requirements with your broker.
Notional value is the number that should anchor your position sizing, not margin.
Margin tells you what you must deposit. Notional tells you what you are actually exposed to.
A trader holding three CL contracts at $75 is carrying $225,000 of crude exposure, whatever the margin screen says.
Run the calculation in the other direction too.
If your risk limit is $200 per trade and your technical stop sits $0.35 away, that is 35 ticks.
In CL, 35 ticks is $350, over your limit. In MCL, it is $87.50, and you could take two contracts and still be inside budget.
Expiration, Delivery, and the Futures Curve
In April 2020, WTI futures settled at negative $37.63 per barrel.
Gasoline at the pump did not become free.
That single episode taught an entire generation of traders that a futures contract is not the same thing as “the price of oil.”
First Notice Date and Last Trading Date
Two dates govern the end of a contract’s life, and confusing them is expensive.
The last trading day for NYMEX WTI is the third business day prior to the 25th calendar day of the month preceding the delivery month.
In plain terms, the December 2026 contract stops trading in late November 2026.
After that, remaining positions go to physical settlement at Cushing.
First notice day is when short holders can begin issuing delivery notices. For CL, delivery obligations attach after the last trading day, but for many commodity contracts first notice arrives earlier, and most retail brokers block new positions and force liquidation well before either date.
You have three choices as expiry approaches.
Close the position and take the result. Roll it by simultaneously exiting the near month and entering the next. Or hold into delivery, which for an individual trader without pipeline capacity at Cushing is not a real option.
Most brokers begin auto-liquidating retail crude positions several days before last trading day.
Know your broker’s specific cutoff.
Do not learn it from a liquidation confirmation email.
Contango, Backwardation, and the Roll
Line up the settlement prices for the next twelve contract months and you get the futures curve.
Its shape tells you something about physical market conditions, not about where prices are headed.
Contango is an upward-sloping curve: deferred months trade above the front month.
This typically reflects the cost of carry, meaning storage fees, insurance, and the financing cost of holding barrels.
Contango deepens when inventories are high and nobody urgently needs oil today.
Backwardation is the opposite: the front month trades above deferred months.
This signals scarcity.
Buyers are paying a premium for immediate barrels, a phenomenon economists call convenience yield.
Backwardation usually accompanies tight inventories, supply disruptions, or strong refinery demand.
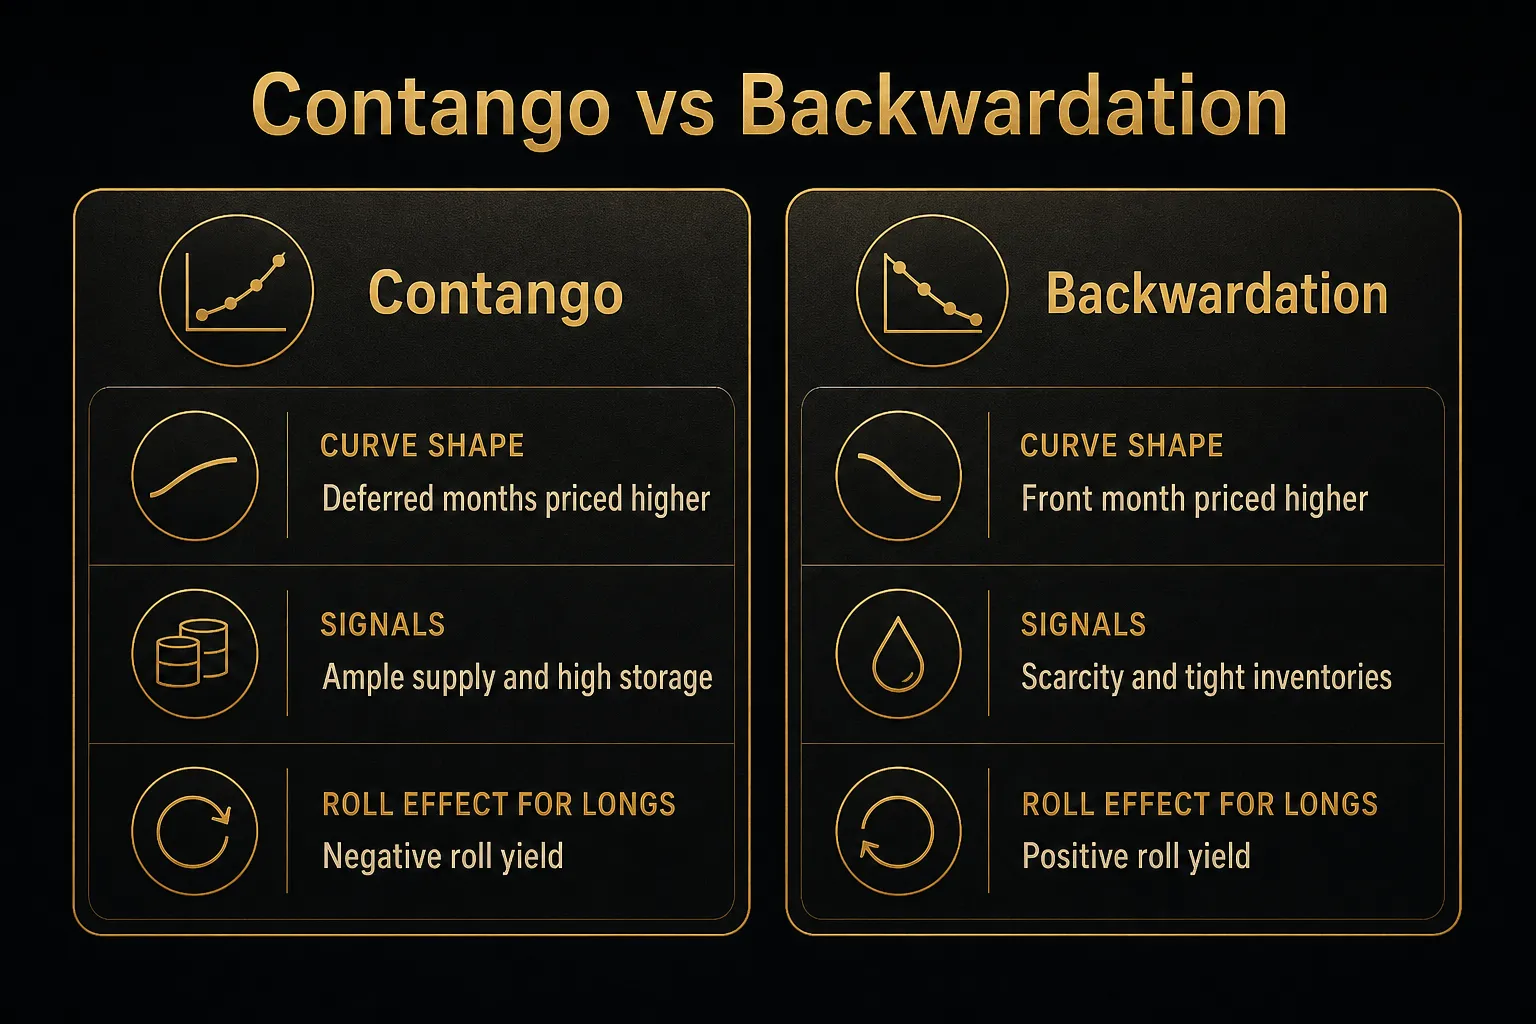
Curve shape creates roll yield, a return stream completely separate from your directional view.
In contango, a long who rolls sells the cheaper expiring month and buys a more expensive deferred month, bleeding value each cycle.
In backwardation, that same roll adds value.
This is why long-term crude index products can lose money over a year when spot crude finished flat.
The roll did the damage, not the price.
WTI vs Brent, Spot vs Futures
WTI and Brent differ in three concrete ways, and the spread between them reflects all three.
Geography. WTI is delivered at Cushing, roughly 500 miles from the Gulf Coast, dependent on pipeline capacity.
Brent is waterborne North Sea crude, loadable onto tankers and shippable anywhere.
When Cushing storage tightens or pipelines bottleneck, WTI can decouple sharply from global pricing.
Quality. WTI is lighter and sweeter than Brent, so it should theoretically command a premium. It often trades at a discount instead, because logistics matter more than assay.
Settlement. NYMEX WTI is physically delivered. ICE Brent is financially settled.
That structural difference is precisely why WTI could print negative prices in 2020 while Brent, with no forced physical obligation at a landlocked hub, did not.
The gap between the futures price and the actual cash market price of a barrel is basis risk.
For hedgers, basis risk is the reason a perfect hedge does not exist.
For speculators, it is the reason the futures screen and the pump price tell different stories.
Reading Catalysts and Setting Up a Trade
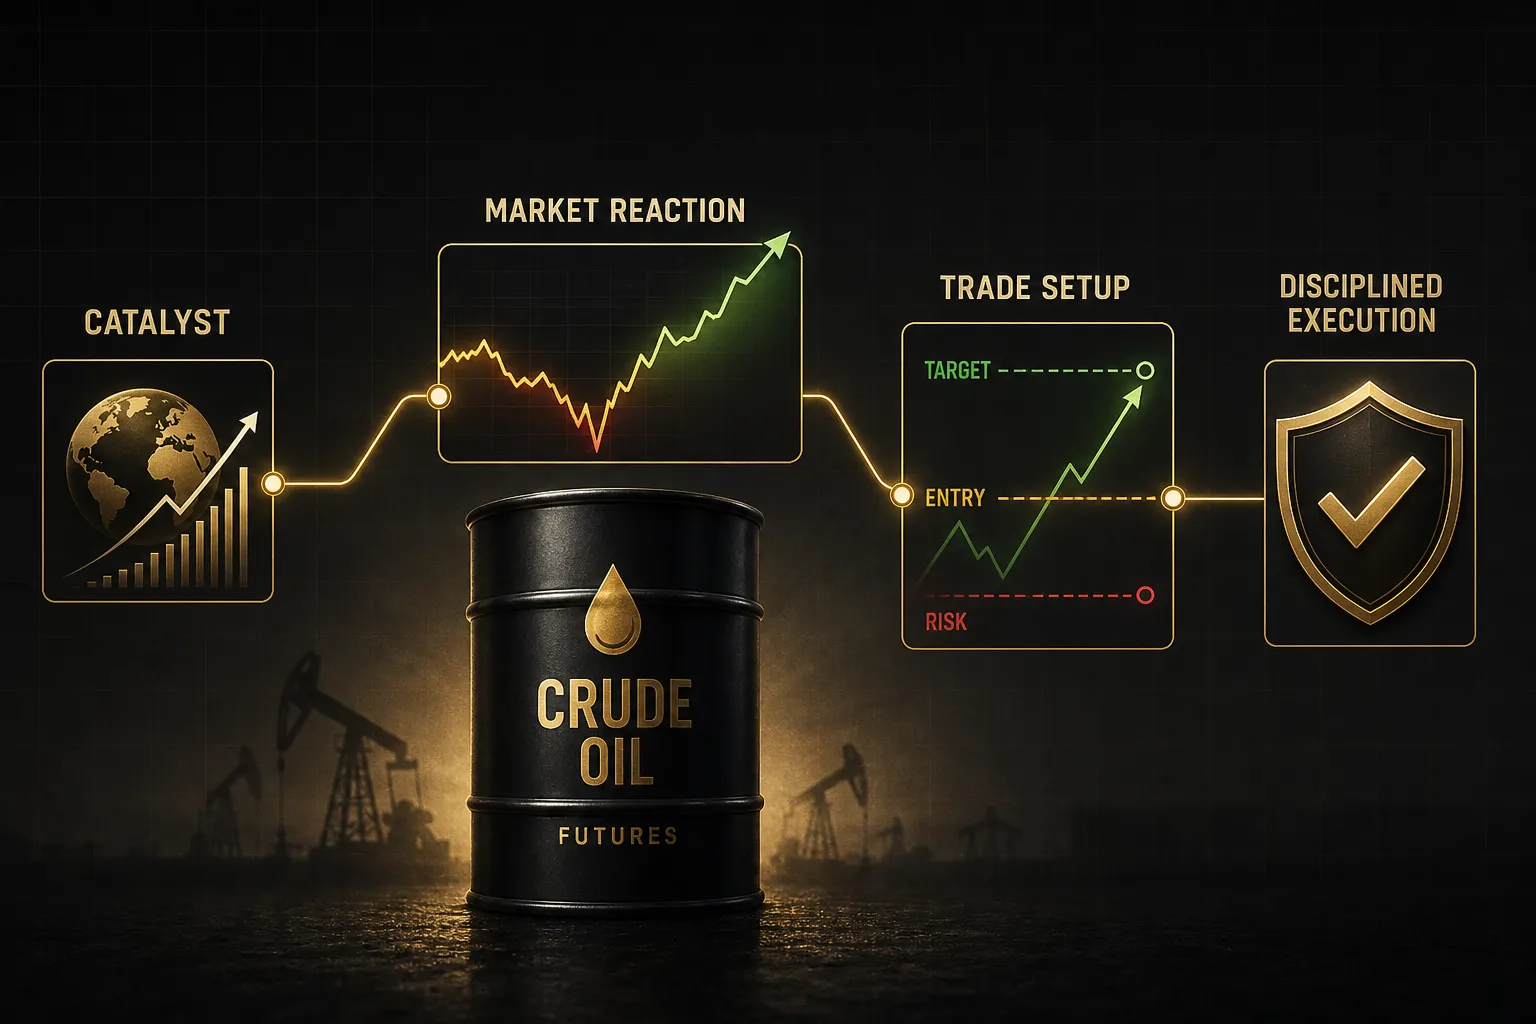
Crude is arguably the most headline-sensitive liquid futures market in the world. A single sentence from an OPEC delegate can move the front month a dollar in seconds.
Structure beats reaction.
Fundamental Triggers to Watch
These are the recurring events that reprice the front-month contract, and what they typically do:
- EIA Weekly Petroleum Status Report (Wednesdays, 10:30 a.m. ET). The EIA inventory report covers crude stocks, gasoline, distillates, and Cushing-specific storage. A build well above consensus is bearish; a large draw is bullish. Expect a 1% to 2% move within minutes, sometimes more.
- API inventory estimate (Tuesdays, after the close). The private-sector preview of EIA data. Correlation is imperfect, which is why a bullish API followed by a bearish EIA produces violent reversals.
- OPEC+ meetings and production guidance. Quota changes, compliance reports, and voluntary cuts move the whole curve, not just the front month. Watch the language around compliance as closely as the headline number.
- Refinery utilization rates. High refinery utilization means more crude consumed as feedstock, supporting prices. Seasonal maintenance in spring and autumn reliably softens crude demand while tightening product markets.
- Supply disruptions. Hurricanes in the Gulf of Mexico, pipeline outages, sanctions enforcement, and unplanned field shutdowns. These hit fast and often fade faster than traders expect.
- Geopolitical headlines. Conflict near shipping chokepoints such as the Strait of Hormuz produces a risk premium. Risk premia decay when nothing further happens.
- Commitments of Traders report (Fridays, 3:30 p.m. ET). The Commitments of Traders data shows managed-money positioning. Extreme net-long readings mark crowded trades vulnerable to unwinds.
- Dollar strength and macro data. Crude is priced in dollars, so a rising dollar is a mild headwind. Global growth data shifts demand expectations across the whole curve.
Confirming Setups With Price Action
Fundamentals tell you which direction has the wind behind it.
They do not tell you where to enter or where you are wrong.
Liquidity is the first practical filter.
Front-month CL fills within a tick during New York hours. The same order in a contract eight months out can slip several ticks.
And during the 10:30 a.m. EIA release, spreads widen for everyone, including you.
Slippage around news is not a broker problem.
It is a market-structure reality.
Stop orders become market orders when triggered, and in a fast crude market that can mean fills five to fifteen ticks past your level.
Overnight sessions compound this, with thinner books and occasional gap opens on Sunday evening.
Multi-timeframe alignment is the most reliable way to separate directional bias from entry timing.
When the daily, four-hour, and one-hour trends agree, pullback entries have a better base rate than counter-trend fades.
Tools like PipTrend’s color-coded trend candles and 12-timeframe confirmation table exist to make that alignment visible at a glance, showing where higher timeframes agree and where they conflict.
Used properly, that is a filter for when not to trade.
No confirmation tool removes risk from a leveraged contract.
It organizes information; it does not predict outcomes.
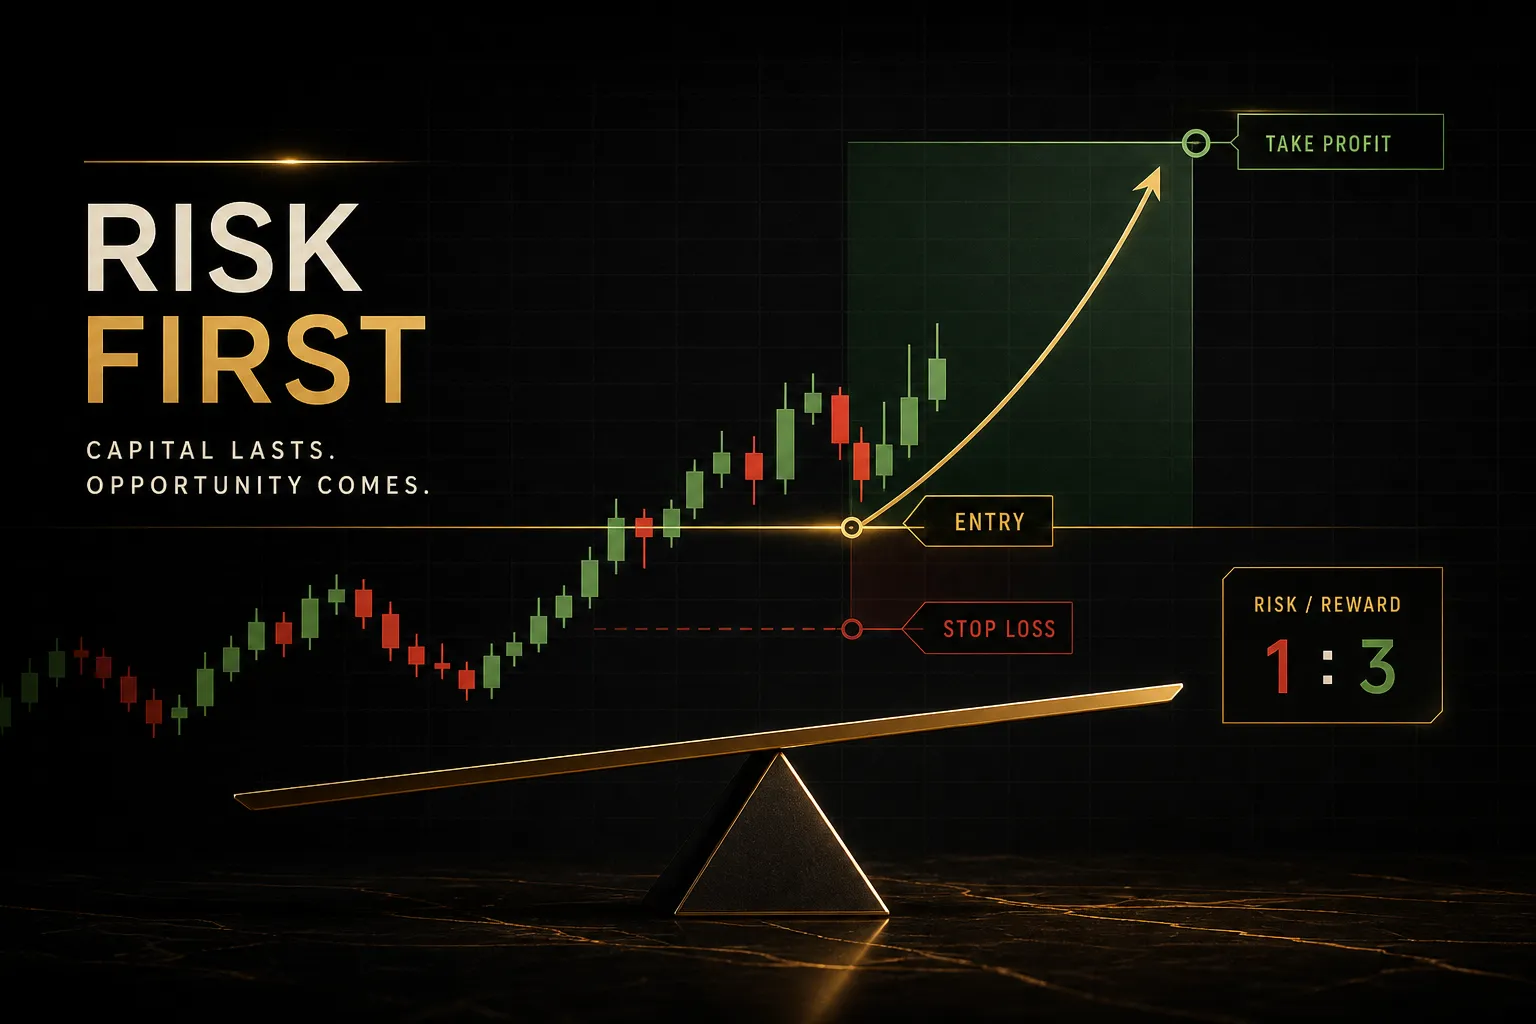
Sizing Risk Before You Enter
Position sizing is arithmetic, and it comes before entry, not after. The sequence:
- Set your risk budget. Decide the maximum dollar loss for this trade, typically 0.5% to 2% of account equity. On a $25,000 account at 1%, that is $250.
- Measure stop distance in ticks. If your invalidation level sits $0.42 below entry, that is 42 ticks. Place it where your idea is genuinely wrong, not where the loss feels tolerable.
- Convert to dollars per contract. 42 ticks costs $420 in CL, $105 in MCL. Only one of those fits a $250 budget.
- Choose the contract, then the quantity. Two MCL contracts risk $210, inside budget. Contract selection follows the math. It is not a status decision.
- Add a slippage buffer. Assume your stop fills three to five ticks worse than posted during volatile sessions, and size so that buffer still leaves you within budget.
Account equity dictates contract choice.
A $5,000 account trading a single CL contract is risking meaningful percentages of capital on ordinary noise.
That is not aggression.
It is a mathematical guarantee of eventual liquidation.
Frequently Asked Questions
How much is one crude oil futures contract worth?
Multiply the current price per barrel by 1,000 for a standard CL contract.
At $75 per barrel, one contract carries a notional value of $75,000. At $82, it is $82,000.
For QM, multiply by 500. For MCL, multiply by 100, so the same $75 price gives $7,500 of exposure.
This is notional value, not what you deposit.
Margin is a fraction of it.
What is the minimum amount to trade crude oil futures?
There is no fixed minimum, because it depends on your broker’s day-trading margin, the exchange’s overnight requirement, and current volatility. Day-trade margins on MCL can run in the low hundreds of dollars, while overnight CL margin frequently exceeds $6,000.
Practically, a realistic account for trading MCL with proper risk control starts around $2,000 to $5,000.
For CL, think in five figures.
Always verify current requirements in the CME margin table and with your broker rather than relying on published estimates.
What happens if you hold crude oil futures until expiration?
You take on a physical delivery obligation for 1,000 barrels of crude at Cushing, Oklahoma. Retail traders essentially never reach that point, because brokers force-liquidate open positions days before the last trading day.
Forced liquidation happens at prevailing market prices, whenever the broker’s risk desk decides, which may be an unfavorable moment. If you want continuous exposure, roll deliberately into the next contract month on your own schedule.
Is crude oil futures trading risky?
Yes, and the leverage is the reason.
Controlling $75,000 of crude with $6,000 of margin means a 2% price move against you erases roughly a quarter of your posted collateral.
Losses are not limited to your deposit.
Crude gaps overnight, reacts violently to geopolitical headlines, and has printed negative prices within living memory.
Without a predefined stop-loss risk level and disciplined position sizing, an account can be damaged in a single session.
What is the difference between WTI futures and Brent futures?
WTI is landlocked crude delivered physically at Cushing, Oklahoma; Brent is seaborne North Sea crude that settles financially on ICE. That structural gap drives the WTI-Brent spread.
WTI is lighter and lower in sulfur, but Brent’s waterborne access to global markets often earns it a premium.
WTI tracks US supply, Cushing storage, and shale output.
Brent is the reference for roughly two-thirds of internationally traded crude.
How do you read a crude oil futures contract symbol?
Split the symbol into three parts: root, month code, and year. CLZ26 means CL (WTI crude oil), Z (December), 26 (2026), so it is the December 2026 WTI contract.
Month codes run F, G, H, J, K, M, N, Q, U, V, X, Z for January through December.
MCLM26 is the June 2026 Micro WTI contract.
Some platforms display the same contract as CL Z6 or CLZ2026, but the logic is identical.
Trading the Contract, Not the Headline
Traders spend enormous energy trying to guess where crude goes next. The ones who survive spend it elsewhere: on contract size, on margin mechanics, on knowing exactly when their contract stops trading.
Price prediction is the least controllable variable in this market.
Exposure per tick is fully controllable.
So is stop placement.
So is whether you are holding a contract three days from its last trading day without a roll plan.
Here is one concrete step before your next live order.
Take the stop distance you intend to use, count it in ticks, and multiply by the tick value of the specific contract you plan to trade.
If that dollar figure is larger than you would comfortably lose ten times in a row, you are either sizing down or moving to MCL.
Do that calculation every time and something shifts. Trading stops being a series of bets on headlines and becomes a repeatable process with known exposure.
No confirmation tool, no inventory report, no trend indicator eliminates uncertainty in a leveraged market. Consistency comes from the part you can actually control… the math you do before you enter.
Sources
Risk Disclaimer: Trading involves risk. Past performance doesn't guarantee future results. Only trade with money you can afford to lose. PipTrend is a tool to assist your trading decisions, not financial advice.