
Day trading is entering a new era as 2026 approaches, with rapid market changes driven by technology and data. Traders face more complexity, faster movements, and new asset classes than ever before.
In this landscape, mastering day trading technical indicators is essential. Advanced analytics, artificial intelligence, and increased volatility mean that relying on proven tools can help traders improve timing, manage risk, and achieve more consistent profits.
This article will guide you through 7 essential day trading technical indicators every trader must know for 2026. Each indicator is explained with actionable insights, so you can adapt and thrive in the evolving markets.
Understanding Technical Indicators in Day Trading
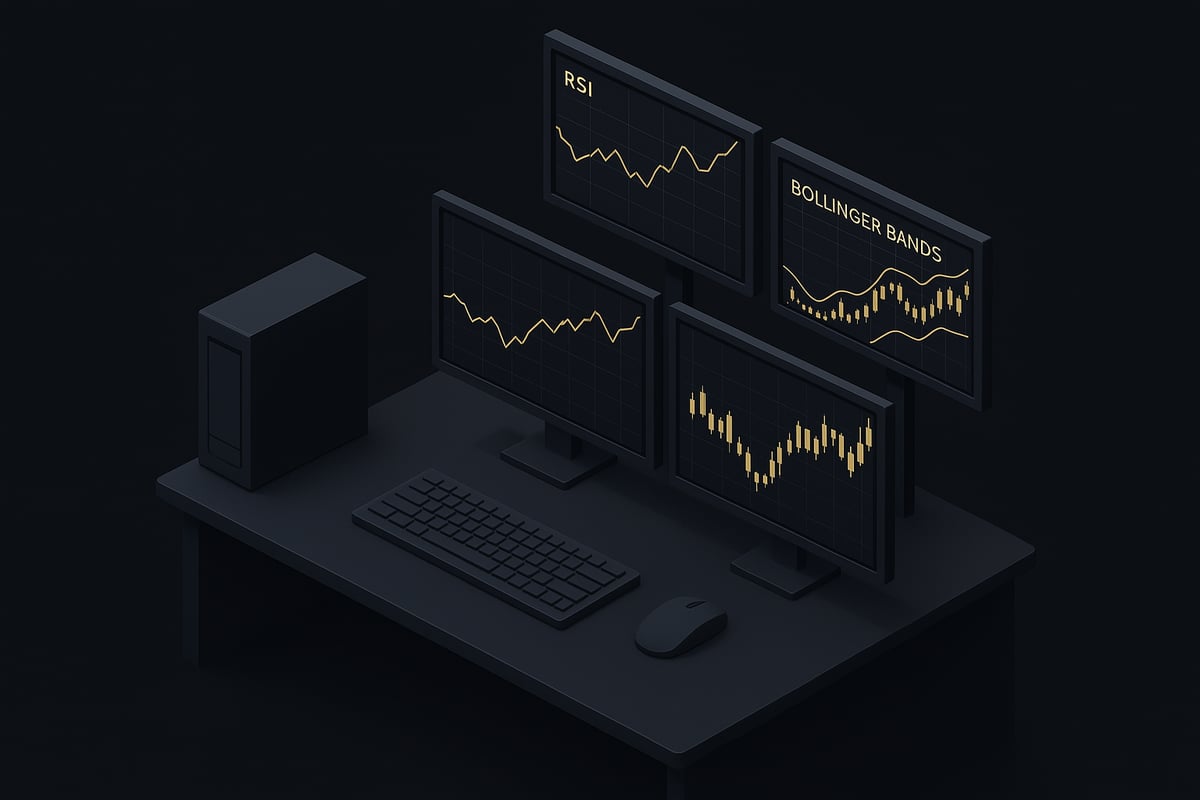
The world of day trading technical indicators is built on precise, data-driven tools that help traders interpret market action. Technical indicators are mathematical calculations applied to price, volume, or open interest data. These tools can be overlays, such as Moving Averages that sit directly on price charts, or oscillators like RSI that move above and below a central line.
Their primary purpose is to forecast potential price movements and highlight trading opportunities. Modern trading platforms now integrate these indicators as standard, making it easier for day traders to access sophisticated analysis with just a few clicks. If you want a deeper dive into the most commonly used tools, the best indicators for day trading resource offers a helpful overview.
What Are Technical Indicators?
Technical indicators are essential components in day trading technical indicators strategies. They transform raw market data into actionable insights by utilizing formulas that track price and volume changes. Overlays, like simple or exponential moving averages, appear directly on the price chart to show the overall trend. Oscillators, such as the Relative Strength Index (RSI), fluctuate within a set range, helping traders identify when an asset may be overbought or oversold.
These indicators serve as early warning systems for price reversals or trend continuations. By interpreting their signals, traders can better anticipate market moves and make informed decisions. Modern platforms make these calculations seamless, allowing even novice traders to benefit from advanced analytics.
Why Technical Indicators Matter in 2026
The significance of day trading technical indicators has only increased as we approach 2026. With the rise of algorithmic trading and the speed at which markets move, relying solely on intuition is no longer sufficient. Today, more than 70 percent of day traders use at least two technical indicators per trade, according to recent estimates.
Combining multiple indicators creates more robust trading signals, reducing the likelihood of false positives. As new asset classes, like digital currencies, become mainstream, adapting indicator strategies is crucial. Traders who stay flexible and update their tools to fit current market conditions will have a distinct edge.
Types of Technical Indicators
There are several categories of day trading technical indicators, each serving a unique purpose:
| Type | Examples | Primary Use |
|---|---|---|
| Trend-following | Moving Averages, MACD | Identifying market direction |
| Momentum | RSI, Stochastic Oscillator | Gauging strength of price moves |
| Volatility | Bollinger Bands, ATR | Measuring price fluctuations |
| Volume-based | OBV, Volume Profile | Tracking trading activity |
Understanding these types helps traders select the right tools for their strategy. Each indicator brings a different perspective, offering insights into trend strength, momentum, volatility, or volume patterns.
How to Choose the Right Indicators for Your Strategy
Selecting the best day trading technical indicators requires aligning them with your trading style, whether it is scalping, swing trading, or momentum-based. Backtesting your chosen indicators against historical data is vital to ensure reliability and avoid costly mistakes.
It is important to combine complementary indicators rather than stacking similar ones, which can lead to redundant or conflicting signals. For example, pairing MACD to identify trends with RSI for entry and exit confirmation creates a balanced and effective approach. Continual adjustment and learning are key to refining your strategy as markets evolve.
7 Essential Day Trading Technical Indicators for 2026
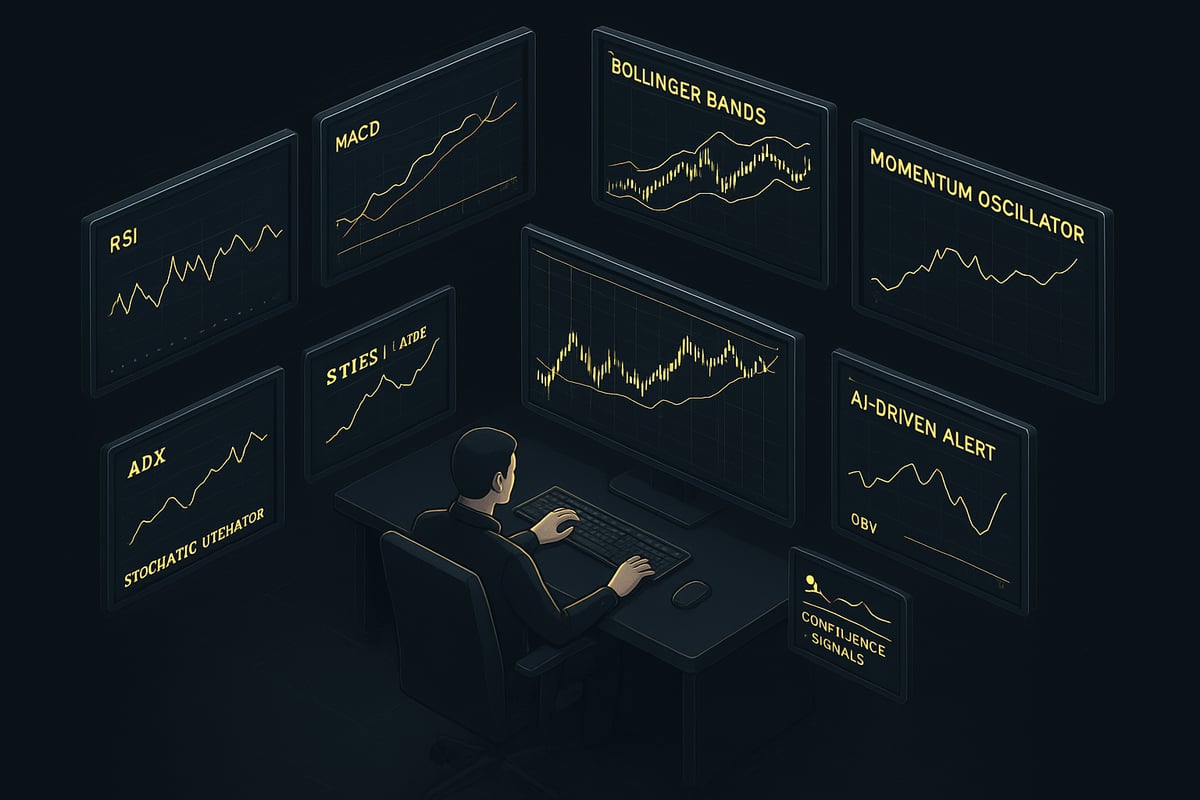
Navigating the world of day trading technical indicators in 2026 demands precision, speed, and adaptability. The following seven indicators have stood the test of time, evolving alongside technology and market dynamics. Each plays a unique role in shaping profitable, data-driven strategies for today’s fast-paced trading environment.
1. Relative Strength Index (RSI)
The Relative Strength Index (RSI) remains a cornerstone among day trading technical indicators. RSI measures the speed and magnitude of recent price changes, oscillating between 0 and 100. Traditionally, values above 70 indicate overbought conditions, while values below 30 suggest oversold levels.
In 2026, with markets more volatile than ever, RSI’s ability to pinpoint entry and exit points is crucial. For example, a divergence between price and RSI can signal an impending trend reversal. If prices hit a new high but RSI forms a lower high, traders often anticipate a pullback.
RSI adapts well to new asset classes like cryptocurrencies and indices. Its popularity persists, with recent data showing it remains a top 3 choice among traders. Pairing RSI with other day trading technical indicators, like moving averages, enhances accuracy.
For a comprehensive understanding, explore the RSI indicator explained guide, which details calculation methods, settings, and advanced strategies.
Quick Summary:
- Type: Momentum oscillator
- Range: 0-100
- Best Use: Identifying reversals and timing trades
- Pro Tip: Use RSI divergence for early trend warnings
2. Moving Average Convergence Divergence (MACD)
The Moving Average Convergence Divergence (MACD) blends trend-following and momentum, making it a favorite among day trading technical indicators. MACD uses two exponential moving averages (EMAs) to generate signals: the MACD line and the signal line. The histogram visualizes the difference between these lines.
Traders watch for crossovers, where the MACD line crosses above the signal line, often interpreted as a buy signal. Conversely, a bearish crossover signals potential selling opportunities. MACD also highlights divergences, which can warn of weakening trends.
In 2026, MACD’s real strength lies in its adaptability across stocks, forex, and crypto. Algorithmic systems frequently use MACD for its reliability in fast-paced environments. Recent surveys cite MACD as the “most reliable” among day trading technical indicators, especially when combined with other tools.
Key Features:
- Type: Trend and momentum
- Components: MACD line, signal line, histogram
- Best Use: Spotting trend changes and momentum shifts
- Example: Bullish crossover in a volatile market
3. Bollinger Bands
Bollinger Bands rank high among day trading technical indicators, especially for volatility analysis. They consist of a moving average (the middle band) and two outer bands set by standard deviations. When bands tighten (the “squeeze”), it signals low volatility and a potential breakout.
In 2026, with unpredictable markets, Bollinger Bands help define risk zones. If price touches the upper band, traders may look for selling opportunities, while a touch at the lower band suggests potential buys. The bands also help set stop-loss and take-profit levels, crucial for managing risk.
Customization is key. Traders adjust the period and standard deviation settings to fit different asset classes, from stocks to digital currencies. Top traders consistently cite Bollinger Bands as essential for risk management among day trading technical indicators.
At a Glance:
- Type: Volatility indicator
- Bands: Upper, middle, lower
- Best Use: Spotting breakouts, setting trade boundaries
- Pro Tip: Watch for the “squeeze” before volatile moves
4. Average Directional Index (ADX)
The Average Directional Index (ADX) measures the strength, not the direction, of a trend. ADX values above 25 indicate a strong trend, while values below 20 suggest a weak or sideways market. The indicator includes +DI and -DI lines to show directional movement.
In the realm of day trading technical indicators, ADX helps traders avoid choppy, range-bound periods that can erode profits. For instance, a rising ADX above 30 signals a robust trend worth trading. ADX is also valuable for filtering out false signals from other indicators.
Automated trading systems in 2026 increasingly rely on ADX, especially in crypto and indices. Recent data shows a significant uptick in ADX usage for these asset classes.
Fast Facts:
- Type: Trend strength
- Range: 0-100
- Best Use: Confirming trend validity
- Example: Rising ADX confirms market momentum
5. Stochastic Oscillator
The Stochastic Oscillator is a momentum tool comparing a security’s closing price to its price range over a specified period. It generates values from 0 to 100, with readings above 80 indicating overbought and below 20 oversold.
Among day trading technical indicators, the Stochastic Oscillator excels at spotting reversals in short timeframes. When the %K line crosses above the %D line in the oversold zone, it often signals a buying opportunity. This crossover is popular among scalpers and high-frequency traders seeking quick trades.
Combining the Stochastic Oscillator with RSI or other indicators provides more robust signals. Its relevance continues to grow in algorithm-driven markets, where rapid decision-making is vital.
Overview:
- Type: Momentum oscillator
- Signals: Overbought/oversold, crossovers
- Best Use: Timing entries and exits
- Pro Tip: Combine with RSI for higher accuracy
6. On-Balance Volume (OBV)
On-Balance Volume (OBV) is a volume-based indicator that tracks cumulative buying and selling pressure. By adding volume on up days and subtracting it on down days, OBV provides a running total that helps confirm price trends or warn of reversals.
For day trading technical indicators, OBV is invaluable in spotting “smart money” moves before they manifest in price action. A rising OBV supports the validity of an uptrend, while divergence between OBV and price can foreshadow reversals.
OBV’s adoption has grown by 20% among day traders since 2024, especially in thinly traded assets and crypto. Used alongside price action, OBV validates trade setups and reduces the risk of false signals.
Key Points:
- Type: Volume-based
- Best Use: Confirming trends, detecting reversals
- Example: OBV divergence as early warning
- Pro Tip: Pair with trend indicators for confirmation
7. Momentum Oscillator
The Momentum Oscillator measures the speed of price changes, indicating whether a trend is likely to continue or reverse. Unlike fixed-bound oscillators, it requires traders to set custom support and resistance levels for their chosen asset.
This indicator excels at filtering out market noise, a critical feature in the crowded field of day trading technical indicators. For example, when momentum crosses a predetermined threshold, it often signals a strong move, helping traders act quickly.
Momentum Oscillators are widely used in AI-driven and automated platforms. Recent studies cite them as “most predictive,” underscoring their value in modern strategies. Their effectiveness spans stocks, forex, and digital assets, making them a versatile choice for 2026.
In Brief:
- Type: Momentum
- Signals: Trend continuation or reversal
- Best Use: Confirming breakout strength
- Pro Tip: Adjust thresholds for asset volatility
Comparison Table: 7 Essential Day Trading Technical Indicators
| Indicator | Type | Best For | Key Strength |
|---|---|---|---|
| RSI | Momentum | Reversals, timing | Early warnings |
| MACD | Trend/Momentum | Trend changes | Reliability, adaptability |
| Bollinger Bands | Volatility | Breakouts, risk management | Customizable boundaries |
| ADX | Trend Strength | Confirming trends | Avoiding false signals |
| Stochastic Oscillator | Momentum | Quick reversals, scalping | Fast signals |
| OBV | Volume | Trend confirmation, reversals | Smart money detection |
| Momentum Oscillator | Momentum | Continuation, breakout strength | AI/automation-friendly |
The right combination of day trading technical indicators can dramatically improve your trading results. By mastering these tools, traders equip themselves to navigate the complexity of 2026’s financial markets with greater confidence and precision.
How to Combine Technical Indicators for Maximum Effectiveness
Combining day trading technical indicators is an art that separates disciplined traders from the rest. By integrating multiple indicators, you can extract richer insights, reduce false signals, and improve your trading accuracy. The right mix can transform your trading strategy, especially in the fast-paced markets of 2026.
The Power of Confluence: Using Multiple Indicators
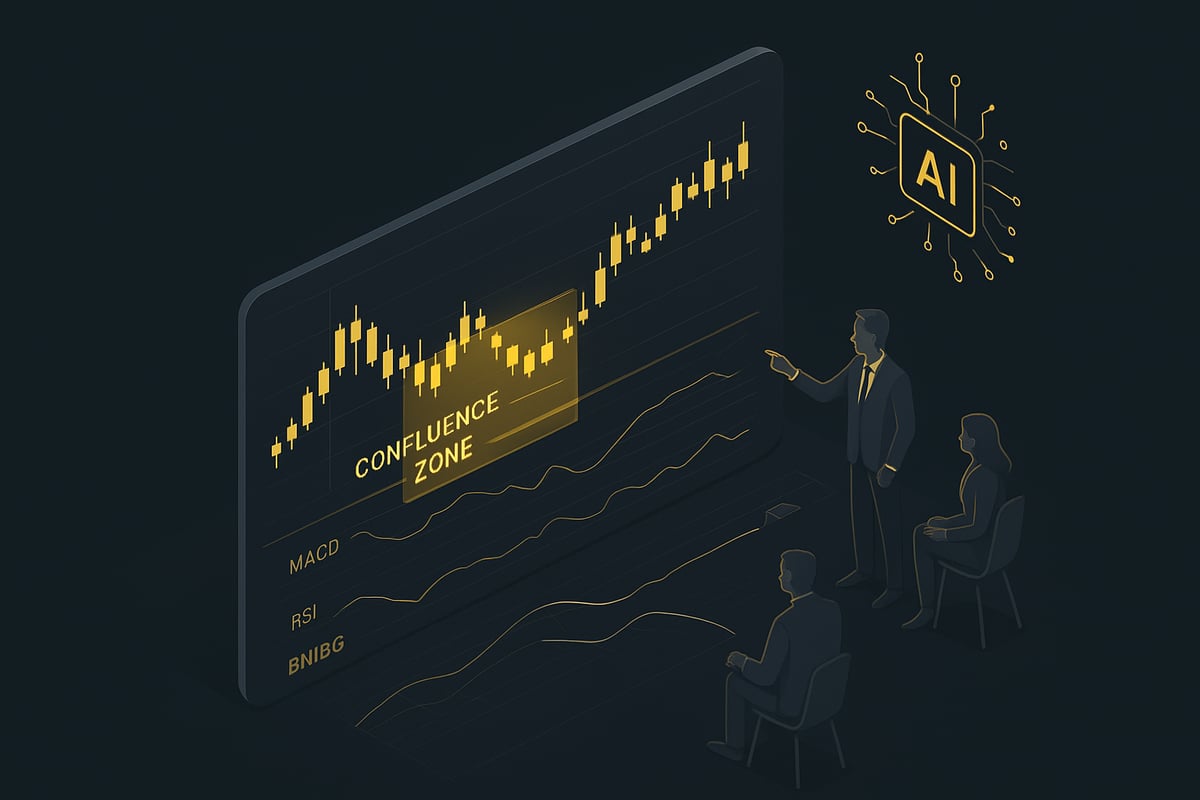
The concept of confluence means combining signals from different day trading technical indicators to strengthen your trade decisions. When multiple tools, such as MACD, RSI, and Bollinger Bands, align to suggest the same direction, your probability of a successful trade increases.
For example, a bullish MACD crossover confirmed by RSI rising from oversold territory and a Bollinger Band squeeze breakout can create a high-probability setup. You can explore more about MACD in this MACD indicator guide to see how it fits into multi-indicator strategies.
By relying on confluence, you reduce the risk of acting on isolated or misleading signals. This approach is especially valuable as market volatility and complexity increase.
Avoiding Overfitting and Redundancy
Using too many similar day trading technical indicators can lead to overfitting, where your strategy becomes too tailored to past data and loses effectiveness in live markets. Redundancy occurs when you combine tools that provide the same type of information, such as multiple momentum indicators, which can clutter your analysis without adding value.
To avoid these pitfalls, select complementary indicators that each offer unique insights. For example, pairing a trend indicator like a moving average with a momentum tool like RSI and a volume-based indicator creates a balanced approach. This method helps ensure your signals are robust and actionable.
Carefully backtest your chosen combination to confirm it works across different market conditions. Simplicity often leads to greater clarity and better results.
Practical Examples and Case Studies
Let’s walk through a real-world scenario using day trading technical indicators. Suppose you spot a potential reversal in a stock. First, RSI dips below 30, suggesting oversold conditions. Next, the MACD line crosses above the signal line, indicating a momentum shift. Lastly, the price touches the lower Bollinger Band, signaling a potential bounce.
You could summarize this setup in a table:
| Indicator | Signal | Interpretation |
|---|---|---|
| RSI | Below 30 | Oversold |
| MACD | Bullish crossover | Momentum shift |
| Bollinger Bands | Touch lower band | Possible bounce |
By waiting for confluence among these day trading technical indicators, you improve your odds of a successful entry.
Common Mistakes and How to Avoid Them
One common mistake is over-relying on a single indicator, which can leave you vulnerable to false signals. Another error is ignoring the broader market context, such as news or unexpected volatility, which can render technical signals less reliable.
Not adapting indicator settings to current market volatility is also a pitfall. For example, using default parameters in highly volatile crypto assets may lead to missed opportunities. Always backtest your strategy and adjust settings as markets evolve.
Continuous learning and a commitment to testing your day trading technical indicators are key to long-term success. Review your trades regularly and refine your approach to stay ahead.
Adapting Your Indicator Strategy for 2026 and Beyond
The landscape of day trading technical indicators is shifting rapidly as 2026 approaches. Traders are facing new challenges, from market volatility to the rise of complex digital assets. Adapting your approach to these changes is crucial for staying profitable and resilient in the years ahead.

Evolving Market Conditions and New Asset Classes
Day trading technical indicators must adapt as markets become more dynamic and unpredictable. In 2026, increased volatility and widespread algorithmic trading are reshaping the trading environment. Digital assets like cryptocurrencies are now mainstream, demanding faster and more responsive strategies.
Traders can no longer rely solely on traditional signals. For example, crypto markets move with greater speed and unpredictability, making flexible day trading technical indicators essential for timely decision-making. By staying alert to these shifts, you can better position yourself for the opportunities and risks that come with new asset classes.
Customizing Indicator Settings for Modern Markets
Personalizing your day trading technical indicators is vital for modern success. Adjusting lookback periods, fine-tuning thresholds, and setting up custom alert systems help tailor your tools to the assets and timeframes you trade.
Consider this practical table for indicator customization:
| Setting | Traditional Market | 2026 Digital Asset Market |
|---|---|---|
| Moving Average Period | 20 | 8 |
| RSI Thresholds | 70/30 | 80/20 |
| Alert Frequency | Hourly | Real-time |
Using AI-driven platforms can automate these adjustments, ensuring your indicators remain accurate. For instance, shortening your moving average period can help capture quicker trends in crypto, making your day trading technical indicators more responsive to rapid market changes.
Integrating AI and Automation with Technical Indicators
Artificial intelligence is transforming the way traders use day trading technical indicators. AI-powered trading tools now analyze vast datasets, generate signals, and even optimize indicator parameters without manual intervention.
Automation reduces emotional bias and increases consistency for traders at every level. According to Artificial Intelligence in Financial Trading, AI-driven indicators are outperforming traditional approaches by identifying subtle patterns and adapting to evolving market trends. Leveraging AI allows you to execute trades with greater precision, harnessing the full potential of day trading technical indicators in 2026.
Continuous Learning and Backtesting
Staying ahead in day trading technical indicators requires a commitment to ongoing education. Markets evolve, and so should your strategies. Regularly reviewing new research, attending webinars, and learning from industry leaders enhances your edge.
Backtesting is equally important. By using robust backtesting tools, you can validate your indicator strategies against historical data. Studies show that traders who consistently backtest their approaches with day trading technical indicators see up to 25 percent higher profitability. Continuous learning ensures your methods stay effective, while backtesting builds confidence in your decision-making process.
Frequently Asked Questions About Day Trading Indicators
How Many Indicators Should I Use?
Finding the right balance with day trading technical indicators is essential. Most professionals recommend using two or three complementary indicators per setup. This approach offers clarity without overwhelming you with conflicting signals.
Consider combining trend, momentum, and volume indicators for a well-rounded view. For example, a setup might include a moving average for trend detection, RSI for momentum, and On-Balance Volume for confirmation. The table below highlights common combinations:
| Trading Style | Trend Indicator | Momentum Indicator | Volume Indicator |
|---|---|---|---|
| Scalping | EMA | Stochastic | OBV |
| Swing | SMA | RSI | Volume Profile |
| Momentum | MACD | Momentum | OBV |
Remember, using too many day trading technical indicators can lead to confusion and missed opportunities. Focus on quality over quantity to keep your strategy effective.
Are These Indicators Effective for Crypto and Forex?
Day trading technical indicators are highly adaptable and work across asset classes, including crypto and forex. However, customization is key. Since crypto markets can be more volatile, you may need to adjust indicator settings to capture quicker price movements.
For example, using shorter moving average periods or tweaking RSI thresholds can improve responsiveness. Many traders now explore advanced methods like Technical Indicator Networks (TINs) to modernize their approach for digital assets.
Experiment with different combinations and timeframes to find what suits your preferred market. Day trading technical indicators remain fundamental tools for spotting opportunities in both forex and crypto environments.
How Do I Avoid False Signals?
Avoiding false signals requires confirmation and context. Never rely on a single indicator for decision-making. Instead, wait for confluence among multiple day trading technical indicators before entering a trade.
Multi-timeframe analysis is another effective strategy. For example, check signals on both 5-minute and 15-minute charts to filter out noise. Incorporating volatility tools like Bollinger Bands strategy can further validate setups by highlighting price extremes.
Always adapt indicator settings to current market conditions. Backtest your strategies regularly to ensure your chosen indicators consistently deliver reliable signals.
You’ve just explored the seven essential technical indicators that can shape your day trading success in 2026, from mastering market momentum to managing risk with precision. As we’ve seen, having real time, reliable signals is crucial in today’s fast paced and ever evolving markets. If you’re ready to turn this knowledge into consistent results and trade with more confidence, why not put these strategies into action using an AI powered tool built for traders like you See Your Trading Improve With PipTrend and discover how clear signals can transform your next trading session.
See Your Trading Improve With PipTrend