Fundamental Indicators in Forex: A Trader's Framework
On this page
Why Every Pip Starts With an Economic Number
US nonfarm payrolls beat forecast by 80,000 jobs. The dollar drops 60 pips in four minutes.
If that sounds broken, you are not alone.
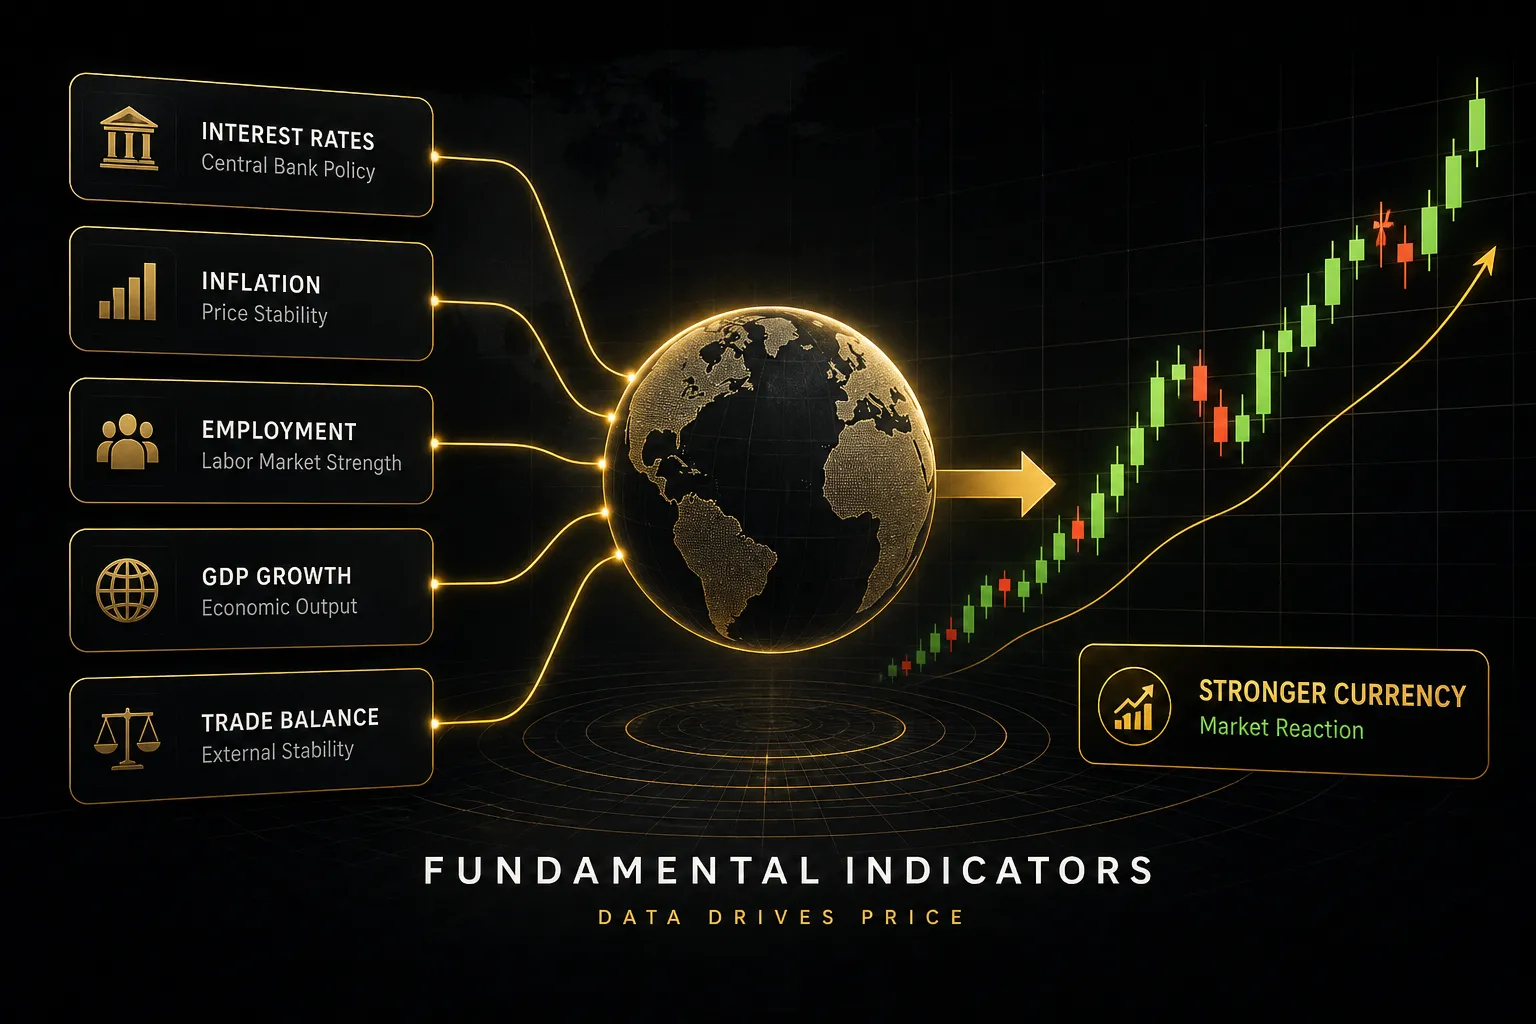
Most guides on fundamental indicators forex traders should watch hand you a list: GDP, CPI, nonfarm payrolls, interest rate decisions.
Useful.
But they never explain why the identical “strong” print sends a currency higher in March and lower in June.
The answer is that markets do not trade data.
They trade the gap between data and what was already expected, filtered through what a central bank is likely to do about it.
This article walks the full decision chain, in order: a data surprise shifts rate expectations, rate expectations move the yield differential between two economies, that differential drives relative currency strength, currency strength tells you which pair to trade, and technicals tell you where to enter.
Skip a link in that chain and you end up guessing.
By the end you will be able to do something more valuable than memorizing one country’s economic calendar. You will be able to sit down with two economies, compare their growth momentum, inflation trends, and policy paths side by side, and produce a directional bias you can actually defend.
Then you will know how to turn that bias into an entry with defined risk, instead of clicking buy the moment a headline flashes red.
What Fundamental Indicators Actually Are
Think of technical indicators as the patient’s vital signs on a monitor.
Fundamental indicators are the bloodwork.
Fundamental indicators are economic data releases and central bank policy communications that reflect the health, momentum, and likely direction of an economy.
They live on an economic calendar, not on a price chart. Moving averages, RSI, and Bollinger Bands are derived from price itself; CPI, PMI surveys, and rate decisions come from statistical agencies and policymakers.
That distinction matters because the two answer different questions.
Fundamentals answer why a currency should move. Technicals answer where and when to act on it.
Leading, Coincident, and Lagging Signals
Macroeconomic indicators fall into three timing buckets, and confusing them is one of the most expensive beginner mistakes in forex fundamental analysis.
Leading indicators move before the broader economy does. PMI surveys, weekly initial jobless claims, building permits, consumer confidence, and the shape of the yield curve all belong here.
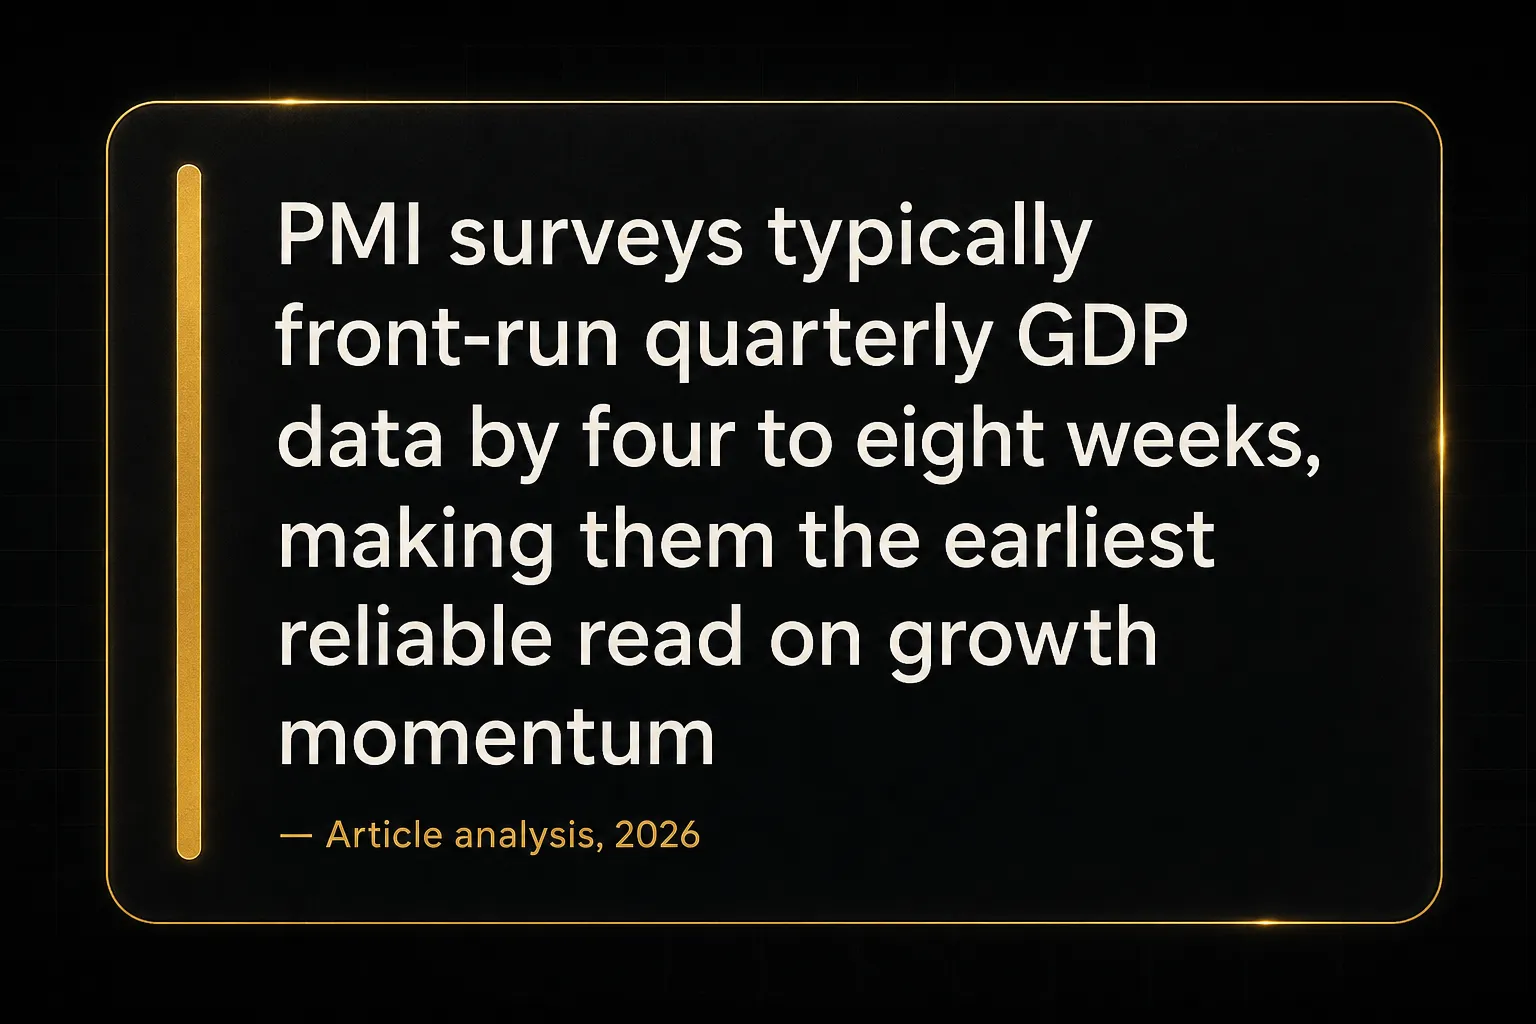
PMI is the standout: because it is a survey of purchasing managers taken during the month itself, it typically front-runs quarterly GDP data by four to eight weeks.
Coincident indicators move roughly in step with the cycle. GDP growth, industrial production, retail sales, and personal income tell you where the economy is right now, or more accurately, where it was a few weeks ago.
Lagging indicators confirm what already happened. The unemployment rate is the classic example, usually peaking well after a recession has ended.
Trend CPI behaves similarly, since prices adjust slowly to demand shifts.
A trader who waits for the unemployment rate to confirm a slowdown is reading the story after the market has finished writing it.
The practical rule: use leading data to form a thesis, coincident data to size it, and lagging data to know when the thesis has been fully absorbed by everyone else.
Why Forex Trades in Relative Terms
Here is the concept that separates equity thinking from currency thinking. A stock can rise on its own merits.
A currency cannot.
Every currency pair is a comparison between two economies and two central banks.
USD/JPY does not price the US economy. It prices the Federal Reserve against the Bank of Japan, specifically the gap between their policy paths and the resulting interest rate differential.
Strong US data with equally strong Japanese data can leave USD/JPY flat. Mediocre US data paired with collapsing Japanese data can send it soaring.
Absolute strength is almost irrelevant.
Monetary policy divergence is everything.
Eight central banks drive the vast majority of G10 flow, and serious traders track all of them: the Federal Reserve (USD), European Central Bank (EUR), Bank of England (GBP), Bank of Japan (JPY), Bank of Canada (CAD), Reserve Bank of Australia (AUD), Swiss National Bank (CHF), and Reserve Bank of New Zealand (NZD).
Map their expected rate paths against each other and you have a ranking of currency strength before you look at a single chart. The pairs with the widest and fastest-widening differentials are where trends form.
The Data That Actually Moves Pairs
Not all releases are created equal.
A rate decision can move a major pair 150 pips in seconds; a trade balance print often barely registers on the tape.
The table below ranks the releases that matter most for G10 forex, with the trader profile that should actually care about each one.
| Indicator | What It Measures | Frequency | Market Impact | Who Cares Most |
|---|---|---|---|---|
| Central bank rate decision | Policy rate plus forward guidance on future path | Every 6-8 weeks | Very high | All three: intraday, swing, position |
| CPI / Core CPI | Consumer price inflation; core excludes food and energy | Monthly | Very high | Intraday and swing |
| PCE Price Index | Fed’s preferred inflation gauge; broader basket than CPI | Monthly | High | Swing and position |
| Nonfarm payrolls | US job creation, unemployment rate, average hourly earnings | Monthly (first Friday) | Very high | Intraday and swing |
| PMI surveys (mfg + services) | Business activity expectations; 50 is the expansion line | Monthly (flash + final) | Medium to high | Swing and position |
| GDP growth | Total output; confirms cycle direction after the fact | Quarterly (3 estimates) | Medium | Position |
| Retail sales | Consumer demand, roughly two-thirds of most G10 economies | Monthly | Medium to high | Swing |
| Initial jobless claims | Weekly labor market stress signal | Weekly (Thursday) | Low to medium | Swing |
| PPI | Producer input costs; upstream preview of consumer inflation | Monthly | Medium | Swing and position |
| Trade balance / current account | Net export flows and structural capital flow demand | Monthly / quarterly | Low to medium | Position |
Interest Rates and Policy Expectations
Interest rate expectations are the single most powerful short-term driver of currency strength.
Not the current rate.
The expected path.
Money flows toward higher risk-adjusted returns.
When markets price the Fed holding at 4% while the ECB is expected to cut toward 2%, capital rotates into dollar assets, widening the real yield differential (nominal yield minus expected inflation) and pushing EUR/USD lower.
Two mechanisms carry the flow.
The carry trade: borrow in the low-yielding currency, hold the high-yielding one, pocket the spread. And portfolio capital flows: global fund managers reweighting toward the bond market offering better real returns.
This is why forward guidance often moves pairs more than the decision itself. A central bank that holds rates but signals two cuts ahead has just repriced the entire front end of its yield curve.
The pair reacts to the signal, not the hold.
Track 2-year government bond yield spreads between the two countries in a pair. That spread is the cleanest single proxy for where the exchange rate wants to go over the medium term.
Inflation Gauges: CPI, Core CPI, PCE, PPI
Four inflation measures, four different jobs.
Traders who treat them interchangeably get blindsided regularly.
- Headline CPI includes everything, food and energy included. It captures what households actually feel, which makes it politically loaded and volatile.
- Core CPI strips out food and energy, the two most erratic components. Central banks weight it heavily because it reveals the underlying trend rather than an oil price spike.
- PCE Price Index is the Federal Reserve’s preferred gauge. It uses a broader, dynamically weighted basket that accounts for consumers substituting cheaper goods, and it typically runs 0.2 to 0.4 percentage points below CPI.
- PPI measures producer input costs. Because those costs pass through to consumers with a lag, a sharp PPI move often previews the CPI print one to three months out.
The sequencing trick: PPI gives you an early read, CPI moves the market on release day, and core PCE tells you what the Fed will actually respond to. When they disagree, the divergence itself is tradeable information.
Growth and Labor Market Signals
GDP is the headline everyone quotes and the one professionals react to least.
By the time a quarterly figure lands, it describes activity from up to five months ago and has usually been reverse-engineered from monthly data already released.
The higher-frequency picture is where edge lives.
PMI surveys arrive twice monthly (flash and final) and the 50 level is a clean binary: above signals expansion, below signals contraction. A drop from 52 to 48 is a regime change, not a rounding error.
Nonfarm payrolls carries three numbers, and the market frequently cares most about the third. Job creation, the unemployment rate, and wage growth (average hourly earnings) each feed different parts of the inflation story.
Hot wages with soft job creation is a stagflation signal that can override the headline entirely.
Initial jobless claims are weekly, which makes them the fastest labor signal available. A four-week moving average breaking to new highs has historically preceded labor market deterioration by two to three months.
Why Good News Can Send a Currency Down

Back to that 80,000-job beat that crushed the dollar.
Nothing about it was irrational.
Actual, Forecast, Previous, and Revisions
Four inputs determine the initial reaction to any economic release, and the headline number is only one of them.
The actual print.
The consensus forecast that was priced in beforehand.
The previous reading for trend context.
And the revision to that previous reading, which is where most surprises hide.
Take the payrolls example properly. Headline comes in at 260,000 against a 180,000 forecast.
Looks like a blowout.
But the prior month gets revised down from 240,000 to 155,000, erasing 85,000 jobs, and average hourly earnings decelerate from 0.4% to 0.1% month-on-month.
Net job creation across two months is now roughly flat versus what the market believed an hour earlier.
And cooling wage growth removes the inflation pressure that would have justified higher rates.
The dollar falls.
Correctly.
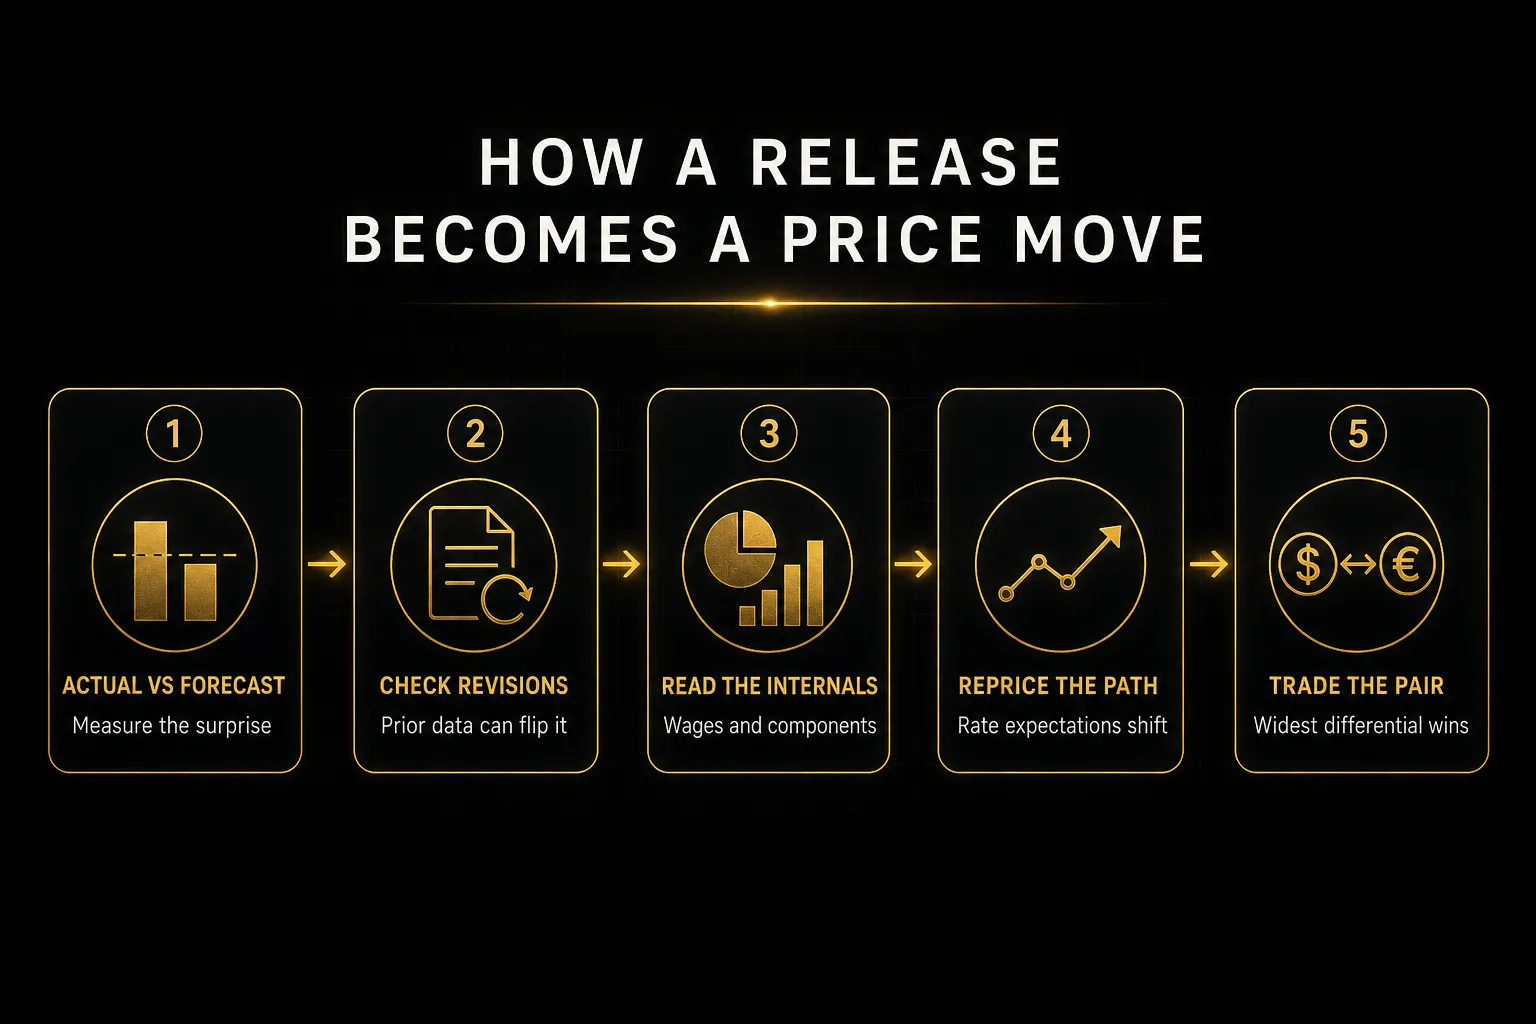
Central banks add another filter.
A committee can look through a strong print if it believes the strength is temporary, distorted by seasonal adjustment, driven by one-off factors like a strike ending, or already accounted for in current policy. When that happens, the data surprise dies at the central bank’s door and the currency barely moves.
When the Move Is Already Priced In
Markets are discounting machines.
They trade tomorrow’s expectations, not today’s facts.
If interest rate futures already price an 85% probability of a hike, and the hawkish data arrives on schedule, there is almost no room left for the pair to move. The information was absorbed weeks ago through positioning.
The inverse creates the biggest opportunities.
When positioning is heavily one-sided and the data lands against it, forced unwinding amplifies the move well beyond what the surprise alone justifies. That is why the largest currency moves often follow modest data misses in crowded trades.
The size of a currency’s reaction depends on the gap between the data and market expectations, not on the absolute strength of the number.
Practical check before any high-impact release: look at where rate futures sit, look at how far the pair has already traveled in the direction the data would support, and ask what would actually surprise this market.
If you cannot name a scenario that shocks anyone, sit out.
From Macro Bias to a Live Trade
A macro thesis with no entry rule is an opinion.
Here is how to convert one into a trade with defined risk.
A Repeatable Pair-Analysis Worksheet
- Name the two economies, not the pair. Write down the base currency and quote currency separately. EUR/USD becomes “Eurozone versus United States,” which forces comparative thinking from the first line.
- Score the interest rate differential and its trend. Record the current policy rate for each, the 2-year yield spread, and whether that spread widened or narrowed over the past month. Direction of travel matters more than the level.
- Compare growth momentum. Put the latest composite PMI for each economy side by side, plus the most recent GDP growth rate. Note which is accelerating and which is stalling.
- Compare inflation trends. Log core CPI year-on-year for both, and mark whether each is moving toward or away from its central bank’s target. A currency whose inflation is re-accelerating usually gains a hawkish policy tailwind.
- Identify the risk regime. Check equity indices, government bond yields, and gold. Falling yields plus falling stocks plus rising gold equals risk-off, which bids safe-haven currencies like USD, JPY, and CHF regardless of their own data.
- Write one sentence of bias. Something like: “Widening US-Japan yield spread plus risk-on equities supports USD/JPY upside over the next two to four weeks.” If you cannot fit it in one sentence, your thesis is not clear enough.
- Set the invalidation condition. Define the fundamental event that kills the thesis, such as a BOJ policy shift or a US core CPI print below 2.5%. This is separate from your stop loss.
Confirming Bias With Technical Signals
Fundamentals answer direction.
They are terrible at answering “where do I enter and where am I wrong.”
That is a chart problem.
The cleanest workflow keeps the two functions separate rather than blending them into one indicator soup. PipTrend is built around exactly that split: color-coded trend candles answer the directional question at a glance, while session highs and lows, VWAP, and supply and demand zones mark the specific levels where entries and stops belong.
So the macro worksheet tells you to be long USD/JPY. The trend candles confirm the chart agrees.
Then you wait for price to reach a marked demand zone or reclaim VWAP before committing capital.
PipTrend’s multi-timeframe table does the alignment check that most traders skip. If your fundamental bias is bullish but the 4-hour and daily rows disagree with the 15-minute, you are early.
Wait for alignment or reduce size.
The point is not to add more indicators. It is to stop using price action and market structure to guess direction when a rate differential already told you the answer.
Trading Around the Release Itself
The riskiest sixty seconds in forex is the minute after a high-impact print.
Not because the direction is hard to read.
Because the mechanics turn against you.
Spreads on EUR/USD can widen from 0.6 pips to 8 or more.
Stop orders fill at prices that never appeared on your chart.
Liquidity gaps mean your 20-pip stop becomes a 45-pip loss on a correct directional call.
Three rules that protect capital:
- Do not click on the headline. The first spike frequently reverses within 90 seconds as algorithms parse the revisions and internals that humans missed.
- Wait for a candle close. A closed 5-minute or 15-minute candle filters out the liquidity vacuum and shows you where real money settled.
- React to levels, not numbers. If the post-release candle closes above a marked supply zone or session high, that is a signal. A raw beat on the forecast is not.
Position traders have an easier job here: a widening yield differential plays out over weeks, so entering three hours after the release costs almost nothing. Intraday traders pay the spread and take the slippage.
Know which one you are.
Common Questions on Forex Fundamentals
What is the best fundamental indicator for forex?
There is no single best indicator, but interest rate expectations come closest. The expected policy path of a central bank drives the yield differential that determines capital flows into and out of a currency, which makes it the dominant medium-term driver for most G10 pairs.
That said, rate expectations do not form in a vacuum. They are shaped by inflation data (core CPI and PCE) and growth data (PMI surveys and labor market prints).
Read the rate path as the output; read inflation and growth as the inputs.
What are the 3 main factors affecting forex?
Three factors explain most currency movement: interest rate differentials, growth and inflation trends, and risk sentiment with the capital flows it generates.
Rate differentials set the baseline attraction of holding one currency over another. Growth and inflation data move expectations about where those rates go next.
And risk-on risk-off sentiment can override both temporarily, sending money into safe-haven currencies like the dollar, yen, and Swiss franc during stress regardless of their yield advantage.
How do you analyze forex fundamentals?
You analyze fundamentals comparatively, never in isolation. Take both currencies in a pair, compare their policy rates and 2-year yield spread, compare growth momentum via PMI and GDP, compare core inflation trends against each central bank’s target, then check the prevailing risk regime.
The output is a directional bias with a written invalidation condition. From there, technical confirmation determines entry, stop placement, and position size.
Which economic news affects forex the most?
Central bank rate decisions and inflation reports move currency pairs the most, followed by major labor market releases like US nonfarm payrolls.
Rate decisions matter most because forward guidance can reprice an entire yield curve in seconds. CPI releases rank next because they directly shape what the central bank will do at the following meeting.
Payrolls carries outsized weight for the dollar specifically, since wage growth within it feeds the inflation outlook.
Is fundamental analysis better than technical analysis in forex?
Neither is better; they answer different questions and work best together.
Fundamental analysis tells you which currency should strengthen and why. Technical analysis tells you where to enter, where to place a stop, and when the trade is invalidated.
Traders who use only fundamentals tend to be right on direction and wrong on timing, bleeding capital on entries that were correct three weeks too early. Traders who use only technicals fight trends driven by policy divergence they never saw coming.
What is the difference between fundamental and technical indicators in forex?
Fundamental indicators come from outside the chart; technical indicators are calculated from the chart itself. CPI, GDP growth, PMI surveys, trade balance, and interest rate decisions are published by statistical agencies and central banks on an economic calendar.
Moving averages, RSI, MACD, VWAP, and support and resistance levels are all derived from historical price and volume.
One measures the economy. The other measures behavior in the market that trades it.
Trade the Divergence, Not the Headline
One habit will improve your results faster than any new indicator.
Before the next high-impact release, write down three things on paper: the consensus forecast, the previous reading, and where rate expectations currently sit.
Ten minutes of work.
It converts a reactive click into a judgment against a baseline you defined in advance.
Without that baseline, you are guessing whether a number is good. With it, you know instantly whether it was a genuine data surprise or noise the market already absorbed.
The reaction of a currency depends on the gap between data and expectation.
Never on the absolute strength of the print.
A 4% GDP growth rate is bearish if the market priced 5%.
Consistency in forex does not come from calling economies correctly.
It comes from comparing two of them methodically, ranking which central bank is more likely to tighten or ease, and then letting a defined technical framework confirm where to act.
Form the bias with macro.
Time the entry with structure.
Stop guessing at direction, and the trades that remain will be the ones worth taking.
Sources
Risk Disclaimer: Trading involves risk. Past performance doesn't guarantee future results. Only trade with money you can afford to lose. PipTrend is a tool to assist your trading decisions, not financial advice.