Hammer Candlestick Pattern: A Trader's Complete Guide
On this page
Why Most Hammer Guides Get It Wrong
Search “hammer candlestick” and you’ll find a hundred articles showing the same tidy diagram: small body, long lower wick, arrow pointing up.
Clean. Reassuring. And mostly useless in a live market.
The shape is the easy part.
What separates a tradable hammer from a random candle with a long lower shadow is everything around it: what price did for the previous ten sessions, whether it landed on a level anyone cares about, and what the next candle does.
Here’s the thesis this guide is built on.
A hammer is an early warning that selling pressure may be exhausting, not a signal to buy.
It tells you sellers pushed price down and got rejected. It does not tell you buyers have taken control of the trend.
The candle asks a question. The confirmation answers it.
Traders who lose money on hammers almost always skip that distinction. They see the wick, they buy the close, and they get run over by the continuation of a downtrend that was never actually over.
What follows covers identification with real criteria, objective confirmation rules, entry and stop placement with position sizing that comes from the chart rather than a hunch, target methods, and how the pattern behaves differently across stocks, forex, and crypto. Plus the look-alikes that trip up newer traders, and an honest look at reliability.
What Is a Hammer Candlestick?
Picture a session where sellers dominate for hours. Price grinds lower, stops get hit, panic builds. Then, before the close, buyers step in hard and drag price back to where it opened.
That entire story fits into one candle on a Japanese candlestick chart, and that candle is a hammer.
Anatomy of a Hammer Candle
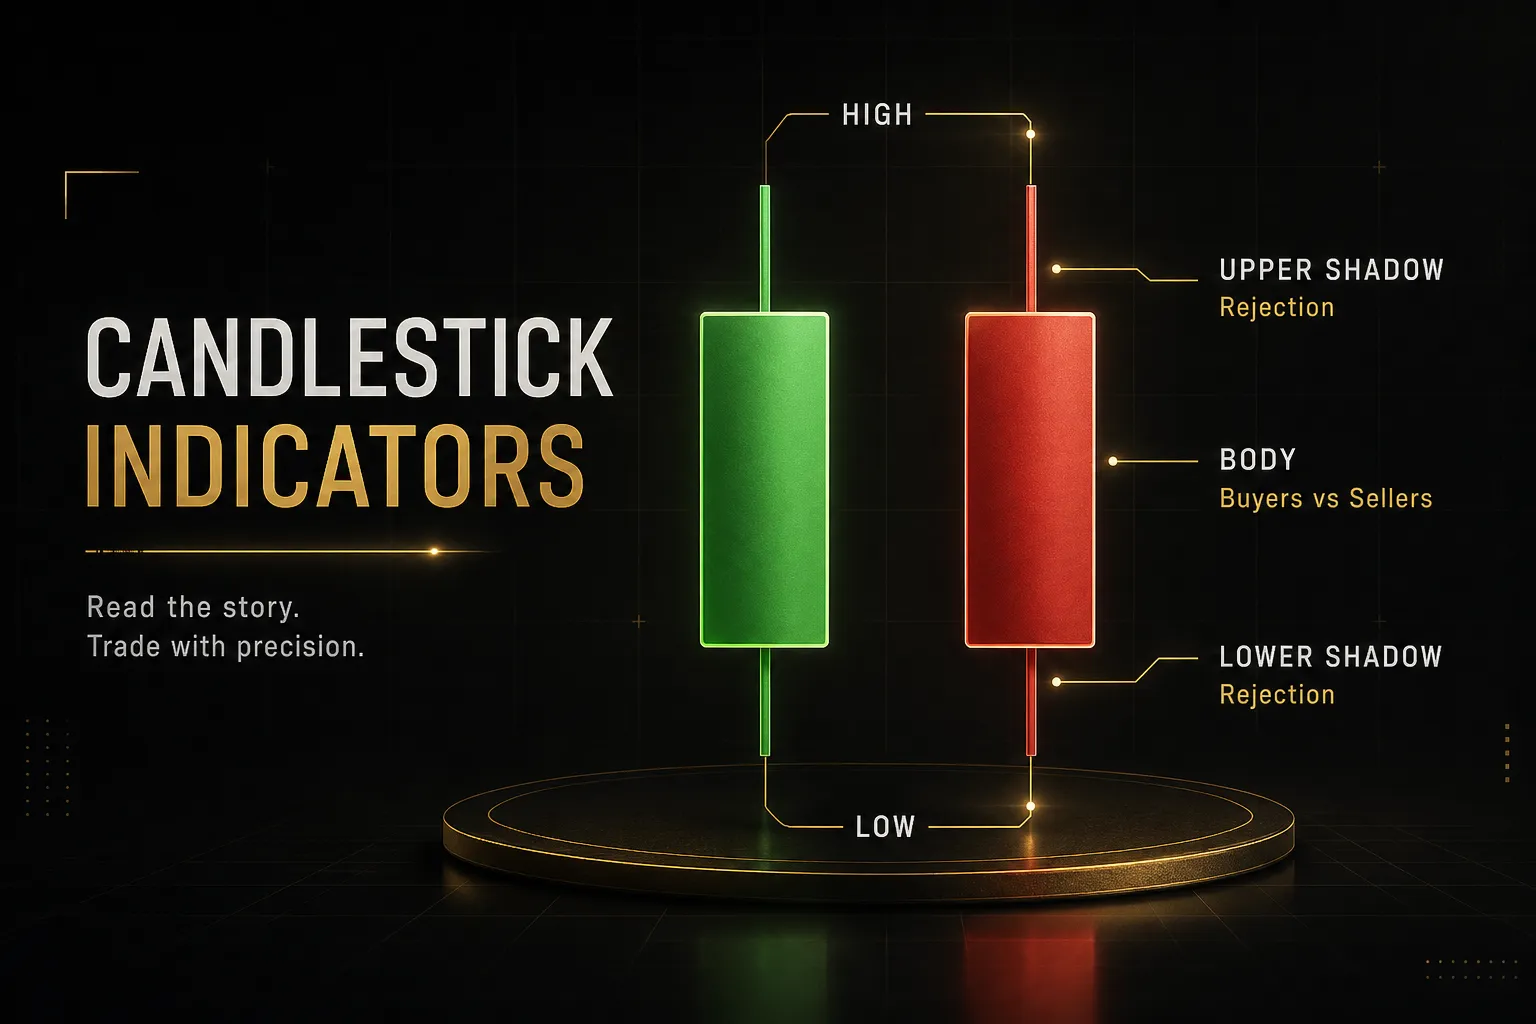
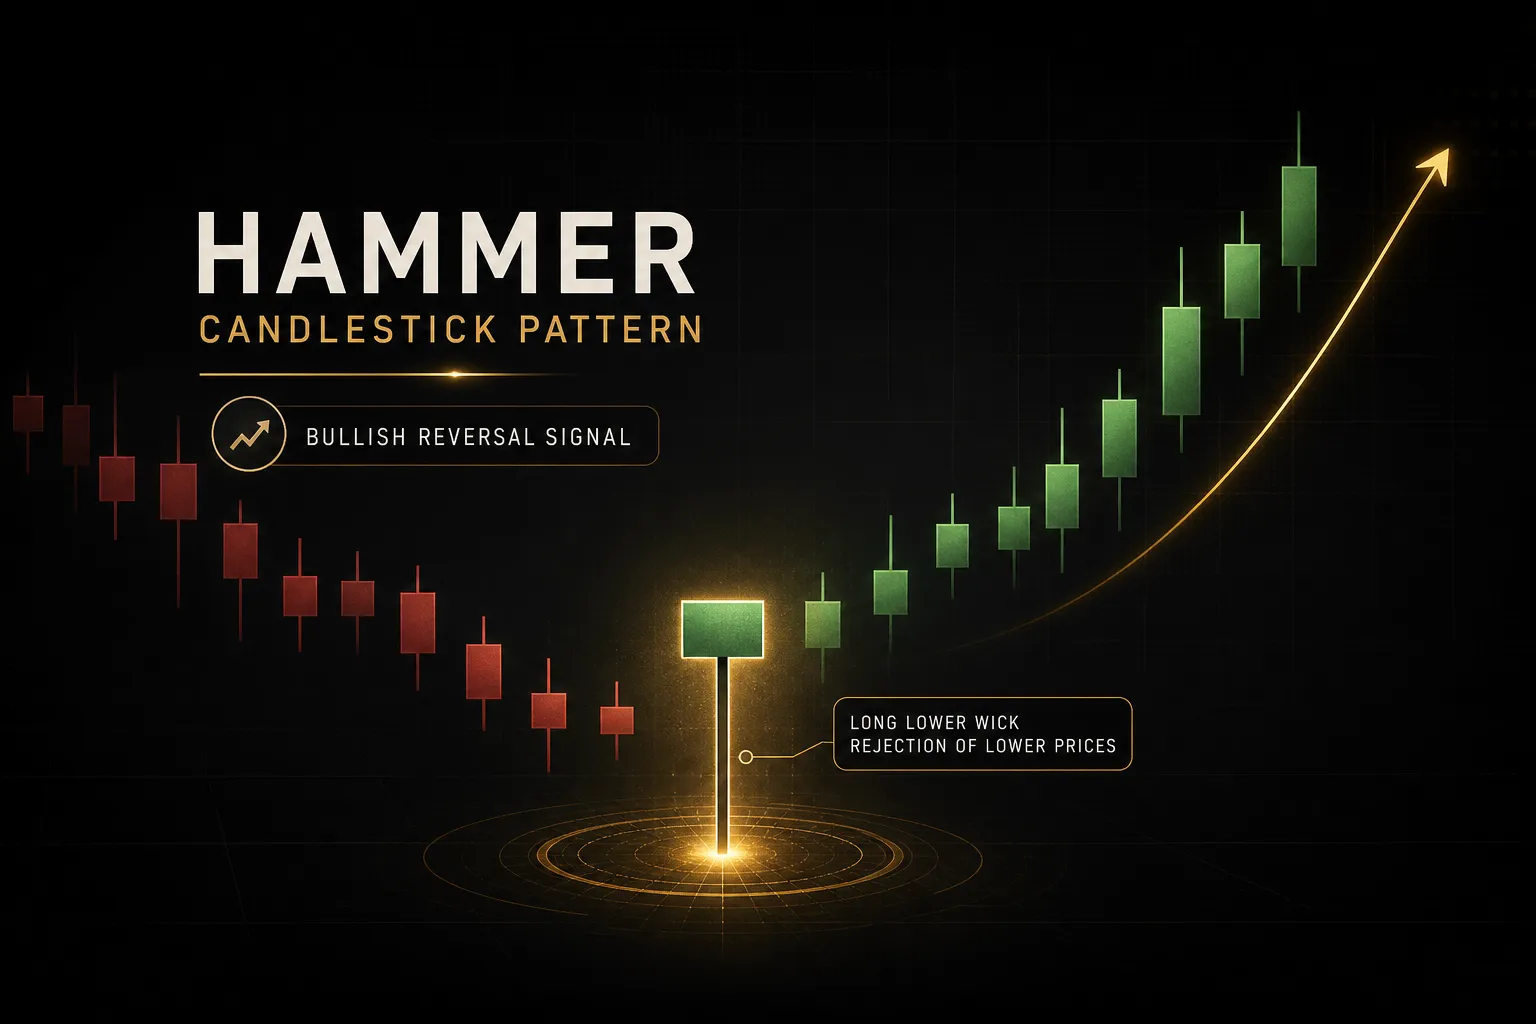
A hammer is a single-candle formation with three defining features: a small real body positioned near the top of the candle’s range, a long lower shadow, and little to no upper shadow.
The most quoted guideline is that the lower shadow should be at least twice the length of the real body.
Some texts say three times. Others require the upper shadow to be under 10% of the total range.
Treat these as rough filters, not laws.
Exact ratios vary by source because they are heuristics, not physics.
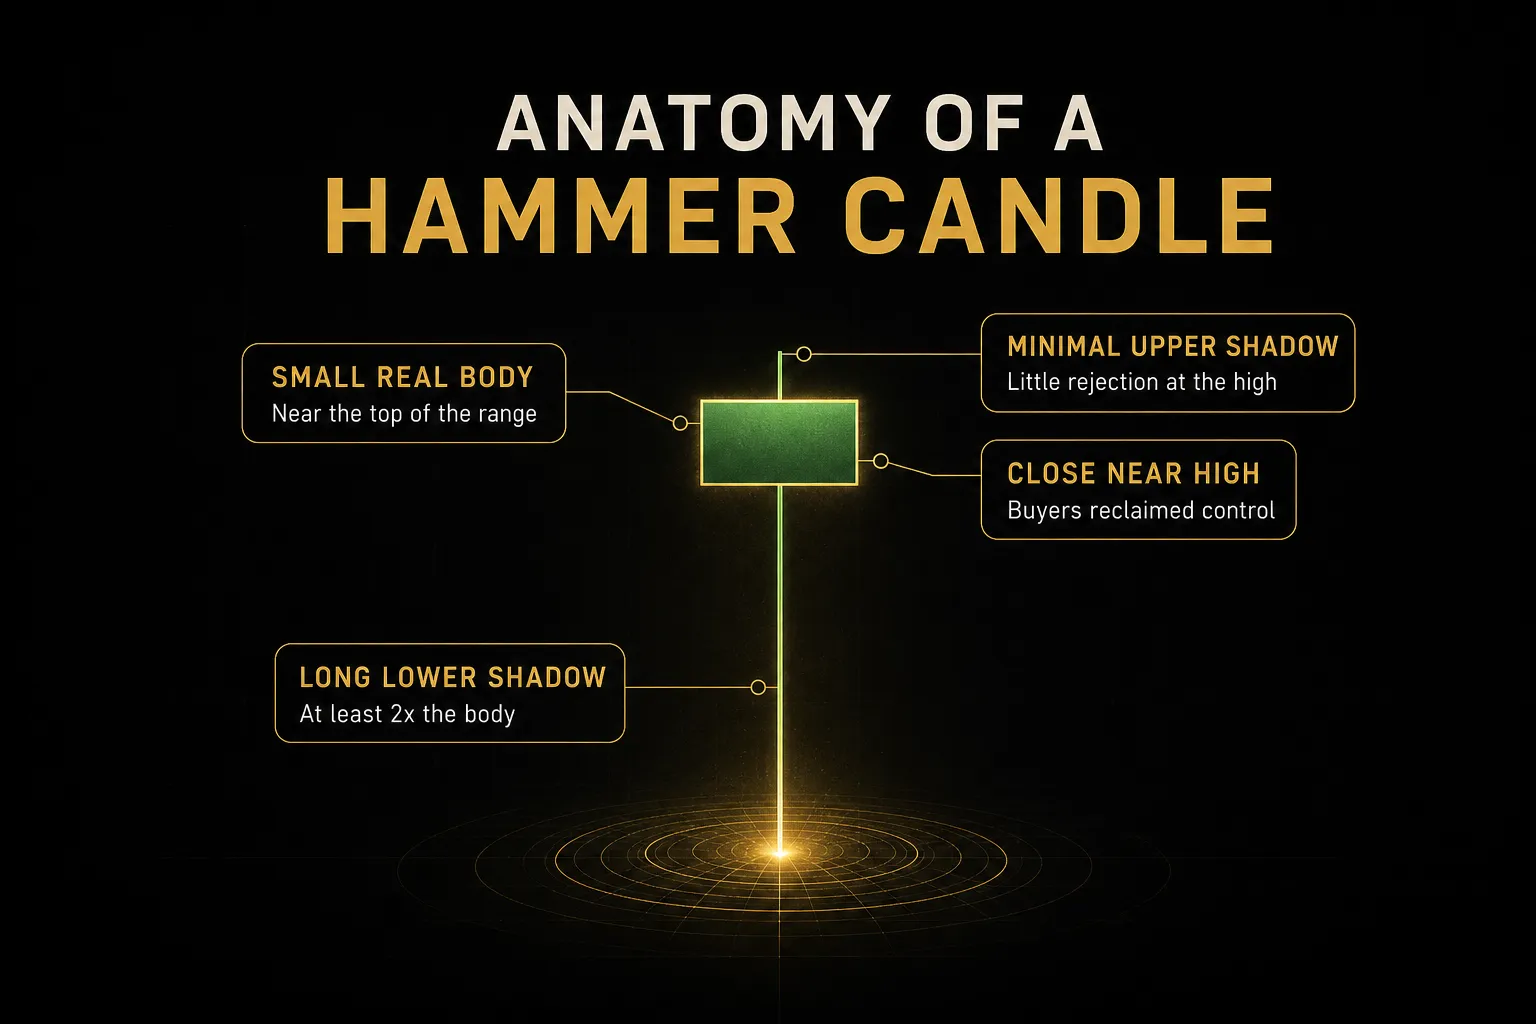
What matters just as much as the ratio: where the candle closes within its range, how large the candle is relative to recent bars, and the volatility of the instrument.
A hammer that closes in the top 20% of its range after a wide-range, high-volume session is telling you something.
A hammer that closes in the top 20% of a range that spans 0.3% of the asset’s price during a dead session is telling you almost nothing.
Candle color is secondary.
A green hammer (close above open) shows slightly stronger buying pressure than a red one, and some traders prefer it. But both are valid, because the meaningful information is the rejection of the lows, not the difference between the open and close inside an already-small body.
Why Context Comes Before the Candle
The exact same shape carries three completely different meanings depending on where it appears.
That’s the part most guides gloss over.
For a hammer to function as a bullish reversal clue, it must appear after a meaningful decline. That means a defined downtrend of several sessions, a sharp impulsive drop, or price arriving at a clear support or demand zone where buyers have previously defended.
No prior decline, no reversal.
There is nothing to reverse.
The same candle appearing mid-range during a sideways drift is noise. Price wicked down, price came back, nobody learned anything.
And the same shape after a sustained rally isn’t a hammer at all. It’s a hanging man, which carries bearish implications.
This is why support and resistance and market structure come first in any real analysis. Identify the trend, mark the levels, then look for the candle.
Reversing that order turns pattern recognition into pattern hallucination, where you find hammers everywhere because you’re looking for them.
A practical filter: does the hammer’s low touch or undercut a prior swing low, a horizontal support level, or a rising moving average that has held before?
If yes, the candle has a reason to exist. If it’s floating in empty space, be skeptical.
Confirming and Trading a Hammer Setup
You’ve found a textbook hammer at support after a six-day slide.
Now what?
This is where most traders either freeze or fire too early.
Objective Confirmation Signals
- Wait for a close above the hammer’s high. This is the primary confirmation. It proves buyers were willing to pay above the rejection candle’s extreme, which is a genuine shift in short-term supply and demand rather than a single intrabar spike.
- Look for a break of nearby swing structure. If the confirmation candle also takes out the most recent lower high, you’re no longer trading a candle. You’re trading a change in market structure, which is a materially stronger setup.
- Check momentum is turning. RSI curling up from below 30, or a visible RSI divergence where price made a lower low but RSI made a higher low, adds independent evidence that selling pressure is fading.
- Demand volume confirmation on the follow-through. The confirmation candle should ideally trade on above-average volume. A breakout above the hammer’s high on thin volume is easy to fade and frequently does exactly that.
- Apply a moving average trend filter. Hammers that fire while price is below a falling 200-period moving average are counter-trend trades. They can work, but they deserve smaller size and tighter management than hammers that appear as pullbacks within an established uptrend.
Notice what’s missing from that list: gut feel, “it looks strong,” and the hammer itself.
Confirmation is a separate event from identification.
Entry, Stop-Loss, and Target Placement
The entry logic follows directly from the thesis.
You do not buy the hammer.
You buy the confirmation.
- Enter on the close of the confirmation candle. Or on a stop order placed a few ticks above the hammer’s high, which fills you earlier but risks being triggered by an intrabar poke that fails. Both are defensible; the close-based entry is more conservative and produces fewer false starts.
- Place the initial stop just below the hammer’s low. That low is the point where the bullish argument breaks. If price trades through it, the buyers who defended the level are gone. This gives the tightest risk and the cleanest invalidation.
- Use an ATR-based stop in choppy conditions. In volatile or noisy markets, a stop one to 1.5 times the Average True Range below the hammer low keeps you out of routine whipsaw. Wider stop, smaller position, same total risk.
- Derive position size from the stop distance. Divide your maximum dollar risk (typically 0.5% to 1% of account equity) by the per-unit distance between entry and stop. If you risk $500 and your stop sits $2.50 below entry, you buy 200 shares. Never the other way around.
- Set the first target at the nearest resistance or supply zone. The prior swing high, an unfilled gap, or a descending trendline are all reasonable. If that target sits less than 1.5 times your risk away, the trade probably isn’t worth taking.
- Consider a measured-move projection for the second target. Take the height of the hammer’s full range, or the depth of the preceding decline, and project it upward from the breakout point. Useful when there’s no obvious resistance overhead.
- Define your minimum risk-to-reward ratio before entry. A 2:1 risk-to-reward ratio means you can be right 40% of the time and still make money. Setups that don’t clear your threshold get skipped, no matter how pretty the candle looks.
Timeframe Changes the Meaning
A hammer on a daily chart represents an entire session of supply and demand resolving in favour of buyers. Institutional order flow, overnight positioning, and a full day’s participation all feed into it.
The identical shape on a five-minute chart? Often just one large order filling, or a liquidity sweep before an algorithm reverses.
Same geometry, radically different information content.
This is why multi-timeframe analysis isn’t optional.
Before acting on a lower-timeframe hammer, check whether the higher timeframes agree. A four-hour hammer that appears while the daily and weekly are both trending down is a countertrend bounce, not a reversal.
Tools like PipTrend’s 12-timeframe confirmation table make this check mechanical rather than subjective. You see at a glance whether the one-hour, four-hour, daily, and weekly readings align, so a promising lower-timeframe candle can be cross-checked against the dominant trend before you commit capital.
The general rule: the higher the timeframe, the fewer the signals and the higher the quality. Day traders working 1- to 15-minute charts need substantially more filtering than swing traders working dailies.
Hammer vs Its Look-Alikes
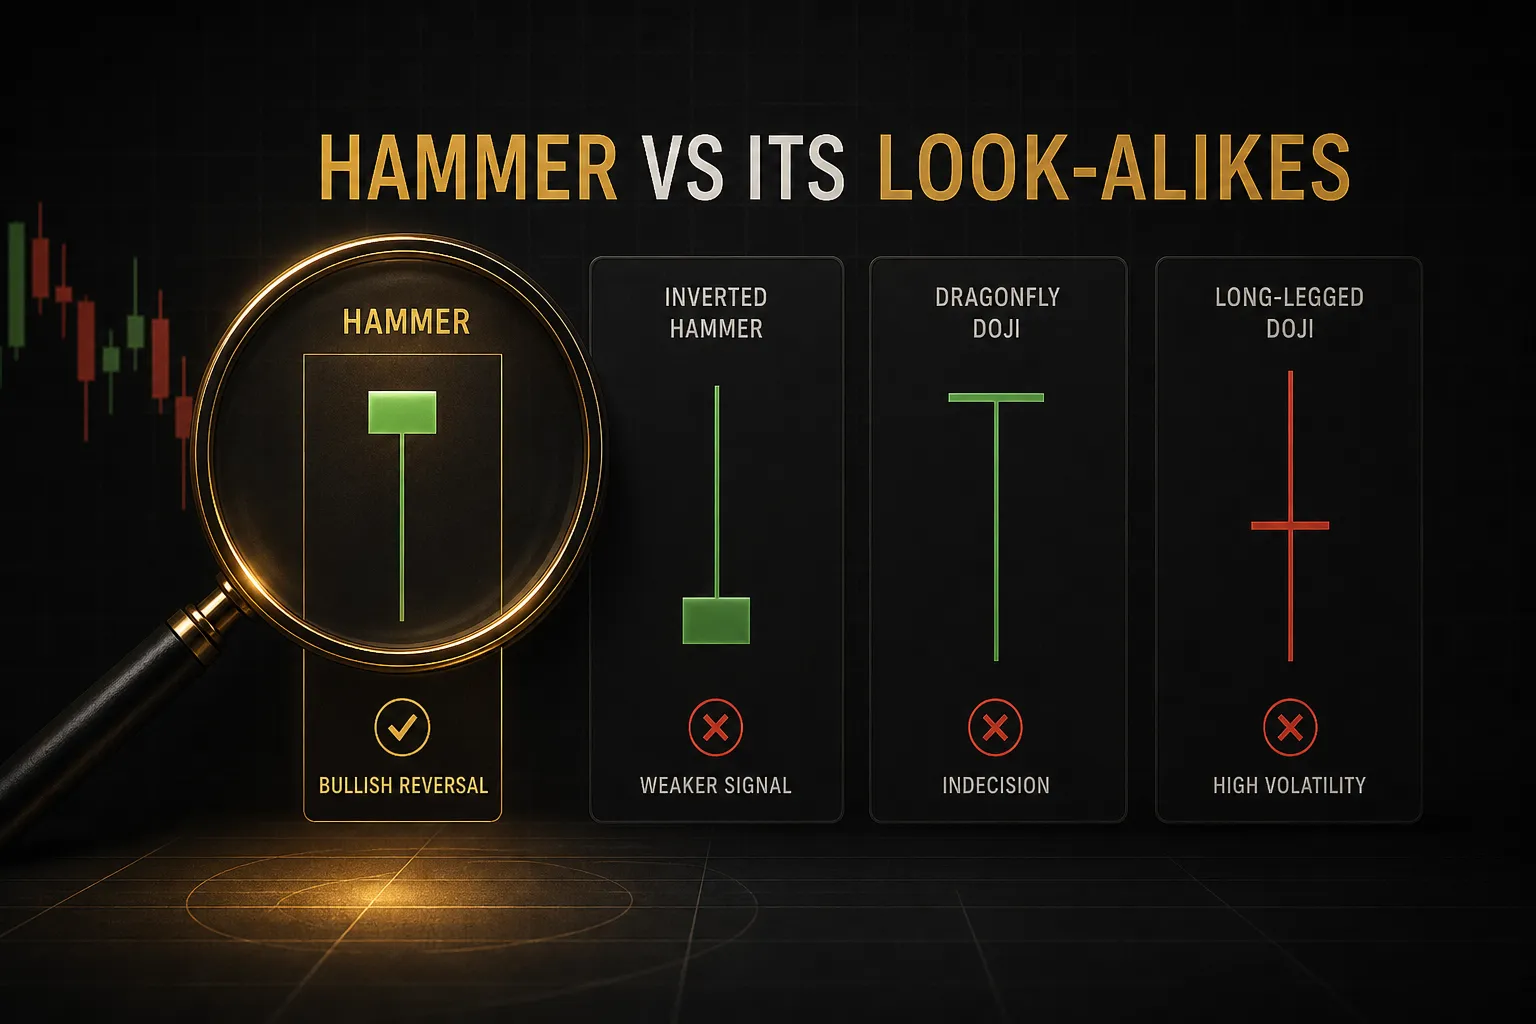
Here’s the part that genuinely confuses people.
Several candlestick patterns share nearly identical geometry, and the name changes based purely on trend context, not on the candle itself.
A hammer and a hanging man can be pixel-for-pixel identical. One appears after a decline and suggests buyers are stepping in. The other appears after a rally and suggests sellers are testing the waters.
Only the surrounding price action tells you which you’re looking at.
| Pattern | Required Trend Context | Wick Location | Body Size & Position | What It Implies |
|---|---|---|---|---|
| Hammer | After a downtrend or at support | Long lower shadow (2x+ body), minimal upper | Small body at top of range | Sellers drove price down; buyers rejected the lows. Potential bullish reversal. |
| Hanging Man | After an uptrend or at resistance | Long lower shadow (2x+ body), minimal upper | Small body at top of range | Sellers appeared mid-session for the first time. Warning of bearish reversal. |
| Inverted Hammer | After a downtrend | Long upper shadow (2x+ body), minimal lower | Small body at bottom of range | Buyers attempted a rally and were pushed back, but bulls showed up. Tentative bullish signal. |
| Shooting Star | After an uptrend | Long upper shadow (2x+ body), minimal lower | Small body at bottom of range | Buyers pushed higher and were firmly rejected. Bearish reversal warning. |
| Dragonfly Doji | After a downtrend or at support | Long lower shadow, essentially no upper | Open and close nearly identical, at the high | Total rejection of lows with perfect indecision in the body. Stronger rejection than a hammer, but needs confirmation. |
The hammer versus inverted hammer distinction deserves a closer look, because both are bullish and both appear after declines.
A hammer shows rejection of the lows. Price fell, buyers absorbed the supply, price closed near the high.
The buying happened at the bottom.
An inverted hammer shows a failed rally attempt. Price opened, buyers pushed it up sharply, sellers knocked it back down to near the open.
On its face that sounds bearish, and it partly is.
But after a sustained decline, the mere fact that buyers had enough conviction to mount a rally at all signals a change in behaviour.
Practically speaking, the inverted hammer is the weaker of the two and needs stronger confirmation. Many traders require the following candle to gap up or close above the inverted hammer’s high before treating it as anything at all.
How Reliable Is the Hammer Pattern?
Ask ten sources for the hammer’s win rate and you’ll get ten different numbers, ranging from around 55% to over 70%.
That spread should tell you something.
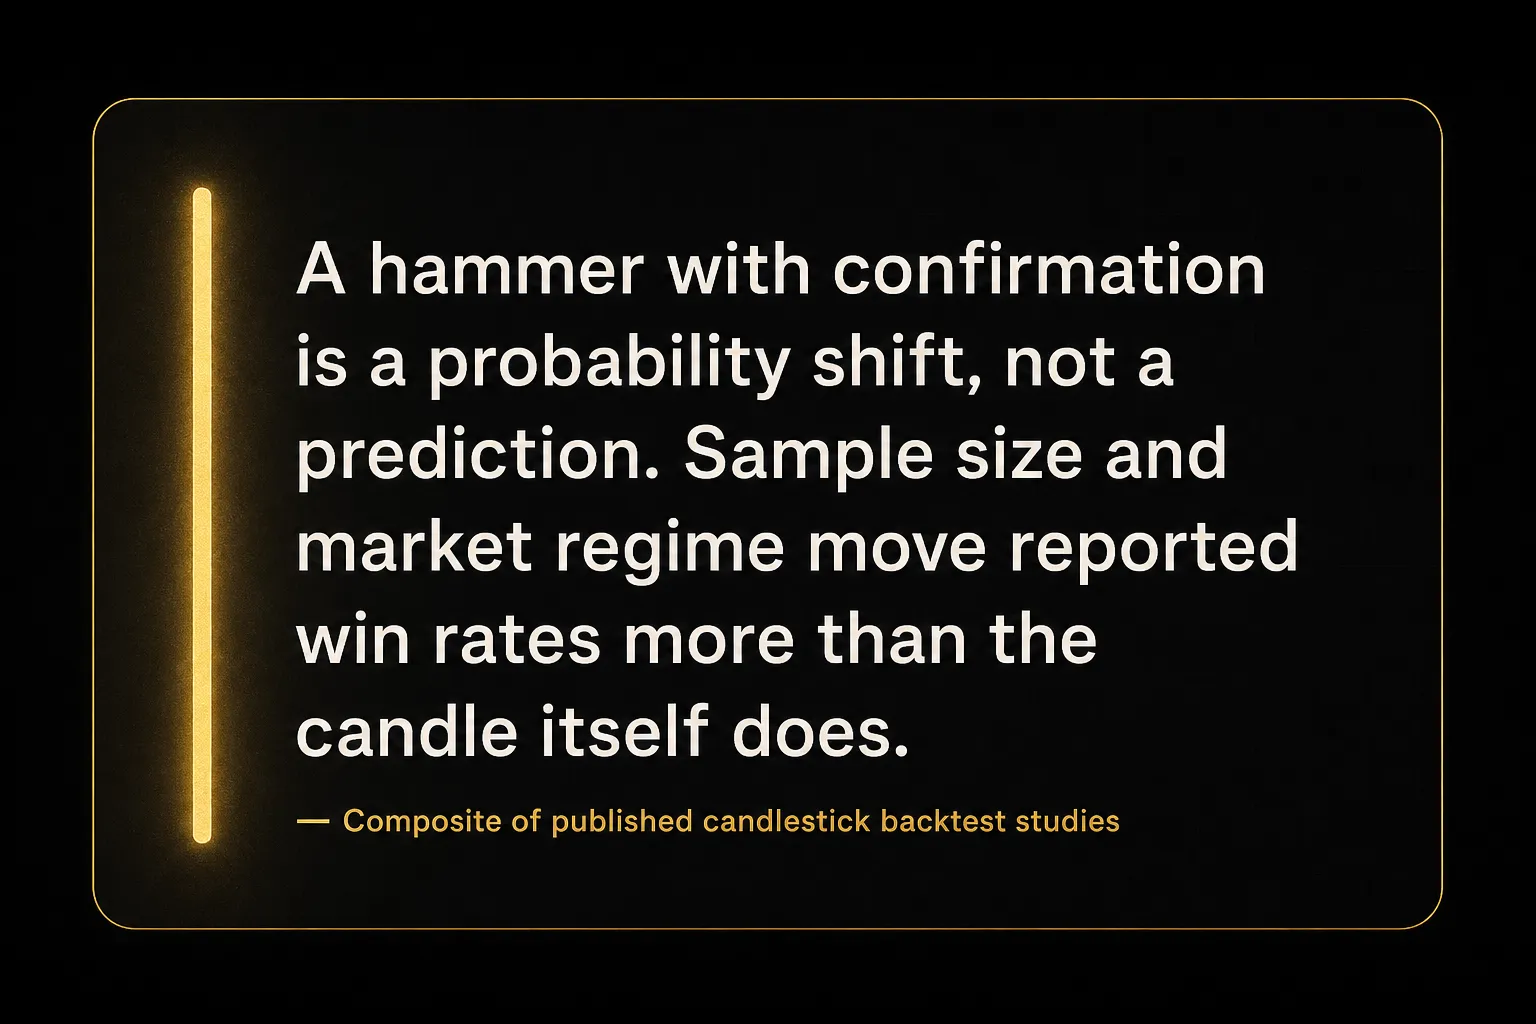
Those figures depend entirely on the definition used, the instrument tested, the timeframe, the market regime during the test period, and whether confirmation rules were applied. Change any one variable and the number moves.
What the research broadly agrees on: hammers show a modest but real directional edge, particularly on daily charts, particularly when they occur at established support, and particularly when paired with confirmation. That edge shrinks substantially in ranging markets and on low timeframes.
Modest edge is still edge.
A pattern that wins 55% of the time with a 2:1 risk-to-reward ratio is a profitable system. The problem is that traders hear “reliable pattern” and size up as if it were 90%.
False Positives and Failed Hammers
A hammer fails when price closes below its low.
Simple as that.
But here’s the nuance most guides miss: a failed hammer is not a neutral event.
It’s often actively bearish.
The market just demonstrated that a visible group of buyers stepped in at that level, and then those buyers got overwhelmed.
Trapped longs above create supply.
Their stops sit below the hammer low, which is precisely where price just went. That cascade of forced selling frequently accelerates the downtrend rather than merely pausing it.
This is why some traders flip the setup entirely, treating a decisive break below a hammer low at support as a short entry.
The failed reversal becomes a continuation signal.
The most common causes of false positives are predictable.
Hammers in the middle of a range with no level nearby. Hammers on low volume where the wick reflects a liquidity gap rather than genuine buying. Hammers during a strong, high-momentum downtrend where a single bounce candle means nothing against the weight of the move.
Rather than trusting generic win-rate claims, backtest the pattern on the exact instrument and timeframe you actually trade. Define your criteria precisely, run 100+ occurrences, and record the outcomes.
Your own data beats someone else’s blog post every time.
Forex, Crypto, and Day Trading Considerations
Candlestick analysis was developed in 18th-century Japanese rice markets. Nobody was trading EUR/USD at 3am or a memecoin on a Sunday.
Some assumptions don’t transfer cleanly.
Forex introduces several distortions.
Session liquidity varies dramatically, and a hammer forming during the thin Asian session on a European pair often reflects nothing more than a lack of participants. Spread costs matter too: on a pair with a 1.5-pip spread, a hammer with a 6-pip wick has a meaningful chunk of its “rejection” explained by the bid-ask gap alone.
News-driven volatility spikes create textbook hammers that are pure event noise. A central bank comment spikes price down and it snaps back within minutes.
That’s a shape, not a signal.
Traditional price gaps also have limited relevance in forex, since the market runs 24 hours, five days a week. Gap-based candlestick confirmations that work in equities mostly don’t apply.
Crypto goes further.
Trading never stops, so there are no clean session opens or closes, and the “daily candle” boundary is an arbitrary UTC convention rather than a real market event. Volume is fragmented across exchanges, which makes volume confirmation less trustworthy unless you’re using aggregated data.
Crypto’s volatility also means wicks are routine. A 3% lower shadow on Bitcoin is a normal Tuesday, not a dramatic rejection.
Scale your expectations to the instrument’s typical range.
For day traders on 1- to 5-minute charts, hammers are abundant and mostly meaningless. High-frequency activity, stop hunts, and single large orders generate the shape constantly.
On those timeframes, the pattern only becomes useful when paired with something objective: a volume surge, a momentum shift, a confluence level from a higher timeframe.
Combining the hammer with independent tools is the practical fix across all three markets. Support and resistance, a moving average trend filter, RSI, volume profile, and market structure each provide evidence the candle alone can’t.
Rule-based systems such as PipTrend’s signal engine and fakeout filter automate part of that cross-checking, flagging when a reversal candle contradicts the dominant multi-timeframe trend.
No tool guarantees accuracy.
Filters improve the ratio of good setups to bad ones; they don’t eliminate losses. Anyone claiming otherwise is selling something.
Hammer Candlestick FAQs
What does a hammer candlestick indicate?
A hammer indicates that selling pressure was overwhelmed by buying pressure within a single session, producing a long lower shadow and a close near the high. After a genuine downtrend or at a tested support level, that suggests sellers may be exhausting.
It signals potential seller exhaustion, not a confirmed change in trend. Without follow-through from the next candle, it remains a hypothesis.
Is a hammer candle a buy signal?
No.
A hammer is a warning that conditions may be shifting, and it becomes actionable only after confirmation.
The standard confirmation is a close above the hammer’s high, ideally with above-average volume and a supportive higher-timeframe trend. Buying the hammer’s close itself means entering before the market has agreed with your thesis.
How do you trade a hammer candlestick pattern?
Wait for a confirmation candle to close above the hammer’s high, then enter with a stop just below the hammer’s low. Size the position by dividing your maximum risk in dollars by the entry-to-stop distance.
Target the nearest resistance or supply zone, or use a measured-move projection. Skip the trade entirely if the resulting risk-to-reward ratio falls below roughly 2:1.
What is the success rate of a hammer candlestick?
Published estimates typically land in the 55% to 70% range, but those numbers vary enormously by instrument, timeframe, and whether confirmation rules were applied. Treat any single quoted figure with suspicion.
The pattern shows a real but modest directional edge in daily-chart backtests. Backtest it on your own instrument and timeframe with at least 100 occurrences before trusting any number.
What is the difference between a hammer and an inverted hammer?
A hammer has a long lower shadow showing that sellers drove price down and buyers rejected the lows. An inverted hammer has a long upper shadow showing that buyers attempted a rally and got pushed back down.
Both appear after declines and both lean bullish, but the inverted hammer is the weaker signal because the session’s buying attempt actually failed. It demands stronger confirmation before acting.
What happens after a hammer candlestick pattern?
Three outcomes are possible: price confirms upward and a bullish reversal develops, price stalls sideways as the market digests, or price breaks below the hammer’s low and the downtrend resumes.
That third outcome is not neutral.
A break below the low traps the buyers who defended the level, and the resulting stop cascade often accelerates the decline.
The Bottom Line on Trading Hammers
The decision framework fits in two sentences.
If a hammer appears after a genuine decline, at a level that matters, and the next candle closes above its high on decent volume, it’s a tradable setup with clearly defined risk. If it appears mid-range, without a prior downtrend, or without confirmation, skip it.
That’s the whole filter.
Most of the discipline in candlestick trading lies in what you refuse to trade.
The hammer earned its place in technical analysis because it compresses a real market event into one visual: sellers pushed, buyers pushed back harder, and the close proved it.
That’s genuine information about supply and demand at a specific price.
But information isn’t a decision.
The candle tells you where a fight happened; it doesn’t tell you who wins the war.
Treat every hammer as a question the market is asking, not an answer it’s giving. Confirmation and position sizing supply the answer.
Traders who internalise that distinction stop chasing wicks and start waiting for evidence.
Fewer trades, better ones.
And when a hammer does fail, and some will, the stop below its low means you find out cheaply.
Risk Disclaimer: Trading involves risk. Past performance doesn't guarantee future results. Only trade with money you can afford to lose. PipTrend is a tool to assist your trading decisions, not financial advice.