
Most traders drown in indicators. You add one for trend, another for momentum, then a third for confirmation. Your chart turns into a Christmas tree and you still freeze when price hits your alert. The best trading view indicator isn't the one with the most features or the flashiest colors. It's the one that removes confusion and shows you exactly where market structure is heading before you risk a single pip.
What Actually Makes an Indicator Effective
You need clarity, not complexity. An effective indicator gives you three things: immediate trend identification, signal filtering that eliminates false breakouts, and multi-timeframe alignment that keeps you on the right side of momentum. Everything else is decoration.
Trend identification should take one glance. If you're squinting at histogram bars or counting candles above a moving average, you're already behind institutional traders who spotted the shift three bars ago. The best systems color code your chart environment so bullish conditions look different from bearish consolidation. You trade what you see, not what you calculate.
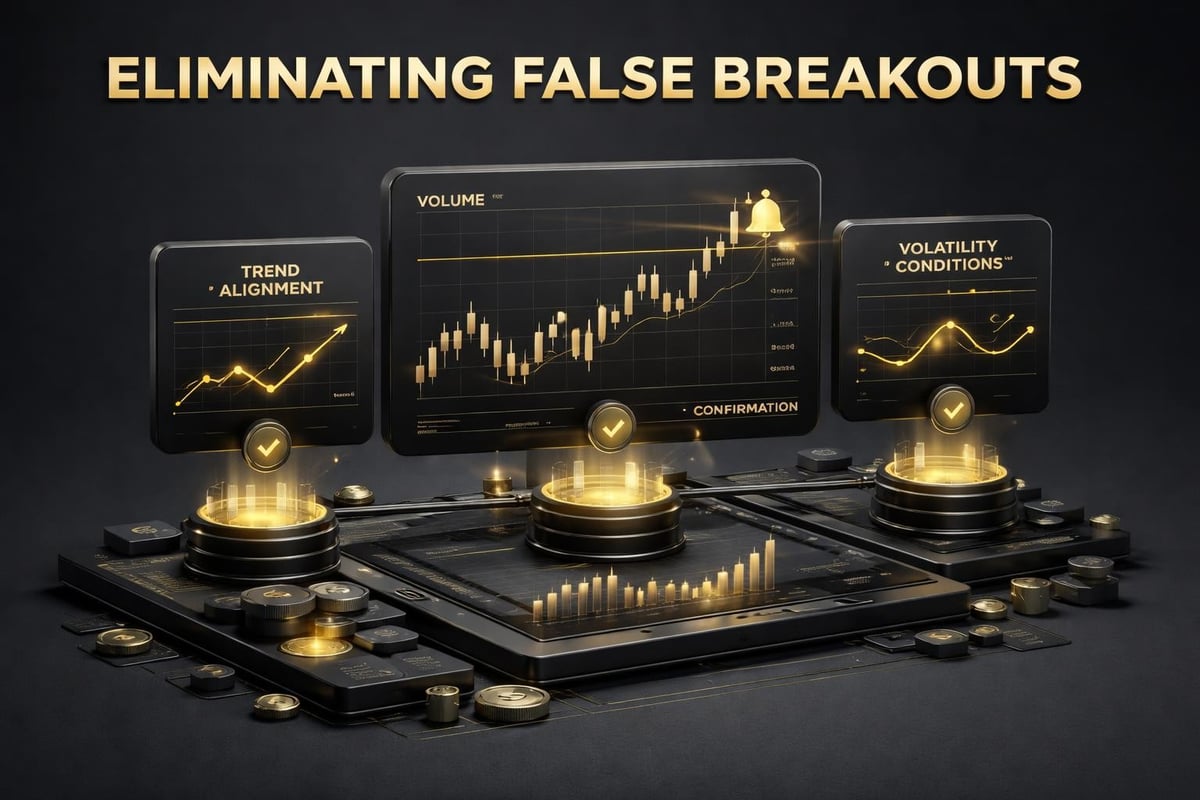
Signal filtering separates professionals from gamblers. Random indicators fire buy alerts during distribution phases and sell signals right before markup continuation. Quality tools include built-in filters that check volume confirmation, volatility conditions, and price structure before generating alerts. A good filter reduces your signals by 70% and improves your win rate by 40%.
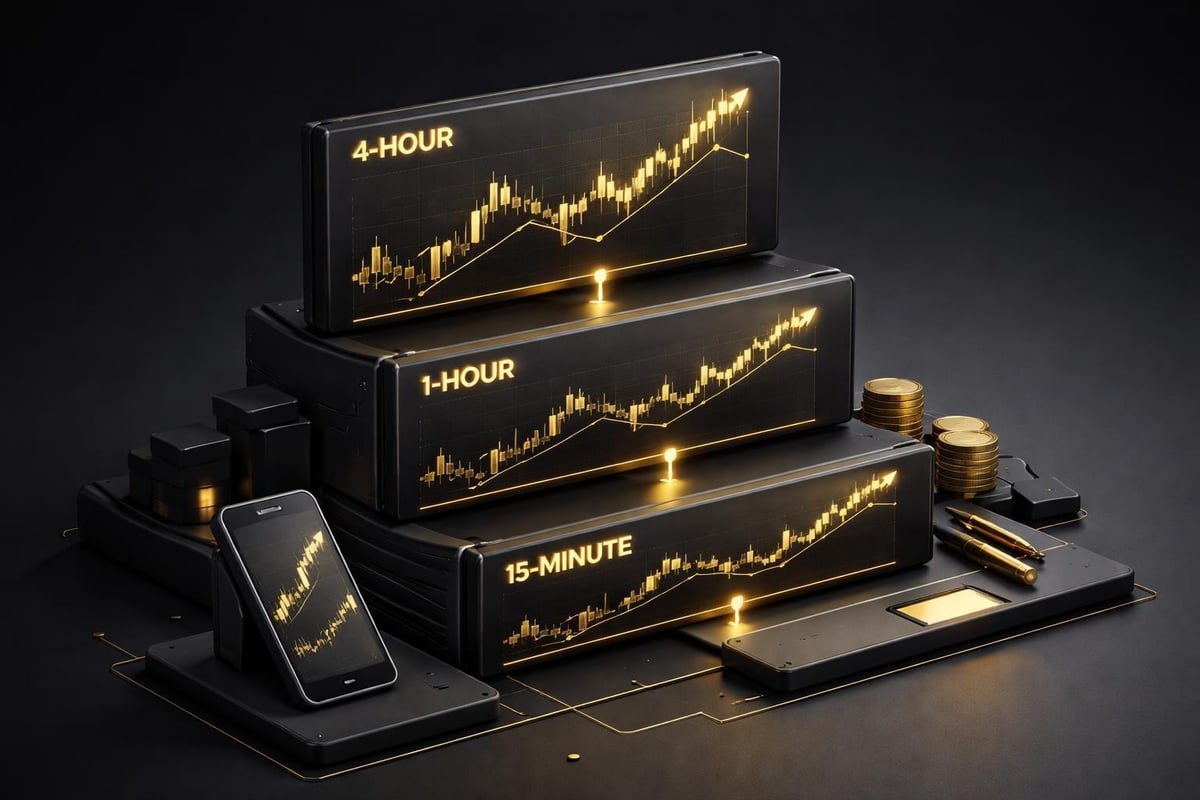
Multi-timeframe confirmation matters more than any single signal. Professional traders check at least three timeframes before entry. Your 15-minute chart might scream buy, but if the 4-hour is rejecting resistance and the daily is in a downtrend, you're catching a falling knife. The best trading view indicator displays this context automatically without forcing you to flip between chart tabs.
Core Indicator Categories That Drive Decisions
Trend indicators show direction but lag price. Moving averages, whether simple or exponential, tell you where price has been. The 200-period MA on the daily chart defines long-term bias. The 20-period EMA on the 1-hour shows short-term momentum. When price trades above both, you hunt long setups. When it's below, you only short rallies. This isn't prediction, it's position.
Oscillators catch extremes and divergences. RSI between 30 and 70 tells you nothing useful. RSI above 70 on a pullback in an uptrend sets up continuation entries. RSI divergence where price makes new highs but RSI doesn't signals distribution before reversals. The Stochastic Oscillator works similarly, showing overbought and oversold levels that matter most when aligned with higher timeframe structure.
Volume indicators confirm conviction. A breakout with declining volume is a trap. A breakout with expanding volume that exceeds the 20-period average volume shows institutional participation. Volume Profile reveals price levels where the most trading occurred, creating support and resistance zones that actually hold because they represent real accumulation or distribution.
Volatility indicators time your entries. Average True Range tells you how much a pair typically moves in a session. If EUR/USD averages 70 pips daily and it's already moved 65 pips, your risk-reward on new trades deteriorates. Bollinger Bands show expansion and contraction cycles. Price squeezing inside narrow bands precedes explosive moves. You position before the break, not after.
How to Layer Indicators Without Creating Noise
Start with trend, add confirmation, ignore everything else. Your base layer establishes directional bias using moving averages or trend channels. The 50-period and 200-period moving averages on your primary timeframe create your framework. Price above both with the 50 above the 200 means you're hunting longs exclusively.
Your second layer adds momentum confirmation. An oscillator like RSI or MACD verifies that the trend has energy. When price pulls back to the 20-period EMA in an uptrend and RSI bounces from 40, you have structure and momentum aligned. That's your entry zone, not random price levels.
Your third layer filters with volume or volatility. Before you enter, check that volume supports the setup and that ATR shows the pair has room to run. If you're targeting 30 pips but ATR shows the pair only averages 25 pips in your session, your trade plan defies probability.
Never add a fourth layer. Three complementary indicators provide complete coverage. Trend shows direction, oscillators show timing, volume or volatility validates conviction. More indicators create conflicting signals that paralyze execution. You'll find one saying buy while another screams sell, and you'll miss the trade entirely.
The Multi-Timeframe Approach That Pros Use
Your trading timeframe is where you manage entries and exits. If you scalp, that's the 5-minute or 15-minute chart. If you swing trade, it's the 4-hour or daily. This chart shows you precise entry triggers and stop placement levels. But this timeframe alone misleads you because it lacks context.
Your higher timeframe provides directional bias. Check one level up minimum. If you trade the 15-minute, analyze the 1-hour. If you trade the 4-hour, study the daily. The higher timeframe's trend is your permission slip. Only take long setups on the 15-minute when the 1-hour is bullish. Only short the 4-hour when the daily shows distribution.
Your confirmation timeframe validates momentum. Go one more level up for final verification. A 15-minute long entry looks stronger when both the 1-hour and 4-hour charts show uptrends. A 4-hour setup gains conviction when the daily and weekly charts align. This three-timeframe system keeps you trading with institutional money instead of against it.
Check all three before entry, not after. Traders lose because they spot a 15-minute signal, take the trade, then check higher timeframes and realize they're fighting the daily downtrend. The best trading view indicator systems build this timeframe analysis into a single dashboard so you see all contexts simultaneously.
Specific Indicator Combinations That Work
The moving average crossover with RSI filter reduces false signals dramatically. Use the 20-period and 50-period EMAs on your trading timeframe. When the 20 crosses above the 50, you have a trend change signal. But don't enter yet. Wait for price to pull back and RSI to drop between 40 and 50, then bounce. That pullback entry in the new trend direction offers better risk-reward than chasing the initial crossover.
The Bollinger Band squeeze with volume breakout catches explosive moves. When Bollinger Bands contract to their narrowest range in 20 periods, volatility is coiling. Price is about to expand hard. You don't know direction yet. Wait for a candle close outside the bands with volume 50% above average. That's your directional confirmation. Enter in the breakout direction with stops below the opposite band.
The trend line break with MACD confirmation validates reversals. Draw your trend line connecting swing lows in an uptrend or swing highs in a downtrend. When price breaks the trend line, you have structural damage. But many breaks are false. Wait for MACD to cross its signal line in the direction of the break. That momentum confirmation separates real reversals from temporary violations.
Common Mistakes That Kill Indicator Effectiveness
Using default settings on every market wastes edge. The 14-period RSI works differently on EUR/USD than on Bitcoin. Forex pairs with tight ranges need shorter RSI periods like 9 or 11 to catch meaningful extremes. Volatile crypto assets need longer periods like 21 to avoid constant overbought and oversold noise. Test your indicator settings on your specific pairs over the last 100 trades.
Ignoring the session and liquidity context destroys even good signals. A buy signal at 2 AM EST when liquidity is dead and spreads are wide sets you up for slippage and whipsaw. The same signal at 8 AM EST when London is active and volume is surging has institutional participation behind it. Understanding session timing transforms indicator performance.
Chasing signals instead of waiting for confluence costs you money. One indicator firing is not a trade. One indicator is a possibility. Two indicators confirming is interesting. Three indicators plus timeframe alignment is a trade. Patience separates profitable traders from those who donate to the market.
Why Repainting Indicators Ruin Your Backtest
Repainting indicators redraw past signals after the fact. You backtest them and see 90% win rates. You trade them live and lose consistently. The indicator showed a buy signal five candles ago during backtesting, but live it only showed that signal after price already moved. You never had the chance to take the trade it claims existed.
Quality indicators lock their signals the moment they trigger. When a buy alert fires, that alert remains on that specific candle forever. You can verify past performance accurately because past signals stayed where they appeared, not where they look best in hindsight. This honesty lets you build real confidence in your system.
Test for repainting by scrolling your chart back 50 candles, marking where signals appear, then refreshing your browser and checking if those same signals still exist at those same locations. If they moved or disappeared, you're using a repainting tool that lies about its historical performance. Unlike tools that repaint their signals to manufacture perfect hindsight results, reliable systems maintain signal integrity across all timeframes.
How to Validate an Indicator Before Trading Real Money
Demo test for minimum 50 trades. Paper trading reveals whether you understand the indicator's logic and whether the signals align with actual price movement. Track every signal, not just the ones you take. If the indicator fires 100 signals and you only feel confident taking 20, that's valuable information about either the indicator's quality or your understanding of its context.
Measure three metrics: win rate, average risk-reward, and maximum consecutive losses. You need a win rate above 50% if your risk-reward is 1:1. You can survive with 40% win rate if your average winner is twice your average loser. Your maximum consecutive losses reveal psychological durability. Can you handle five losses in a row before you abandon the system?
Forward test in live market conditions but with small size. Real spreads, real slippage, and real emotional pressure change everything. Risk $0.10 per pip for 30 days. You're not trying to make money yet. You're verifying that demo results translate to live execution and that you can follow the signals without second-guessing every entry.
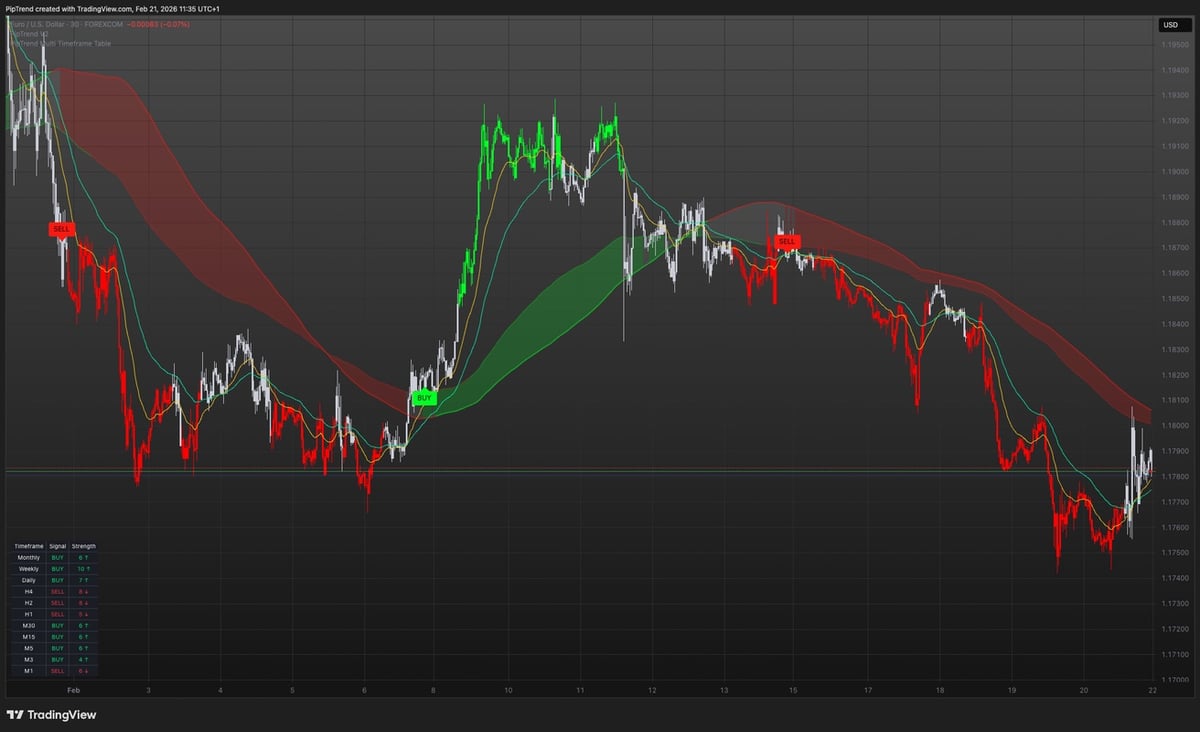
When you find an indicator that provides instant trend clarity, filters out low-probability noise, and aligns multiple timeframes into one coherent view, you've found your edge. The PipTrend AI Trading Indicator combines these elements with automatic trend detection and real-time alerts, giving traders the confidence to execute without constant chart monitoring. This approach eliminates the confusion that comes from juggling multiple conflicting tools.
Building Your Personal Indicator System
Define your trading style first. Scalpers need fast oscillators and tick volume. Swing traders need daily trends and weekly support levels. Position traders need monthly charts and fundamental alignment. Your indicator choices flow from your time commitment and risk tolerance, not from what YouTube traders promote.
Choose one trend indicator as your foundation. Pick moving averages, trend channels, or a proprietary trend system. This indicator dictates every other decision. It tells you whether you're allowed to look for long setups, short setups, or if you should stay flat. Master this single tool before adding anything else.
Add one momentum indicator for timing. RSI, MACD, or Stochastic gives you overbought and oversold context within the trend. When your trend indicator says long and your momentum indicator shows oversold on a pullback, you have alignment. When both agree, you trade. When they conflict, you wait.
Include one volume or volatility confirmation tool. Volume Profile, standard volume bars, or ATR validates that the setup has energy and room to run. This final check prevents entries into dead ranges or exhausted moves. Three indicators total, each serving a distinct purpose, no overlap.
The Role of Price Action With Indicators
Indicators follow price, they don't lead it. Price creates support and resistance through actual supply and demand. Your indicator confirms what price structure already shows. A hammer candle at support with RSI oversold is stronger than RSI oversold alone. A breakout through resistance with expanding volume beats a volume spike without a clear level break.
Use indicators to filter price action setups, not replace them. When you spot a pin bar rejection at a key level, check your indicators before entry. Is the trend indicator confirming directional bias? Is momentum showing extreme readings that validate the rejection? Does volume show conviction? Indicators add confluence to patterns you already recognize.
Price action teaches you market psychology. A series of higher highs and higher lows shows accumulation and bullish control. A failed breakout above resistance shows distribution and smart money selling into retail buying. Indicators quantify these behaviors into measurable signals, but the underlying behavior is what moves your account.
Learn to read naked charts first, then add indicators as filters. If you can't identify trends, support, resistance, and momentum from price alone, adding indicators just creates more confusion. Master the basics, then enhance your edge with quantified confirmation tools.
Setting Realistic Expectations for Any Indicator
No indicator wins 100% of the time. Professional systems achieve 55% to 65% win rates. Your edge comes from risk management and position sizing, not perfect signals. A 60% win rate with 1:2 risk-reward generates consistent profits. A 70% win rate with 1:0.5 risk-reward loses money over time.
Indicators perform differently across market conditions. The best trading view indicator for trending markets often fails during consolidation. Oscillators excel in ranges but give constant false signals during strong trends. You need to recognize the current market regime and adjust your indicator reliance accordingly.
Your psychology matters more than your indicator choice. The perfect indicator means nothing if you override signals, move stops, or take random trades during drawdowns. Discipline and consistency with an average indicator beats sporadic application of the best indicator available.
Expect losing streaks and drawdowns. Even with the best tools and flawless execution, you'll face periods where nothing works. Markets change, volatility shifts, and correlations break down. Your indicator system's value shows in how it helps you survive these periods with minimal damage, not in eliminating them entirely.
Advanced Filtering Techniques for Better Signals
Time-based filters eliminate low-probability sessions. Only take signals during your market's high-volume hours. For forex, that's London open through New York overlap. For stocks, it's the first and last hour. For crypto, track when futures markets are most active. Signals during dead hours face wider spreads and less follow-through.
Trend strength filters prevent counter-trend trades. Measure trend strength using ADX or trend angle. When ADX is above 25, the trend is strong enough to trade. Below 20, you're in a range and breakout signals often fail. This single filter can cut your losing trades by 30%.
Confluence filters require multiple conditions. Don't take a trade because RSI is oversold. Take it because RSI is oversold, price is at support, the higher timeframe is bullish, and volume is declining into the level showing exhaustion. Stack conditions until only the highest-probability setups qualify.
News event filters protect you from volatility spikes. Don't hold positions through NFP, CPI, or central bank announcements unless you're specifically trading the event. The best technical setup gets destroyed by a data surprise. Calendar awareness is an indicator itself.
Finding the best trading view indicator means understanding that no single tool creates success. You need trend identification, momentum confirmation, and volume validation working together across multiple timeframes. When you build a system that provides instant clarity about market direction and filters out the noise that drains accounts, you finally trade with conviction instead of hope. PipTrend gives you that exact clarity through AI-powered trend detection and multi-timeframe confirmation, removing the guesswork so you can focus on execution instead of analysis paralysis.