MFI Indicator Explained: Money Flow vs Market Facilitation
On this page
Why MFI Confuses So Many Traders
Type “MFI” into a charting platform and you may get two entirely different indicators. One is the Money Flow Index, a volume-weighted momentum oscillator that scales from 0 to 100. The other is the Market Facilitation Index, Bill Williams’ histogram that divides a bar’s range by its volume.
Same acronym.
Completely different math, completely different interpretation.
The confusion is not academic.
Traders regularly apply the 80/20 overbought and oversold rules that belong to the Money Flow Index to a Market Facilitation Index histogram, which has no fixed scale at all. Others do the reverse and read green-bar logic into an oscillator that was never designed for it.
Both mistakes produce entries with no statistical edge behind them.
There is a second, subtler problem.
Even traders who know exactly which MFI they are using tend to treat extreme readings as automatic reversal signals.
A Money Flow Index print above 80 during a powerful uptrend is not a sell signal. It is evidence that buyers are committing capital aggressively, which in a trending market is a reason to stay long, not to fade.
An MFI extreme tells you participation is lopsided. It does not tell you the direction is about to change.
This guide separates the two indicators cleanly, then builds a rules-based framework around the Money Flow Index specifically: how the calculation works, how to read overbought and oversold conditions inside trend context, how to distinguish regular from hidden divergence, and how to confirm signals with market structure before risking capital. By the end you will have a checklist rather than a hunch.
Two Indicators, One Confusing Name
MetaTrader documents these as two separate indicators in two separate categories. That alone should settle the debate, but the acronym collision persists across forums, YouTube tutorials, and even some broker education pages.
Money Flow Index: Volume-Weighted Momentum
The Money Flow Index was developed by Gene Quong and Avrum Soudack and published in the 1990s. It takes the structure of the relative strength index and adds a volume weighting, producing what is best described as a volume-weighted momentum oscillator.
The logic: price alone tells you where the market went. Price multiplied by volume tells you how much conviction went with it. A 1% rally on triple average volume carries more information than a 1% rally on a quiet holiday session.
The output runs from 0 to 100.
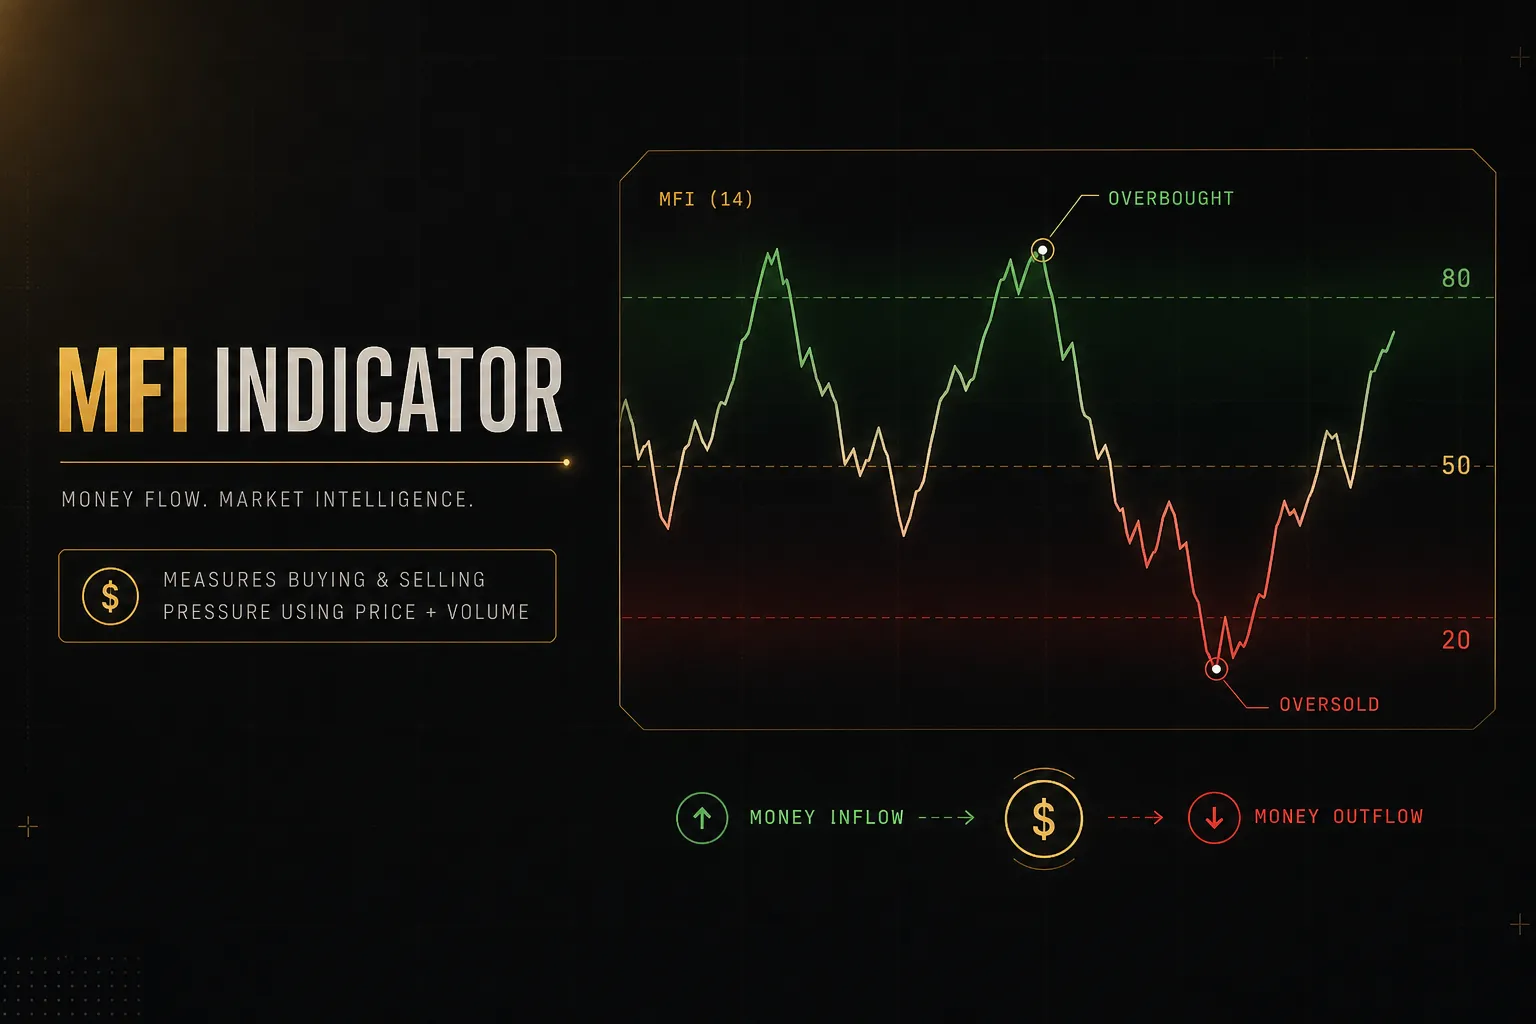
Readings above 80 conventionally mark overbought territory, below 20 oversold. Some traders tighten those bands to 70/30 for more frequent signals, or widen them to 90/10 for higher-conviction extremes on volatile instruments.
One clarification matters more than most tutorials admit. The Money Flow Index is a mathematical approximation of participation, not a literal record of institutional capital entering or leaving a market.
Nobody is tracking where the money went.
The formula simply assumes that when the typical price rises, that period’s dollar volume was buying pressure, and when it falls, it was selling pressure.
That is a useful proxy.
It is not a ledger.
Market Facilitation Index: Bill Williams’ Range Tool
Bill Williams built the Market Facilitation Index around a single question: how much price movement is the market generating per unit of volume?
The formula is refreshingly simple:
MFI (BW) = (High − Low) / Volume
That is it.
No smoothing, no lookback period, no 0-100 normalization. Which means there is no universal overbought or oversold level.
The value depends entirely on the instrument’s typical range and volume, so a reading of 0.0004 means nothing without context.
Interpretation comes from comparing the current bar to the previous one across two dimensions: did the index rise or fall, and did volume rise or fall? That produces four states, usually colour-coded on the histogram.
- Green (MFI up, volume up): More participants entering, price moving efficiently. The trend has fuel.
- Fade (MFI down, volume down): Interest is draining. The market is losing attention, often ahead of a range or a reversal.
- Fake (MFI up, volume down): Price is moving on thin participation. Often a stop-run or a low-conviction extension.
- Squat (MFI down, volume up): Heavy volume, small range. Buyers and sellers are fighting, and the winner usually produces the next strong move.
Notice what is absent: any fixed threshold.
Applying an 80/20 rule to this histogram is a category error, like reading a thermometer in kilometres.
For the remainder of this article, “MFI” refers to the Money Flow Index unless stated otherwise, because that is the tool most traders actually mean and the one with a rules-based framework worth building.
Calculating and Reading Money Flow Index
The Formula and a Worked Example
Understanding the calculation is not busywork. It explains exactly why MFI behaves the way it does, and why it sometimes diverges violently from RSI on the same chart.
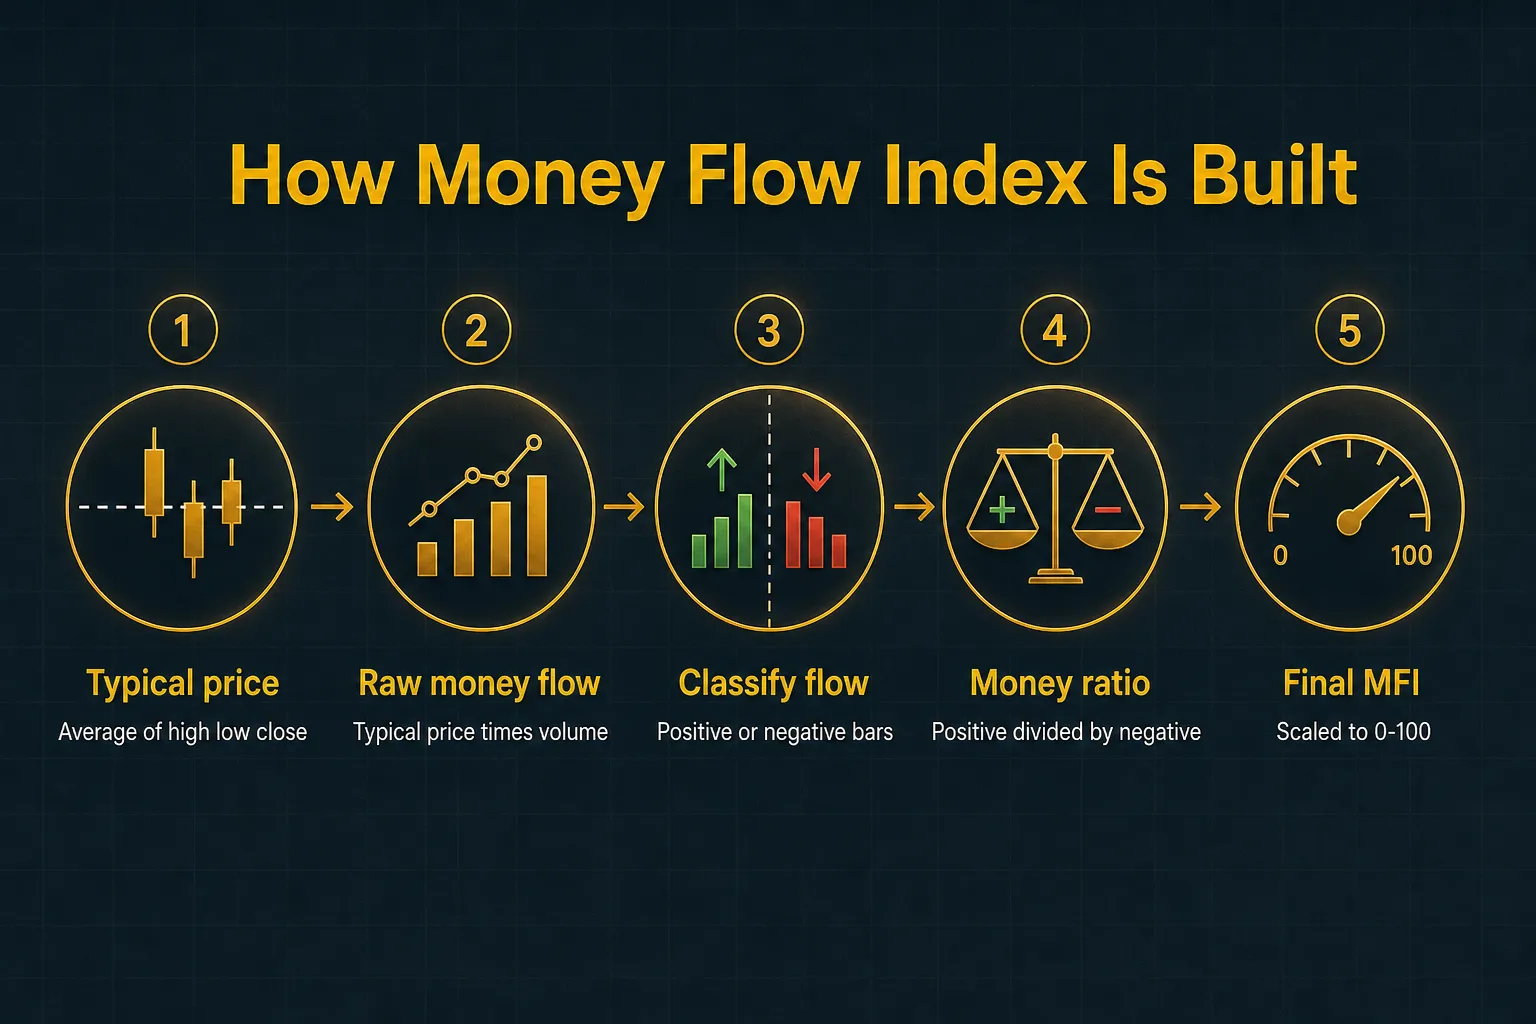
Four steps:
- Typical price: (High + Low + Close) / 3 for each period.
- Raw money flow: typical price × volume for that period.
- Classify the flow: if today’s typical price is higher than yesterday’s, the raw money flow counts as positive money flow. If lower, it counts as negative money flow. Unchanged periods are discarded.
- Money ratio and MFI: money ratio = sum of positive money flow over 14 periods / sum of negative money flow over 14 periods. Then MFI = 100 − (100 / (1 + money ratio)).
Here is a compressed five-day example. In a live chart the sums run over 14 periods, but the mechanics are identical.
| Day | High / Low / Close | Typical Price | Volume | Raw Money Flow | Direction |
|---|---|---|---|---|---|
| 1 | 102 / 98 / 100 | 100.00 | 50,000 | 5,000,000 | Baseline |
| 2 | 105 / 101 / 104 | 103.33 | 70,000 | 7,233,100 | Positive |
| 3 | 106 / 102 / 103 | 103.67 | 40,000 | 4,146,800 | Positive |
| 4 | 104 / 99 / 100 | 101.00 | 90,000 | 9,090,000 | Negative |
| 5 | 103 / 100 / 102 | 101.67 | 60,000 | 6,100,200 | Positive |
Positive money flow = 7,233,100 + 4,146,800 + 6,100,200 = 17,480,100. Negative money flow = 9,090,000.
Money ratio = 17,480,100 / 9,090,000 = 1.923.
MFI = 100 − (100 / (1 + 1.923)) = 100 − 34.21 = 65.79.
Look at day 4.
Price fell modestly but on the heaviest volume of the sample, and that single bar contributed the entire negative side of the ratio.
That is the volume weighting doing its job, and it is precisely why MFI can read materially lower than RSI on the same data.
Overbought and Oversold in Context
Here is the statistic that ruins most naive MFI strategies: during strong trends, the Money Flow Index can hold above 80 or below 20 for dozens of consecutive bars.
Not two or three.
Dozens.
In a sustained equity uptrend, MFI readings above 80 persisting for three to six weeks on the daily chart are routine. Every one of those bars looks like a sell signal in isolation.
Every one of them would have been wrong.
The reason is structural.
MFI measures the ratio of buying to selling participation. In a genuine trend, that ratio stays lopsided because the imbalance is the trend.
The oscillator is reporting reality accurately; the trader is asking it the wrong question.
So reframe the levels.
An MFI extreme is a condition, not a signal.
Conditions become signals only when something else confirms them:
- Price-structure confirmation: a break of a swing low after an overbought reading, or a failed retest of resistance.
- Momentum confirmation: MFI crossing back below 80 (or above 20) rather than simply touching the level, ideally alongside a MACD signal-line cross.
- Regime confirmation: is price ranging between defined support and resistance, or trending inside a clean higher-high, higher-low sequence?
In a range, MFI extremes at the boundaries are genuinely useful. In a trend, they are noise until market structure breaks.
That single distinction separates traders who profit from MFI from those who quietly fade it into oblivion.
Divergence: Regular vs Hidden
Divergence is where MFI earns its keep, provided you know which type you are looking at.
Regular divergence signals potential reversal.
Price prints a new high while MFI prints a lower high, meaning the new price extreme was achieved on weaker volume-weighted participation. That is bearish divergence.
The mirror image, price making a lower low while MFI makes a higher low, is bullish divergence and hints at seller exhaustion.
Hidden divergence signals trend continuation.
In an uptrend, price makes a higher low while MFI makes a lower low: the pullback drained participation more than it drained price, which typically precedes trend resumption.
In a downtrend, price makes a lower high while MFI makes a higher high.
The discipline that matters most: anchor both points to clearly identifiable swing highs or swing lows.
Not to intrabar wicks.
Not to arbitrary points you found by squinting.
A usable swing point should be visible without the indicator on the chart. If you have to hunt for it, you are curve-fitting a divergence into existence, and that is the single most common way traders convince themselves a losing setup was valid.
Practical filter: divergences spanning fewer than five bars are usually noise. Divergences spanning 10 to 40 bars between two obvious pivots carry considerably more weight, especially when the second pivot forms at a tested support or resistance level.
MFI vs RSI, OBV, CMF, and VWAP
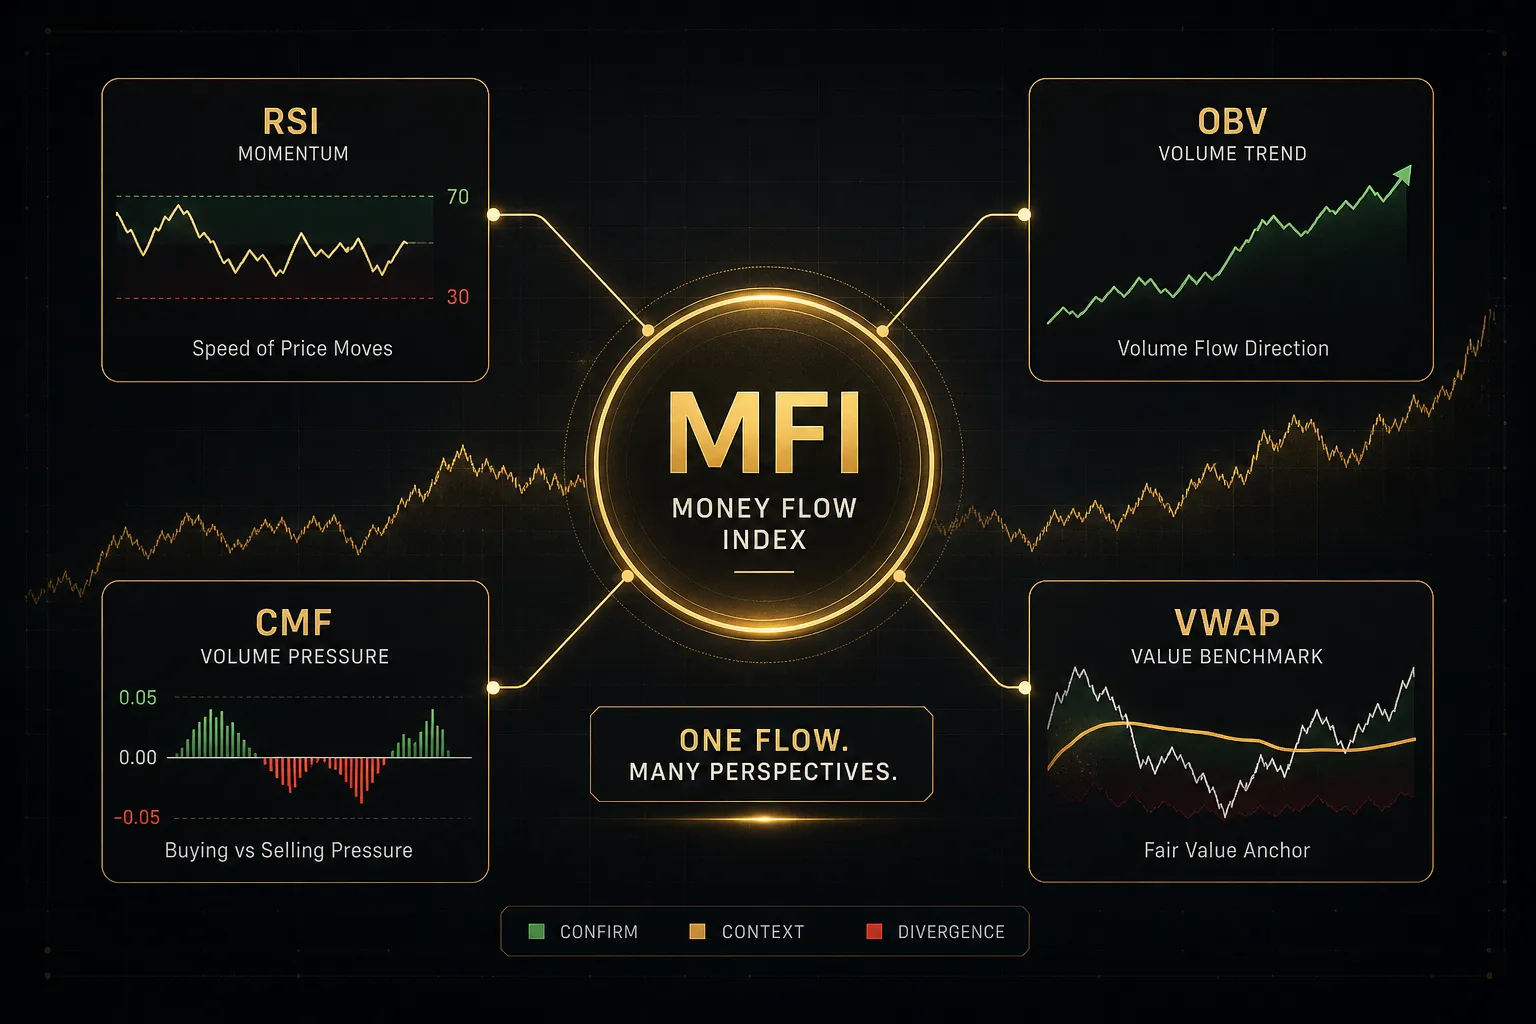
Stacking five volume indicators on one chart feels thorough. It usually just means seeing the same information five times, then mistaking repetition for confirmation.
Each of these tools answers a genuinely different question. Knowing which is which prevents redundant confluence.
| Indicator | What It Measures | Uses Volume? | The Question It Answers |
|---|---|---|---|
| Money Flow Index | Volume-weighted momentum over 14 periods, scaled 0-100 | Yes (price × volume) | Is buying or selling participation dominant right now? |
| Relative Strength Index | Average gains vs average losses, scaled 0-100 | No | How strong is price momentum by itself? |
| On-Balance Volume | Running cumulative total of volume added or subtracted by close direction | Yes (full volume per bar) | Is volume accumulating or distributing over time? |
| Chaikin Money Flow | Close position within each bar’s high-low range, volume-weighted over 20-21 periods | Yes (weighted by close location) | Are buyers or sellers winning the close inside each bar? |
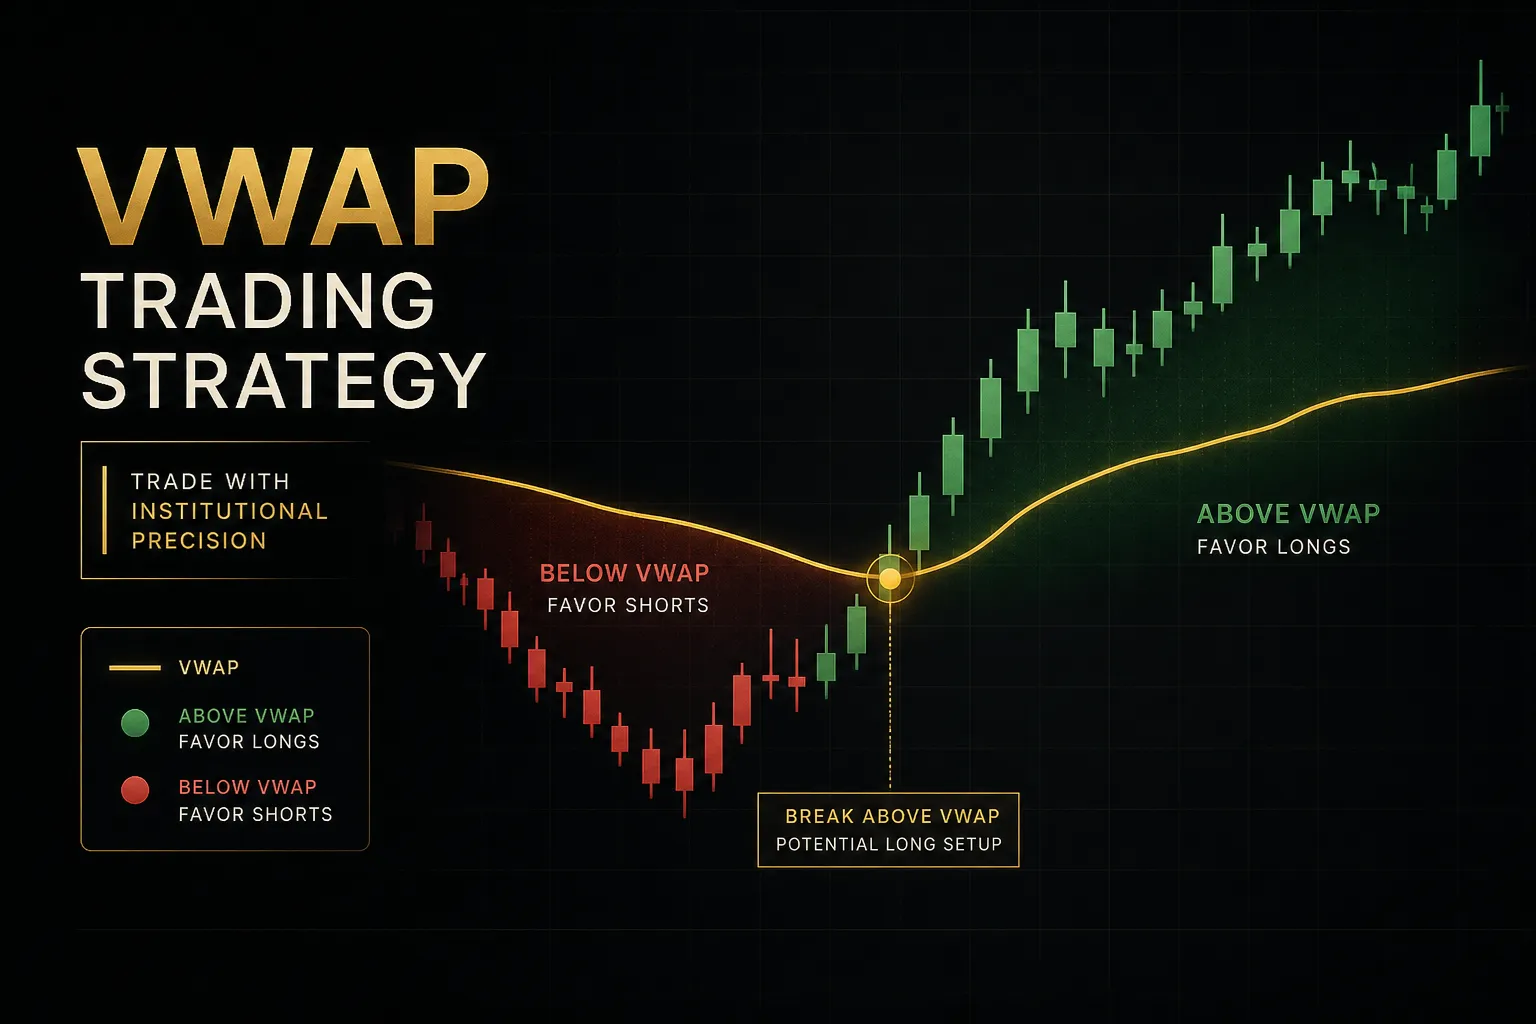
| VWAP | Cumulative average price weighted by volume, usually reset each session | Yes | Am I buying above or below the day’s fair value? |
Why do MFI and RSI disagree so often?
Four reasons.
Volume participation (MFI penalises price moves made on thin volume), price magnitude handling (RSI uses close-to-close change, MFI uses typical price), instrument type (heavily volume-driven markets show wider gaps), and data source differences between platforms.
That last point deserves emphasis for forex traders. Spot FX has no centralised exchange, so forex MFI almost always runs on tick volume, which counts price updates rather than contracts traded.
Your broker’s tick volume is not your neighbour’s broker’s tick volume.
Tick volume correlates reasonably well with actual trade volume in liquid majors, with published studies putting the correlation above 0.85 on intraday data.
That is good enough for directional inference, not good enough for precise threshold trading.
Interpret forex MFI readings with wider tolerance, or run it on futures data where real volume exists.
Building a Rules-Based MFI Trading Plan
Settings by Timeframe and Style
The default 14-period setting exists because Welles Wilder used 14 for RSI in 1978.
It is a convention, not a law of markets.
Adjusting it changes the character of the indicator in predictable ways.
- 9-10 periods for day trading: Faster response, more signals, more whipsaw. On 5-minute and 15-minute charts a 9-period MFI will tag 80 and 20 several times per session, which is only workable if you have strict structural filters. Expect roughly double the signal count of a 14-period setting.
- 14 periods as the default: The balanced choice for 1-hour and 4-hour charts. Enough smoothing to filter single-bar noise, enough responsiveness to catch a genuine shift in participation within two or three bars.
- 20-25 periods for swing trading: Smooths the oscillator considerably on daily and weekly charts. Extremes become rarer and more meaningful, and divergences stretch across larger, more reliable swing structures. Fewer signals, higher average quality.
- Adjust the bands, not just the period: On high-volatility instruments like crypto, 85/15 filters out a meaningful chunk of false extremes. On slow-moving index ETFs, 70/30 may produce more usable signals than 80/20.
- Avoid curve-fitting: If you test 40 period settings and select the one that maximised return on a single historical stretch, you have optimised for the past, not the market. Choose a period that fits your holding horizon, then leave it alone. A setting that only works at 17 and fails at 16 and 18 is a fluke, not an edge.
Common Mistakes and a Backtesting Checklist
Most MFI failures trace back to four repeated errors, and each has a specific fix.
- Treating 80/20 as automatic reversal points. These are participation extremes, not turning points. Require a structural trigger, such as a broken swing level or a close back inside the band, before acting.
- Ignoring trend context entirely. Fading MFI extremes inside a strong trend is the fastest documented way to lose money with this indicator. Establish regime first: trending or ranging, then decide whether extremes mean “continuation” or “boundary”.
- Stacking redundant volume indicators. MFI, CMF, and OBV all incorporate volume. When all three agree, you have not gained three confirmations, you have gained one confirmation counted three times. Pair MFI with something structurally different: market structure, VWAP position, or MACD.
- Misreading forex tick volume as true market volume. Tick counts inflate during news spikes regardless of contract size. Treat forex MFI extremes as softer evidence than equity or futures MFI extremes.
Before you trade any MFI rule set with real capital, run it through this checklist:
- Confirm signals only after candle close. Intrabar MFI values move constantly. Recording an entry at a level the indicator only touched mid-bar creates look-ahead bias and inflates backtest results dramatically.
- Test trending and ranging regimes separately. Split your sample using a simple filter such as ADX above or below 20. A strategy that averages breakeven overall may be strongly profitable in one regime and badly negative in the other. That is actionable information, and the blended number hides it.
- Include spread and transaction costs. On intraday timeframes, costs commonly consume 20-40% of a raw edge. A backtest without them is fiction.
- Validate on out-of-sample data. Develop rules on 70% of your history, then test untouched on the remaining 30%. If performance collapses, you fitted noise.
- Record a minimum sample size. Fewer than 100 trades tells you almost nothing about expectancy. Aim for 200 or more across at least two market cycles.
Confirming Signals with PipTrend
An MFI extreme paired with a clean divergence is a heads-up.
It is the moment you start paying attention, not the moment you click buy.
The gap between “worth watching” and “worth risking capital on” is filled by timing and trend alignment, and that is where multi-timeframe confirmation earns its place in a plan.
- Non-repainting signals matter more than most traders realise. An indicator that revises its historical signals makes every backtest meaningless. PipTrend’s signals are fixed once printed, so what you review after the fact is what you would actually have seen live.
- Use the 12-timeframe confirmation table for trend alignment. If your 1-hour MFI is oversold but the 4-hour, daily, and weekly all read bearish, that oversold print is a pullback inside a downtrend, not a reversal. The table answers that question in a single glance rather than through six chart switches.
- Anchor entries to VWAP and supply/demand levels. An MFI extreme that coincides with a rejection at a defined supply zone or a VWAP reclaim gives you a precise entry and, more importantly, a precise invalidation point immediately beyond that level.
- Sequence the checks in order: regime first, then MFI condition, then divergence quality, then higher-timeframe alignment, then a structural trigger. If any step fails, there is no trade. That is the whole discipline.
MFI Questions Traders Still Ask
What is the MFI indicator and how does it work?
The MFI indicator, or Money Flow Index, is a volume-weighted momentum oscillator that measures buying and selling pressure on a 0-100 scale, typically over 14 periods. It multiplies each period’s typical price by its volume to produce raw money flow, sorts those values into positive and negative buckets based on direction, and converts the resulting money ratio into an oscillator reading.
The separate Market Facilitation Index shares the acronym but simply divides a bar’s range by its volume with no fixed scale.
Is MFI a leading or lagging indicator?
MFI is best classified as a lagging momentum confirmation tool, not a predictive leading signal.
Every value it produces is calculated from price and volume that have already occurred, so it describes participation rather than forecasting it.
Divergence gives it a mildly anticipatory quality, but that is early warning of weakening momentum, not a prediction of when or whether price will actually turn.
What is a good MFI reading to buy?
No MFI reading is a buy signal on its own.
Readings below 20 identify oversold conditions worth investigating, and a cross back above 20 combined with a higher low in price structure is a more usable trigger than the extreme itself.
In a ranging market, oversold readings near established support carry the most weight; in a strong downtrend, sub-20 readings can persist for weeks without any reversal.
What is the difference between MFI and RSI?
MFI incorporates volume, RSI does not.
Both are 0-100 oscillators built on the same ratio structure, but RSI compares average price gains to average losses while MFI weights each period’s typical price by its volume.
That means MFI penalises price moves made on thin participation, so it often reads weaker than RSI during low-volume rallies and stronger during high-volume ones.
How accurate is the Money Flow Index?
MFI accuracy depends on confirmation, timeframe, and market regime rather than on the indicator itself.
Used alone as an 80/20 reversal trigger, it performs poorly in trending markets and reasonably in ranges.
Combined with market structure, higher-timeframe trend alignment, and a defined invalidation level, it becomes a useful filter, but no honest single accuracy percentage exists across instruments and conditions.
How do you use MFI divergence in trading?
Anchor both the price pivot and the MFI pivot to clearly visible swing highs or lows, then classify the divergence type.
Regular divergence, where price makes a new extreme that MFI fails to match, warns of potential reversal; hidden divergence, where MFI makes the new extreme instead, supports trend continuation.
Wait for a structural confirmation such as a broken swing level before entering, and place your stop beyond the pivot that formed the divergence.
The One Rule That Matters Most
Never act on an MFI extreme alone.
Pair it with market structure, a second confirming signal from a genuinely different source, and a predefined invalidation level before you enter anything.
The decision tree is short enough to memorise.
Strong trend plus MFI extreme? Stay alert, do nothing, wait for structure to break.
Ranging market plus MFI extreme plus regular divergence at a tested level? Now you have a reversal setup worth investigating properly.
Everything else is noise dressed up as analysis.
The Money Flow Index is a participation and momentum lens. It tells you how much conviction sat behind the last 14 bars of price movement, which is genuinely valuable information most price-only indicators cannot give you.
What it cannot do is tell you what happens next.
Its value comes entirely from disciplined multi-signal use: regime, condition, confirmation, invalidation.
Get that sequence right and MFI becomes a reliable filter.
Skip a step and it becomes an expensive opinion.
Sources
Risk Disclaimer: Trading involves risk. Past performance doesn't guarantee future results. Only trade with money you can afford to lose. PipTrend is a tool to assist your trading decisions, not financial advice.