How the Accumulation Distribution Indicator Really Works
On this page
What the A/D Line Actually Measures
Most traders think the accumulation distribution indicator shows them where institutions are buying.
It doesn’t.
Not even close.
The Accumulation Distribution Line is a cumulative volume-flow indicator built from one narrow question: where did price close inside its own high-low range?
That’s it.
If a bar closes near its high, the indicator treats that bar’s volume as accumulation. Close near the low, and it counts as distribution.
Marc Chaikin developed the A/D line as an evolution of raw volume analysis. Plain volume tells you how much traded.
It says nothing about who won the session. Chaikin’s insight was to weight each bar’s volume by the closing location within that bar’s range, producing a running total that tracks price-volume analysis rather than volume alone.
The A/D line measures closing location weighted by volume. Everything else you’ve heard about it, including “smart money footprints,” is interpretation layered on top of that arithmetic.
This guide does something most A/D articles skip. It explains when the signal deserves your trust, when it deserves a second look, and when it should be ignored entirely.
The formula is the easy part.
Knowing its blind spots is what separates a useful tool from a misleading one.
A/D can be plotted on stocks, forex pairs, crypto, indices and commodities. But it behaves very differently depending on how the volume data reaches your chart.
Exchange-traded stocks report real volume. Forex brokers report tick counts. Crypto reports fragmented volume from a dozen venues.
Same indicator, three very different levels of reliability.
Breaking Down the Formula
The calculation runs in three stages, and every platform from TradingView to MetaTrader uses the same sequence. Once you’ve done it by hand a single time, the indicator stops being a mystery line and starts being arithmetic you can predict.
The Money Flow Multiplier Explained
- Calculate the Money Flow Multiplier. The formula is ((Close − Low) − (High − Close)) / (High − Low). This produces a value bounded between +1 and −1, where +1 means the bar closed exactly at its high and −1 means it closed exactly at its low.
- Convert it into Money Flow Volume. Multiply the Money Flow Multiplier by the bar’s volume. A multiplier of +0.6 on 1,000,000 shares gives 600,000 units of Money Flow Volume, meaning 60% of that bar’s volume gets counted as buying pressure.
- Add it to the running total. The A/D line equals the prior A/D value plus the current bar’s Money Flow Volume. The line is cumulative, so it never resets and has no upper or lower bound.
A midpoint close produces a multiplier of exactly zero.
That bar contributes nothing at all, regardless of whether it traded 10,000 shares or 10 million.
That’s a deliberate design choice, and it’s also one of the indicator’s quiet weaknesses.
A Full Calculation Walkthrough
Here’s the arithmetic on four consecutive daily bars, starting from a prior A/D value of 0.
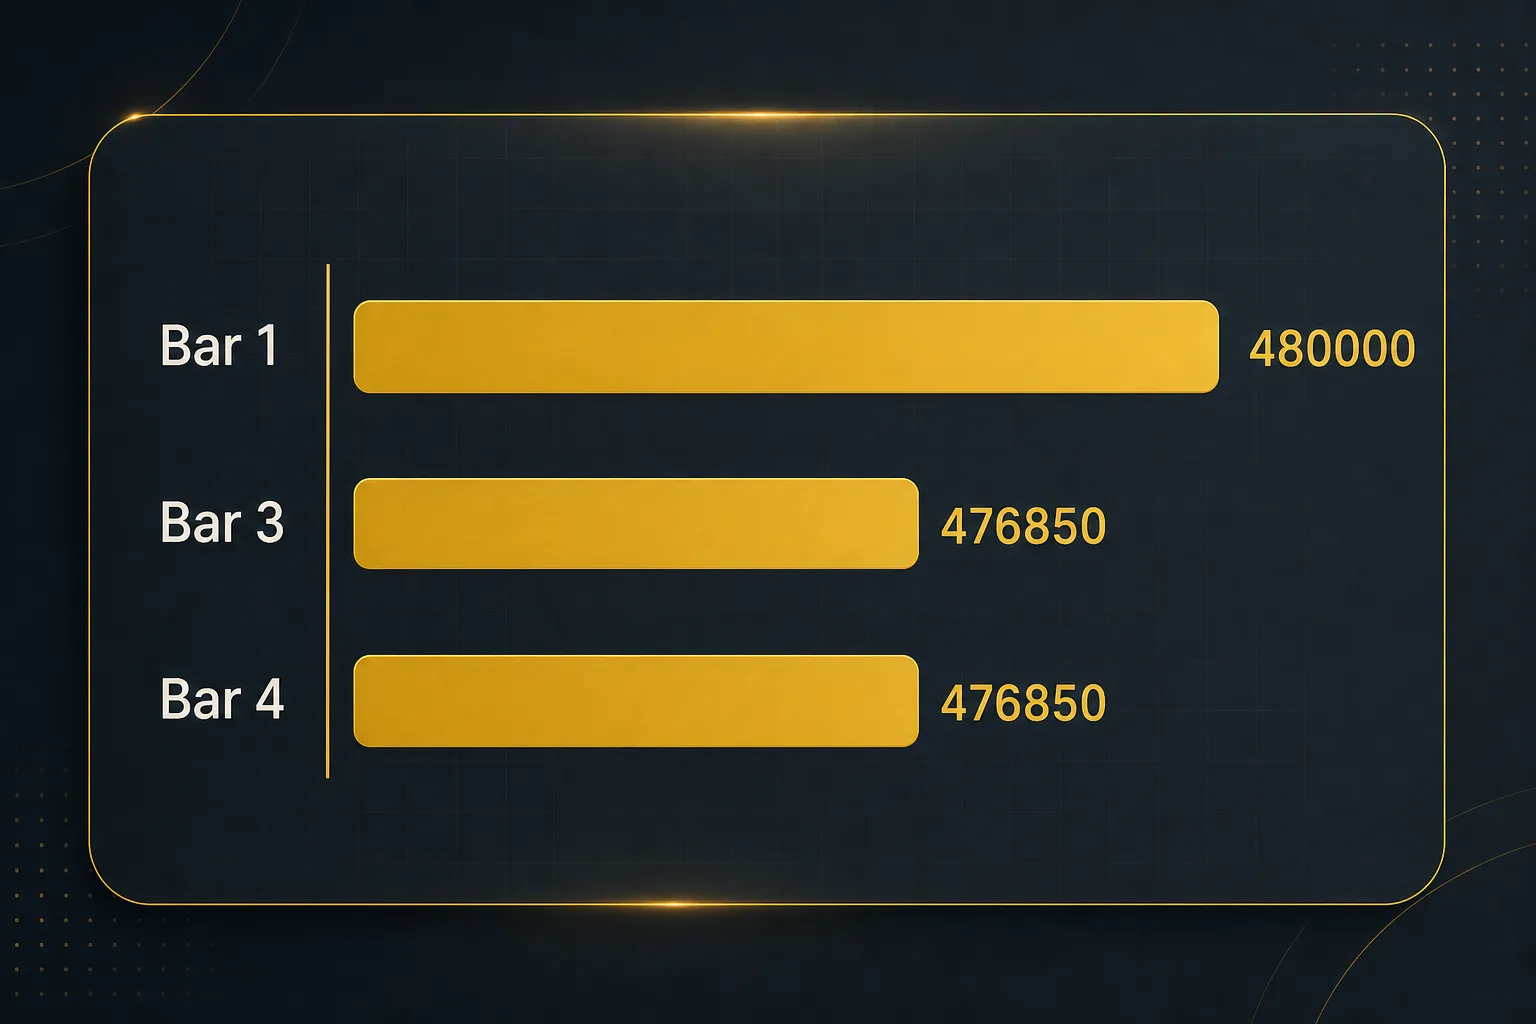
- Bar 1: High 52.00, Low 50.00, Close 51.60, Volume 800,000. The multiplier is ((51.60 − 50.00) − (52.00 − 51.60)) / 2.00 = (1.60 − 0.40) / 2.00 = +0.60. Money Flow Volume is 480,000, so the A/D line moves from 0 to 480,000.
- Bar 2: High 52.50, Low 51.00, Close 51.20, Volume 1,200,000. The multiplier is ((51.20 − 51.00) − (52.50 − 51.20)) / 1.50 = (0.20 − 1.30) / 1.50 = −0.733. Money Flow Volume is −880,000, dropping the cumulative total to −400,000.
- Bar 3: High 51.80, Low 50.50, Close 51.75, Volume 950,000. The multiplier is ((51.75 − 50.50) − (51.80 − 51.75)) / 1.30 = (1.25 − 0.05) / 1.30 = +0.923. Money Flow Volume is 876,850, lifting the running total to 476,850.
- Bar 4: High 53.00, Low 51.50, Close 52.25, Volume 1,500,000. The multiplier is ((52.25 − 51.50) − (53.00 − 52.25)) / 1.50 = (0.75 − 0.75) / 1.50 = 0.00. Money Flow Volume is zero, so the A/D line stays flat at 476,850 despite the heaviest volume of the four bars.
Bar 4 is the lesson.
Price made a new high, volume surged 58% above the prior bar, and the indicator didn’t move a tick.
A perfectly balanced close cancels the entire bar.
There’s one edge case worth knowing.
When High equals Low, which happens on illiquid stocks, limit-locked futures, and thin overnight crypto candles, the denominator becomes zero. Division by zero is undefined, so charting platforms almost universally treat the multiplier as zero for that bar.
The bar contributes nothing and the line carries forward unchanged.
One more thing that trips people up constantly.
The absolute A/D value is meaningless on its own. A reading of 4.2 million on one chart and 180,000 on another tells you nothing comparative.
The number depends entirely on where your chart history begins and the volume scale of that instrument. Load a longer history and the value changes. Switch platforms and it changes again.
Only slope and direction carry information.
Reading Rising and Falling Signals
What a Rising Line Signals
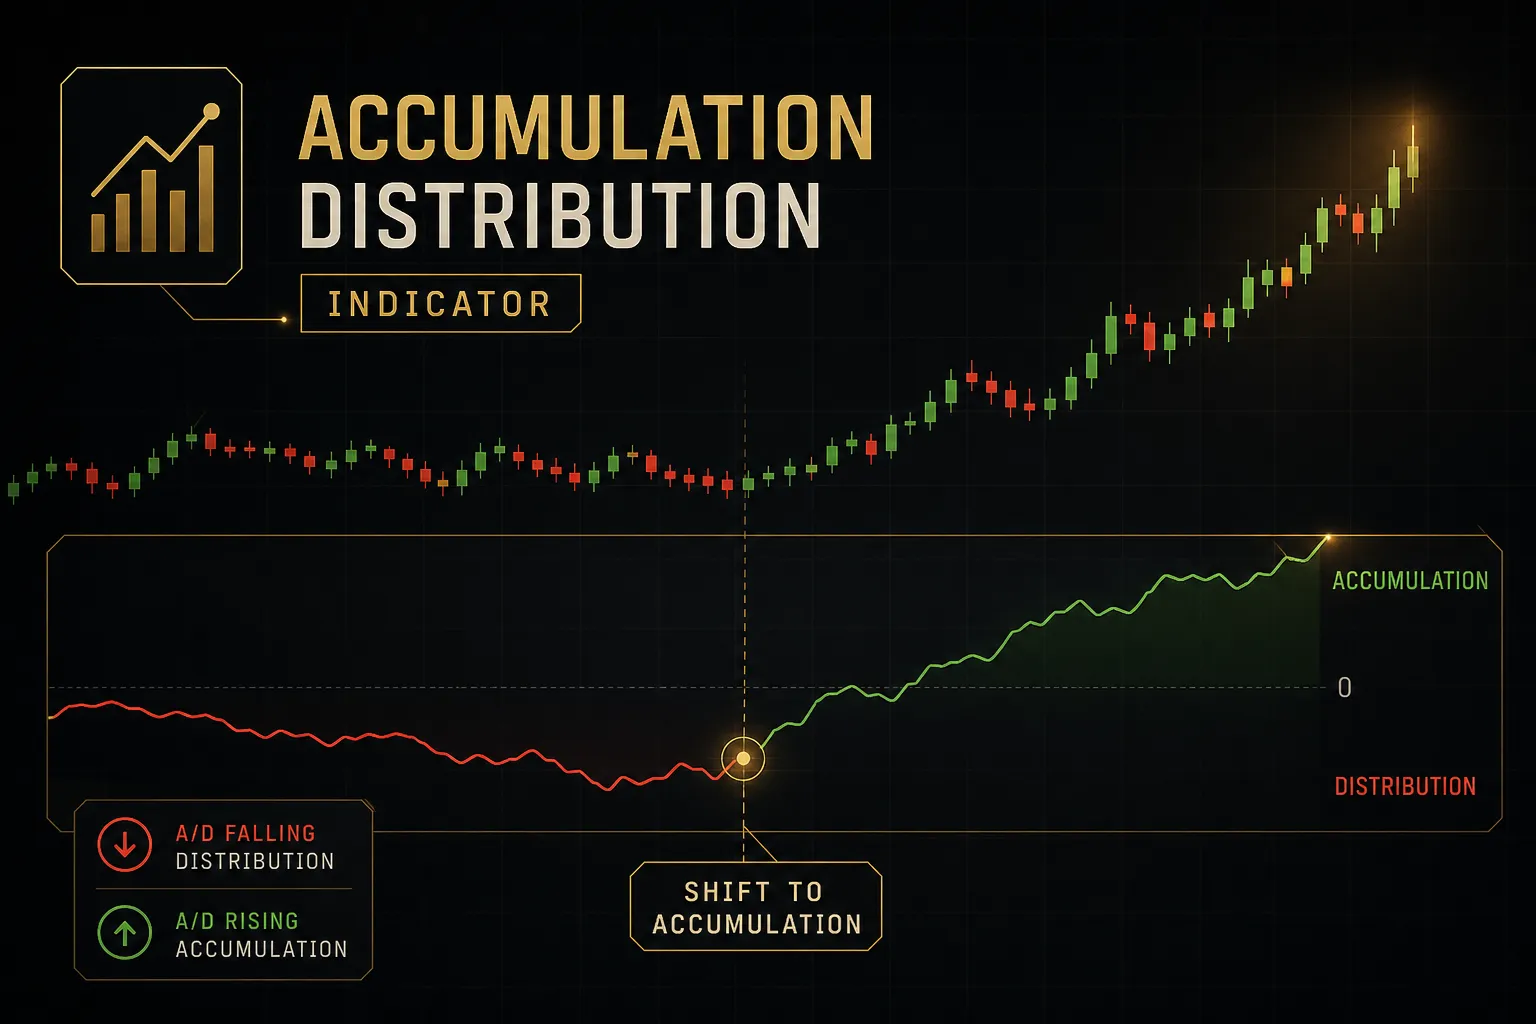
A rising A/D line means closes are repeatedly landing in the upper half of their bars, with meaningful volume behind them.
Buyers are finishing sessions in control.
That’s suggestive of buying pressure, and over a sustained stretch it often does coincide with genuine accumulation.
But it isn’t proof.
A stock can close near its high day after day on thin retail flow while a large seller quietly works orders into strength.
The indicator can’t see order flow, participant type, or intent. It sees four numbers per bar.
Where a rising line earns its keep is in trend confirmation. When price is making higher highs and the A/D line makes matching higher highs, the move has volume participation behind it.
That’s the healthy version of an uptrend.
What a Falling Line Signals
A falling line is the mirror image.
Closes cluster in the lower portion of each bar’s range, and the cumulative total bleeds lower.
This reflects selling pressure, with the same caveat attached: pressure is not the same as institutional distribution.
The most useful falling-line scenario is when price is still grinding sideways or slightly higher while the A/D line rolls over decisively.
Supply is being absorbed at the highs.
Buyers keep showing up, but sellers keep winning the close.
Look for slope, not level.
A line that has fallen for six months but is now flattening is telling you something different from one that just started dropping.
Spotting Real Divergence
Divergence is where most traders lose money with this indicator, because “the line looks different from price” is not a rule.
You need objective criteria.
Here’s a set that holds up:
Define the swing first. A swing high requires a bar whose high exceeds the highs of at least five bars on each side.
Same logic inverted for swing lows. This filters out the noise that makes every chart look full of divergences.
Bullish divergence exists when price prints a lower swing low while the A/D line prints a higher low across the same two swing points. Bearish divergence is a higher price swing high paired with a lower A/D high.
Both swings must qualify under the five-bar rule, and they should be at least 10 bars apart to be meaningful.
Require a confirmation candle. Divergence alone is a condition, not a trigger.
Wait for a close beyond the most recent minor structure, a break of a short-term trendline, or a reclaim of a broken level.
No confirmation, no trade.
Set invalidation before entry. If price breaks the prior swing low that formed your bullish divergence, the setup is dead.
Exit.
Divergences can persist for months while price grinds against you.
Why can price and A/D move in opposite directions at all? Consider two bars that both close near the high, up 1.2% on the day. Bar A trades 400,000 shares against a 20-day average of 1.5 million. Bar B trades 3 million.
Both get a multiplier around +0.8, but Bar A adds roughly 320,000 to the line while Bar B adds 2.4 million.
Price rose identically.
The volume-weighted evidence did not.
String together enough low-volume advances and the A/D line flatlines or falls while the chart makes new highs.
Where the Indicator Breaks Down
Every indicator has a failure mode.
The A/D line has four, and three of them are structural rather than situational, which means no amount of tuning fixes them.
The Gap Problem
The formula only reads the current bar’s high, low and close.
It never looks at the previous close.
That’s a genuine blind spot.
- Gap-down bars can register as accumulation. A stock closes at $50, opens at $44 on bad earnings, then rallies intraday to close at $45.50 near the top of a $43.80-$45.70 range. The multiplier comes out strongly positive, so the A/D line rises on a day the stock lost 9%. Technically accurate, contextually absurd.
- Gap-up bars can register as distribution. The same mechanic inverted. Price gaps 6% higher, fades all session, closes near the bar low, and the indicator records heavy selling despite a strongly positive day.
- Overnight news is invisible. Earnings, guidance changes, macro releases and index rebalances all move price between sessions. The A/D line simply has no input for any of it.
- Chaikin Money Flow inherits the same flaw. Because CMF uses the identical multiplier over a rolling window, it does not solve the gap issue. Only On-Balance Volume, which compares close to prior close, handles gaps directly.
Forex and Crypto Volume Quirks
The A/D line is only as trustworthy as its volume input, and outside of centralized equity exchanges that input gets murky fast.
- Forex charts show tick volume, not traded volume. Your broker counts how many times the price changed during the bar. That’s an activity proxy, not a measure of contracts or notional value exchanged in a decentralized market with no central tape.
- Tick volume varies by broker. Two brokers can display materially different volume for the same EUR/USD hour because their liquidity pools and price-update frequencies differ. The cumulative A/D line will therefore differ too, sometimes substantially.
- Crypto has no single close. Markets run 24/7, so the “daily close” is an arbitrary timestamp set by the exchange or platform. Shift the daily boundary by four hours and every multiplier in your history changes.
- Crypto volume is fragmented across venues. Bitcoin trades on dozens of exchanges with differing volume conventions, wash-trading exposure, and reporting standards. A Binance-only A/D line and a Coinbase-only A/D line can diverge for weeks.
- It lags by construction. A/D uses completed bars. It confirms what already happened and cannot lead price.
- There’s no fixed scale. No overbought level, no oversold level, no cross-symbol comparison. Only relative slope matters.
- One volume spike can dominate. An index-rebalance day or a liquidation cascade can inject a Money Flow Volume figure ten times larger than a normal bar, permanently skewing the cumulative line’s appearance.
- It is not predictive on its own. Divergence identifies weakening participation. It does not time reversals, and it never has.
Turning Signals Into Trade Confirmation
A Breakout Confirmation Workflow
The A/D line earns its place in a process, never as a standalone trigger. Breakouts are where it delivers the most value, because breakouts live and die on participation.
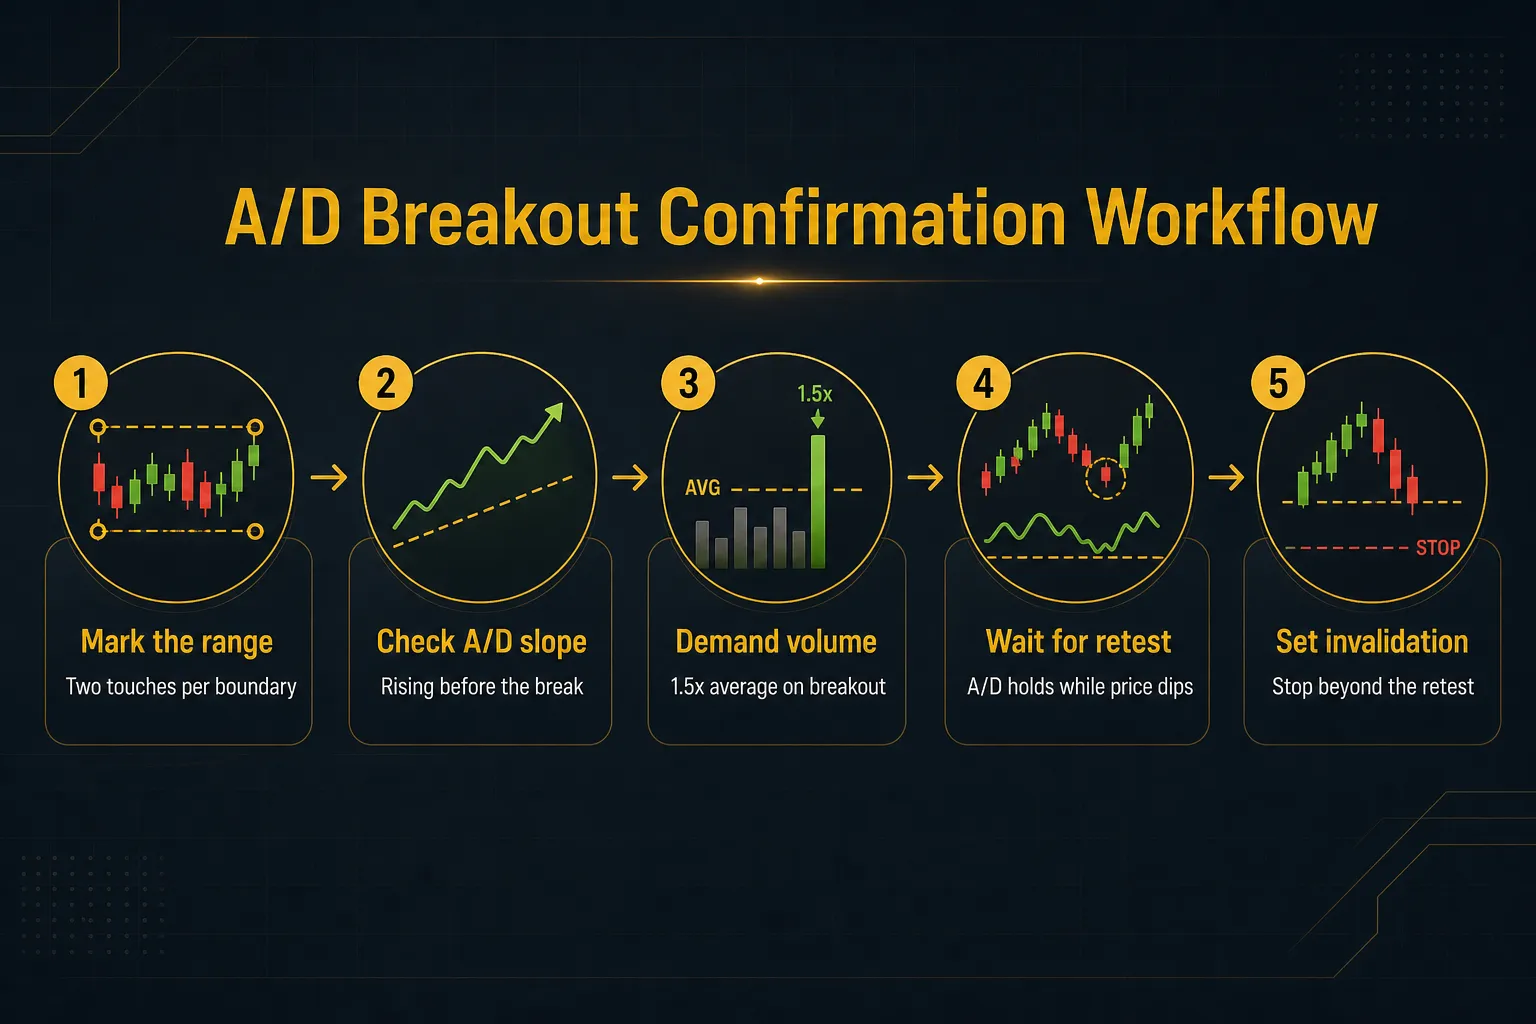
Start by marking the range.
Draw the horizontal support and resistance boundaries that have been rejected at least twice each.
If you can’t identify clean boundaries, there’s no breakout to confirm and the indicator has nothing to add.
Next, check A/D direction inside the range.
A line that has been climbing steadily while price chopped sideways suggests quiet absorption, and it tilts the odds toward an upside resolution.
A flat line means participation is balanced and the eventual break has less evidence behind it.
Then demand volume confirmation on the breakout bar itself. Look for volume at least 1.5 times the 20-period average, paired with a close in the upper third of the bar’s range so the Money Flow Multiplier registers positive.
A breakout bar that closes mid-range on average volume adds nothing to the A/D line, which is exactly the tell you want.
After that, wait for the retest. Most durable breakouts return to the broken level within three to ten bars.
During the retest, the A/D line should hold its recent high or decline far less than price does.
That asymmetry is the confirmation.
Finally, place the stop below the retest low for longs, above the retest high for shorts, and size the position so that stop costs no more than your fixed risk per trade.
If the retest closes back inside the range with the A/D line rolling over, the breakout has failed and there’s nothing to salvage.
Pairing A/D With Other Tools
Here’s a mistake worth naming directly: stacking three volume indicators and calling it confluence. On-Balance Volume, Chaikin Money Flow and the A/D line all read from the same volume series.
When they agree, you haven’t gathered three pieces of evidence.
You’ve gathered one piece of evidence, viewed three times.
Real confirmation comes from independent inputs. Two indicators reading the same data stream will almost always agree, which is exactly why their agreement means so little.
Pair A/D with something structural instead.
Market structure (higher highs and higher lows), moving average slope, or a multi-timeframe trend model all derive their signal from price behavior rather than volume flow.
When a volume-based tool and a structure-based tool agree, that’s genuinely independent.
Matching Timeframes to Your Trade
The A/D line tells you about participation.
It says nothing about whether you’re trading with or against the dominant trend on higher timeframes, and that’s usually the more expensive question.
A system like PipTrend addresses that gap directly.
Its color-coded candles show trend direction at a glance on your working chart, while a 12-timeframe confirmation table shows whether the same direction holds from the 1-minute out to the monthly.
Green across ten of twelve timeframes on a pair where A/D has been climbing through consolidation is a very different setup from the same A/D reading with mixed higher-timeframe signals.
Used together, the division of labor is clean.
The trend system answers which direction and when. The A/D line answers is there volume evidence behind it.
Neither one replaces the other, and neither should be traded alone.
Common Questions About A/D
Is the accumulation distribution indicator accurate?
The A/D line has no accuracy rate, because it is not a predictive signal generator. It is a lagging, context-providing measure of where closes have landed within their ranges, weighted by volume.
Judge it by whether its signals align with subsequent price structure, not by a win percentage.
In backtests, standalone A/D divergence entries typically perform no better than random on liquid markets. Filtered through market structure and volume expansion, the same signals become useful context.
What is the difference between accumulation distribution and on balance volume?
On-Balance Volume adds or subtracts the entire bar’s volume based purely on whether the close is above or below the prior close. The A/D line instead weights volume by where the close sits inside the current bar’s high-low range.
That difference matters in practice.
OBV registers gaps because it compares closes across bars, so it handles earnings and news gaps more sensibly. A/D captures intrabar conviction, distinguishing a bar that closed at its high from one that closed barely positive after fading all session.
Use OBV when gap behavior matters. Use A/D when you care about how sessions resolve internally.
How do you read an accumulation distribution chart?
Read the slope, never the number.
The absolute value depends on your chart’s start date and the instrument’s volume scale, which makes it useless for comparison across symbols or platforms.
Compare the direction of the A/D line to the direction of price over the same swing points.
Agreement supports the move.
Disagreement over qualified swings flags a possible bullish divergence or bearish divergence. Before drawing conclusions, verify that your volume feed is real exchange volume rather than a broker tick count.
What does divergence in the accumulation distribution line mean?
Divergence means price and volume-weighted closing pressure disagree, which signals weakening participation behind the current move.
It does not mean a reversal is imminent.
A bearish divergence, where price makes a higher high but A/D makes a lower high, indicates each new high is being achieved with less closing strength and volume support.
That condition can persist for weeks.
Treat divergence as a reason to tighten risk or demand more confirmation, not as an entry signal.
What is the best setting for the accumulation distribution indicator?
There is no period setting to optimize.
The A/D line is cumulative from the first bar of your loaded chart history, so it has no lookback parameter in the way RSI or a moving average does.
Some platforms let you overlay a moving average, commonly 20 or 50 periods, to smooth the line and make slope changes easier to spot.
That’s a display aid, not a setting.
The only meaningful variable you control is how much history you load, which shifts the absolute value without changing the shape of recent action.
Does accumulation distribution work in forex?
It works in forex, but only if you treat tick volume as a rough proxy for market activity rather than actual traded volume. Forex is decentralized with no central tape, so your broker is counting price updates, not contracts.
Reliability improves on major pairs during high-liquidity sessions, where tick counts correlate reasonably well with real participation. It degrades on exotic pairs, thin Asian-session hours, and brokers with inconsistent feeds. Compare readings across two brokers once; if the lines diverge noticeably, weight A/D lower in your forex process.
Treat A/D as Evidence, Not a Trigger
The accumulation distribution indicator earns its place through direction, slope, and relationship to price. It never earns its place as a buy or sell button, and any strategy built on A/D crossovers or absolute levels is built on sand.
Here’s a decision rule simple enough to apply on any chart.
If the A/D line confirms a breakout that also has volume expansion and clean structure behind it, treat that as added confidence and size normally.
If A/D diverges from price without any structural confirmation, wait.
The divergence may be telling you something real, but it isn’t telling you when.
The gap blind spot, the unreliable forex tick volume, the fragmented crypto feeds… these aren’t reasons to abandon the tool. They’re reasons to know exactly what you’re looking at before you act on it.
One practical assignment for this week.
Find the next A/D divergence on a chart you actually trade, write down the two swing points and the invalidation level, then check the setup against a trend or structure tool like PipTrend’s multi-timeframe table before you commit a single dollar.
Do that ten times and you’ll know more about how this indicator behaves in your markets than any article can teach you.
Risk Disclaimer: Trading involves risk. Past performance doesn't guarantee future results. Only trade with money you can afford to lose. PipTrend is a tool to assist your trading decisions, not financial advice.