Stop Chasing the "Best" Forex Indicator
On this page
Why “Best Indicator” Is the Wrong Question
Search “best indicator for forex” and you’ll get ten thousand answers, most of them contradicting each other. RSI. MACD. Ichimoku. Some proprietary arrow tool that promises 92% accuracy. The problem isn’t that these tools are bad.
The problem is the question.
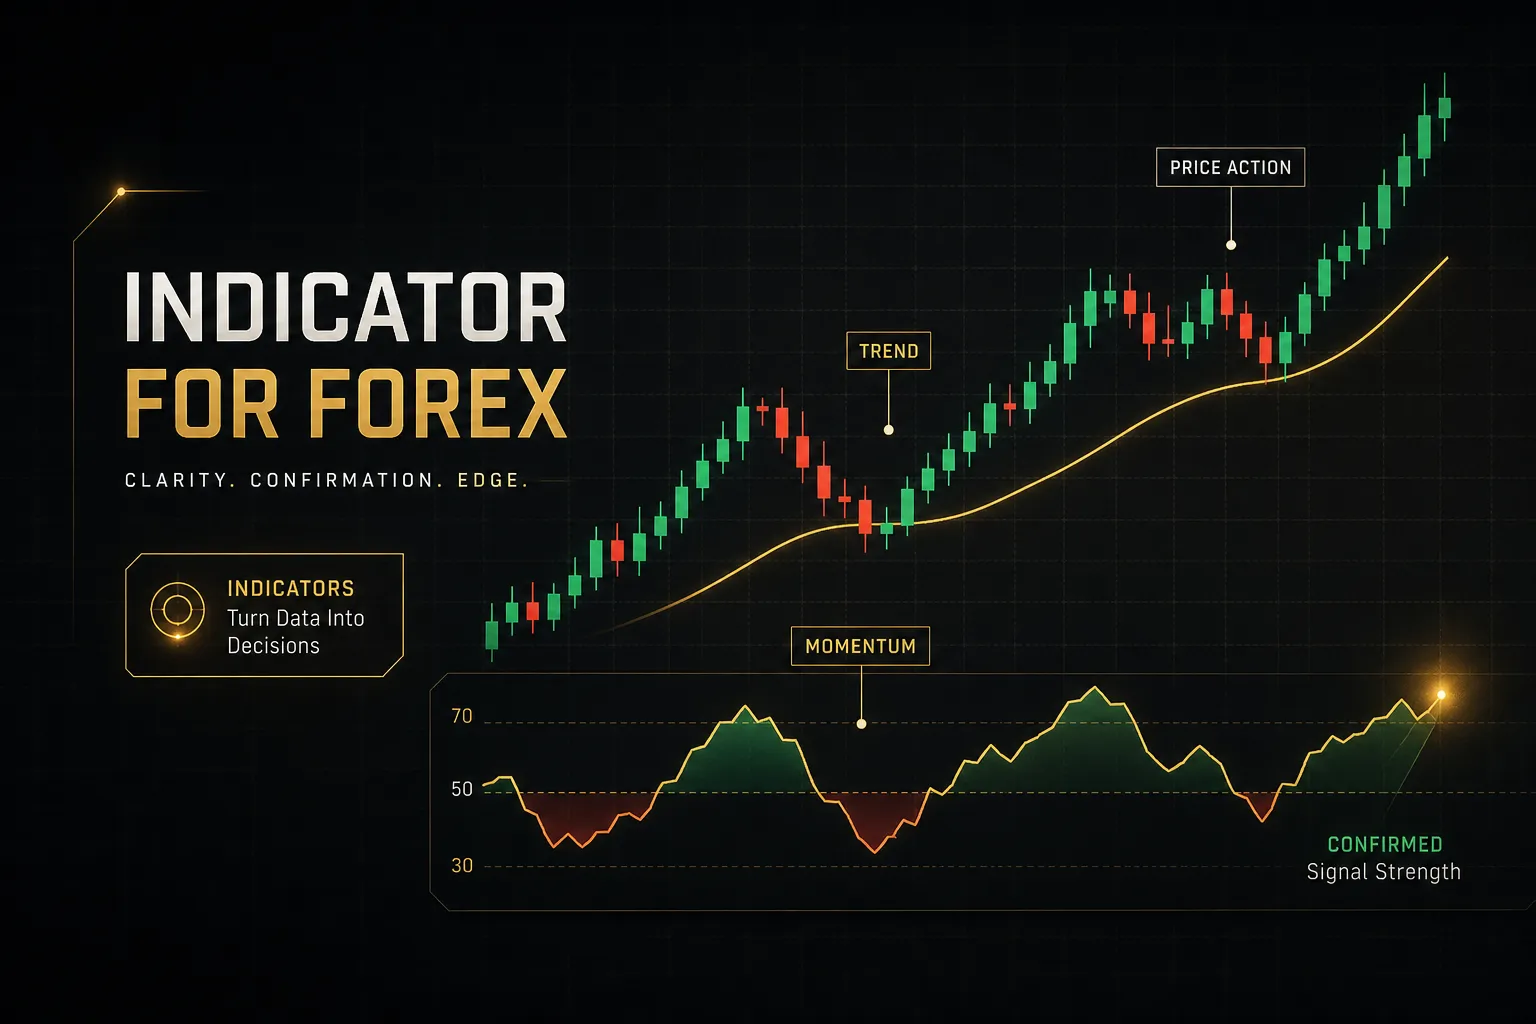
A forex indicator is a mathematical calculation applied to price (and sometimes volume) data, then plotted on or below your chart. It compresses raw price history into something readable: direction, momentum strength, entry timing, or how violently the market is moving.
That’s it.
No indicator predicts the future. It reorganises the past so you can make a decision faster.
And every trade you place, whether you’re scalping EUR/USD on the M5 or holding gold for three days, comes down to three questions.
Which direction am I trading?
Where exactly do I enter?
How long do I hold before I’m out?
Here’s where most traders go wrong. They answer question one with RSI, then “confirm” it with the stochastic oscillator, then add MACD for good measure.
Three tools.
All momentum oscillators.
All calculating slightly different versions of the same thing.
Three indicators from the same category don’t give you three opinions. They give you one opinion, repeated three times, in a louder voice.
That’s not confirmation.
That’s duplicated noise dressed up as consensus, and it’s the single fastest route to overtrading a bad signal.
This guide isn’t a ranking.
It’s a decision framework: how to identify what market condition you’re in, which category of tool actually applies, and how to combine two or three of them without accidentally building an echo chamber.
The “best” indicator is the one that answers a question your other tools aren’t already answering.
The Four Indicator Categories
Nearly every chart indicator you’ll encounter in technical analysis falls into one of four buckets. Learn the buckets and you’ll stop collecting tools at random.
Trend, Momentum, Volatility, Volume
Each category answers a fundamentally different question. Pick one from each, not four from one.
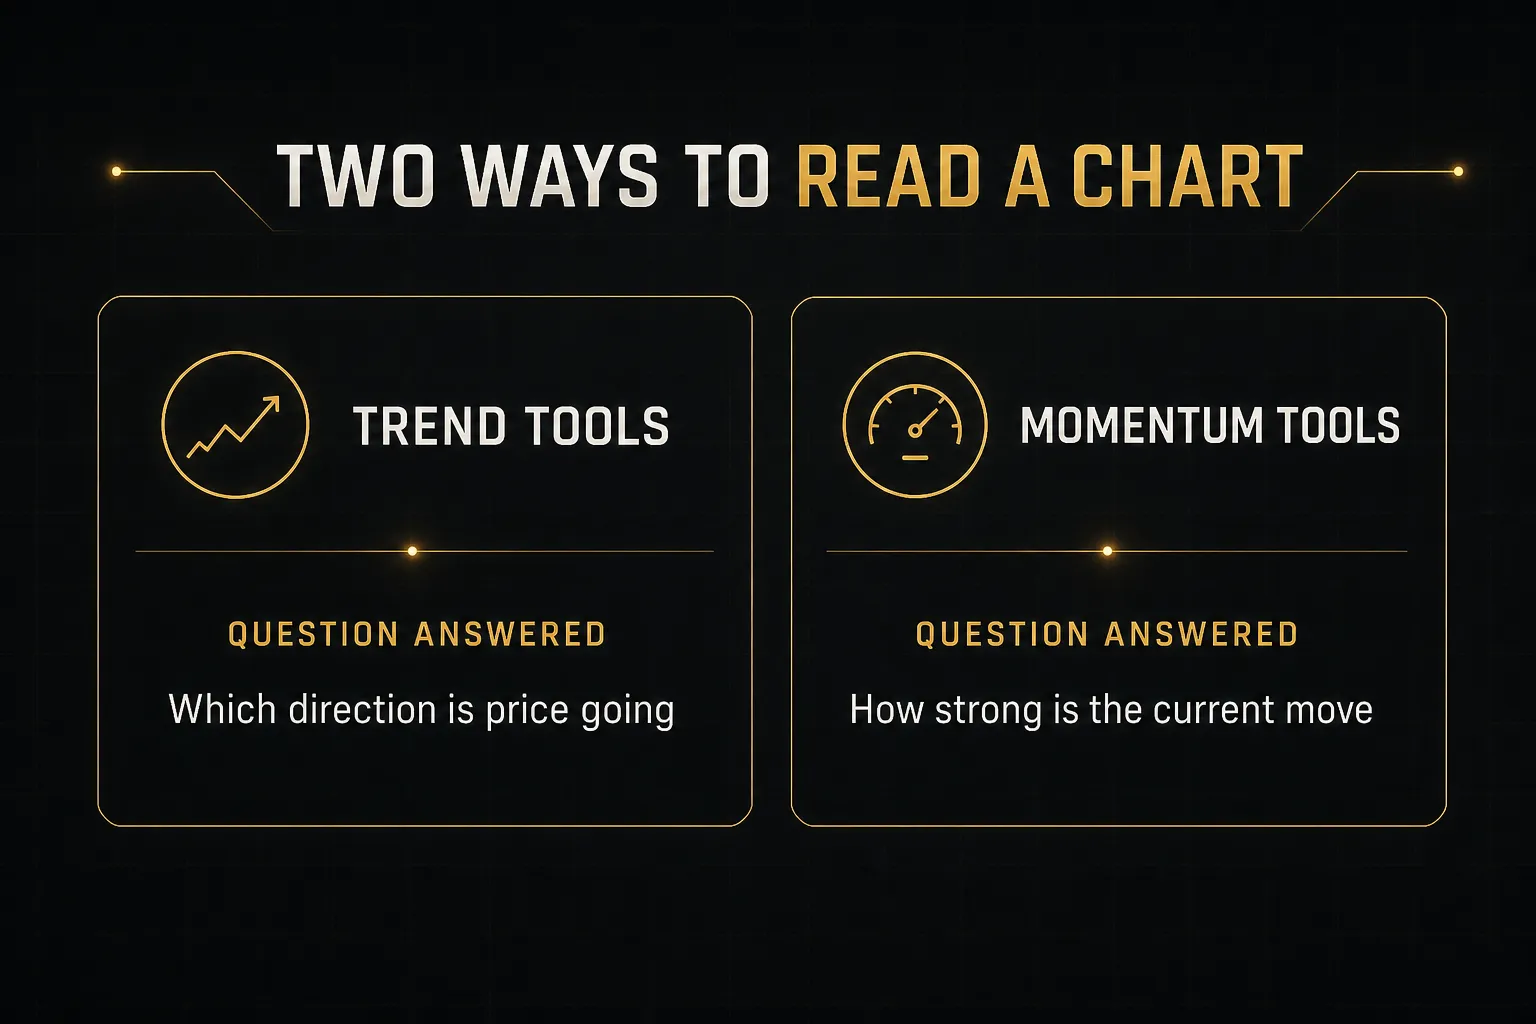
- Trend tools answer “which way is price moving?” The moving average family sits at the centre here. A simple moving average weights every candle equally, so it’s smoother and slower. An exponential moving average weights recent candles more heavily, so it reacts faster but whipsaws more in chop. The average directional index (ADX) is the odd one out: it measures trend strength without telling you direction, and readings above 25 typically signal a market worth trend-following.
- Momentum tools answer “how strong is this move, and is it fading?” The relative strength index (RSI) scores recent gains against recent losses on a 0 to 100 scale. MACD compares two EMAs to show acceleration and deceleration. The stochastic oscillator measures where the current close sits inside the recent high-low range. All three are useful. All three are cousins, and stacking them is redundancy, not evidence.
- Volatility tools answer “how much is price moving?” Note what’s missing: direction. The average true range (ATR) gives you the average distance price travels per candle, including gaps. Bollinger Bands wrap a moving average in standard deviation channels that expand and contract with market volatility. ATR is not a buy or sell trigger, and treating it as one is a category error. Its real job is stop distance and position sizing: if ATR on the H1 is 18 pips, a 5-pip stop is going to get eaten by normal noise.
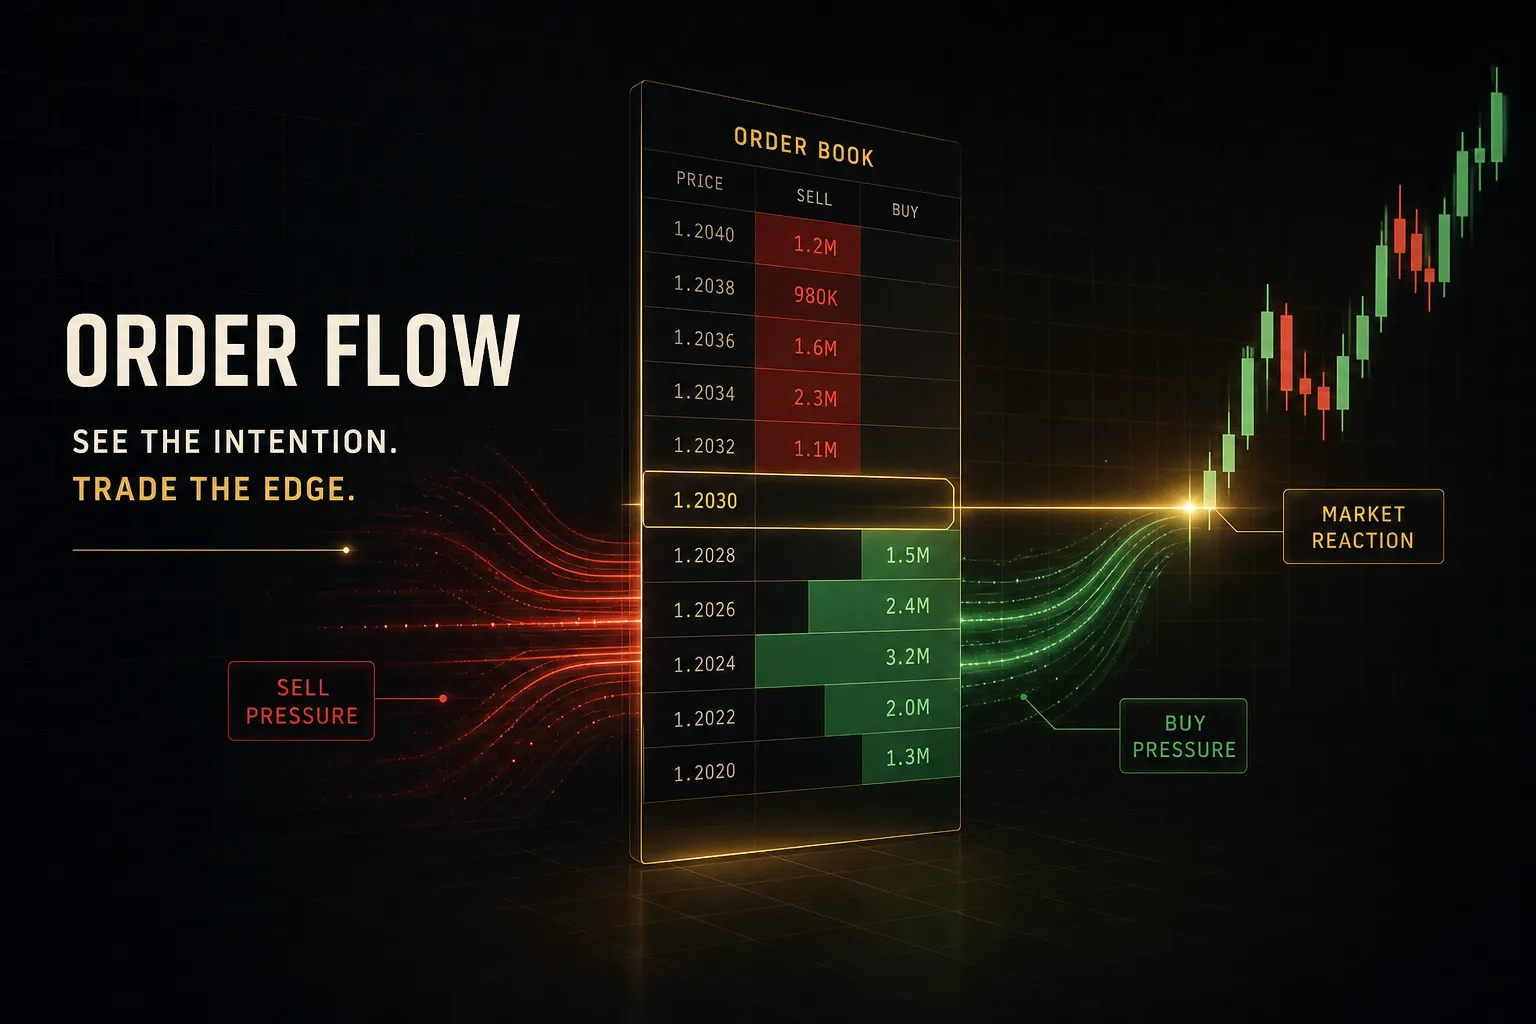
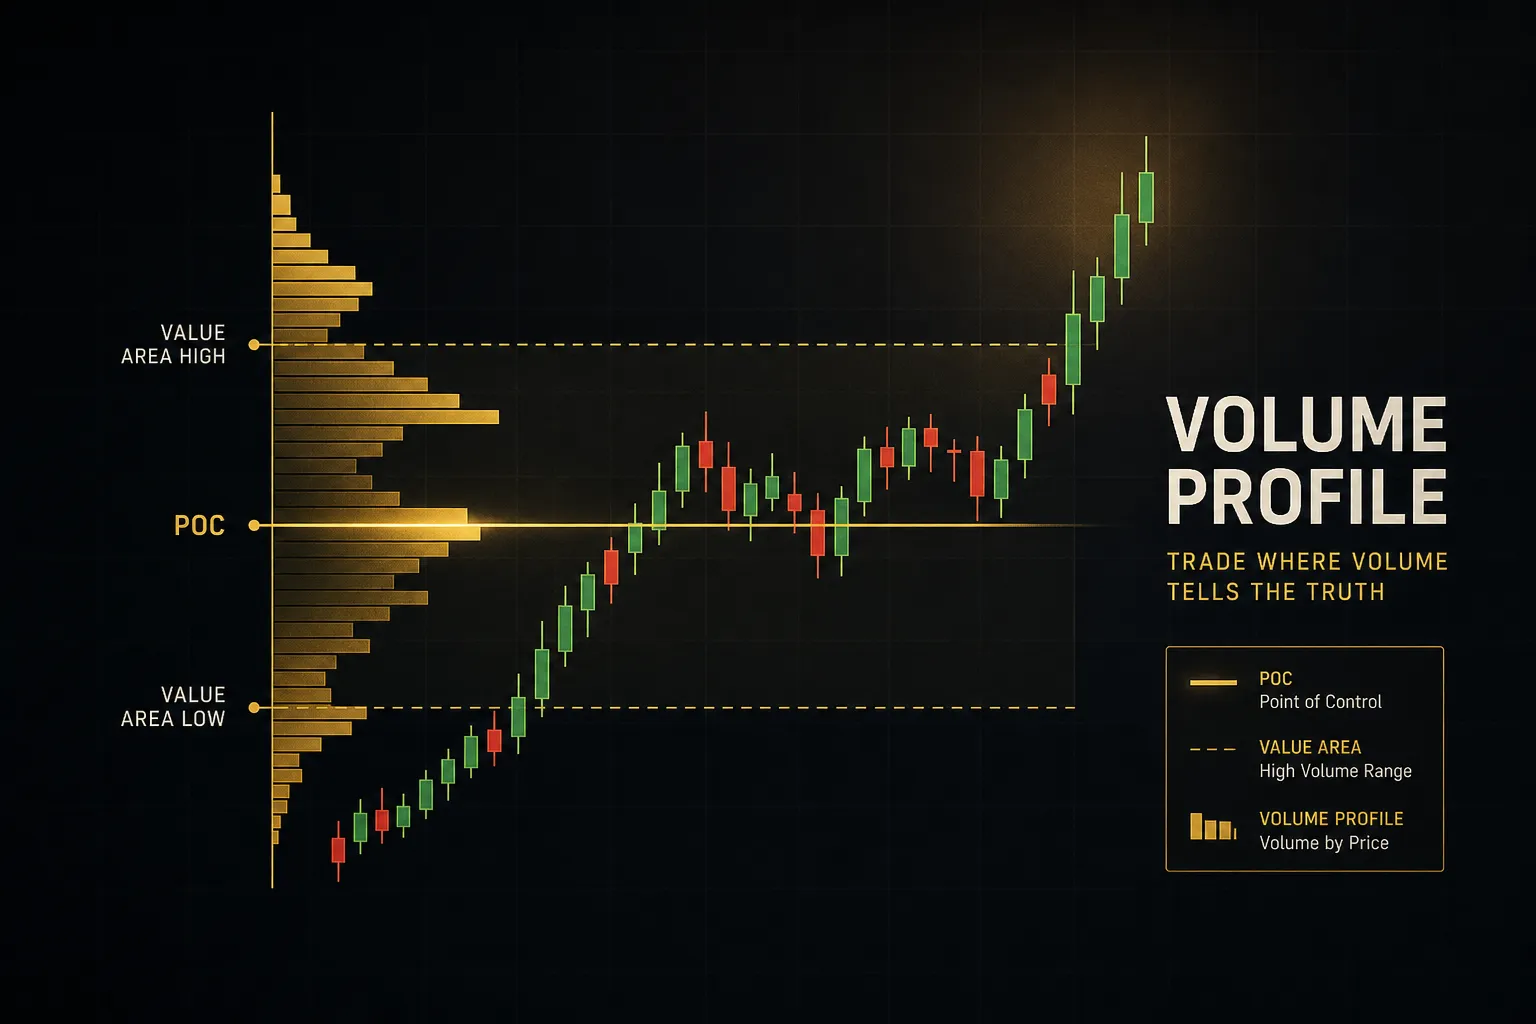
- Volume tools confirm participation behind a move. On-Balance Volume and Volume Profile show whether a breakout had real buyers behind it or was just thin-liquidity drift. The catch for forex: there is no centralised exchange, so retail platforms show tick volume (number of price changes) rather than true traded volume. It correlates reasonably well with real activity, but treat it as a rough proxy, not gospel.
Technical vs Economic Indicators
There’s a second meaning of “indicator” that trips up beginners, and ignoring it is expensive.
Economic indicators are scheduled data releases: CPI inflation prints, Non-Farm Payrolls, GDP revisions, central bank interest rate decisions, PMI surveys.
They are not calculated from your chart. They arrive at a fixed timestamp and move price instantly.
A perfect technical setup on GBP/USD means nothing at 13:30 GMT on NFP Friday. Spreads widen, liquidity vanishes for a few seconds, and price can travel 60 pips before your stop fills anywhere near where you asked.
Economic news overrides technical structure, full stop.
Check the calendar before you check your indicators.
Matching Indicators to Market Conditions
RSI hits 72 on USD/JPY.
Sell signal?
Not even close.
That’s the most costly misconception in retail trading, and it comes from applying a mean-reversion tool to a trending market.
Trending vs Ranging Markets
Overbought and oversold conditions are relative, not absolute. In a strong uptrend, RSI can sit above 70 for weeks while price grinds higher, because RSI measures recent momentum against recent momentum, and a persistent trend keeps resetting the baseline upward.
Traders who short every reading above 70 in a trend get run over repeatedly.
The 30/70 levels only carry predictive weight in a range, where price is oscillating between defined support and resistance. So the first job isn’t reading the oscillator.
It’s identifying which regime you’re in.
Two practical ways to do that.
First, ADX slope: a rising ADX above 25 says a trend is building and momentum tools should be used for pullback entries, not reversals. A falling ADX below 20 says the market is chopping, and mean-reversion logic applies.
Second, moving average separation.
If your 20 and 50 EMAs are fanned apart and both sloping the same way, that’s trend. If they’re tangled, crossing back and forth every few candles, that’s range.
Your eyes can do this in two seconds.
Indicator divergence (price making a higher high while RSI makes a lower high) is a genuinely useful signal, but it’s an early warning, not a trade trigger. Divergence can persist for a long time before price responds.
Wait for structure to break before acting on it.
Multi-Timeframe Alignment
Here’s a common trap. A trader takes a long signal on the M5, holds it, and watches it die at a level they never looked at.
The H4 was in a clean downtrend the whole time.
The fix is multi-timeframe analysis with a strict division of labour. Use a higher timeframe (H4 or Daily) to establish directional bias only. Use a lower timeframe (M15 or M5) to time the entry only.
Never let the M5 tell you which way to trade, and never let the Daily tell you exactly where to click.
Mix these jobs up and your signals will contradict each other constantly, because a 200-period average on the M5 and a 200-period average on the Daily are describing entirely different market events.
One more context point that gets ignored: settings are not universal.
A 14-period ATR on EUR/USD might read 8 pips on the H1. On GBP/JPY it could read 25. On XAU/USD, gold routinely moves multiples of that, with wider spreads to match.
Copying a “proven” RSI setting from a EUR/USD strategy onto gold and wondering why it fires constantly isn’t an indicator failure.
It’s a context failure. Same tool, different instrument volatility, different appropriate parameters.
Building a Non-Redundant Indicator Stack
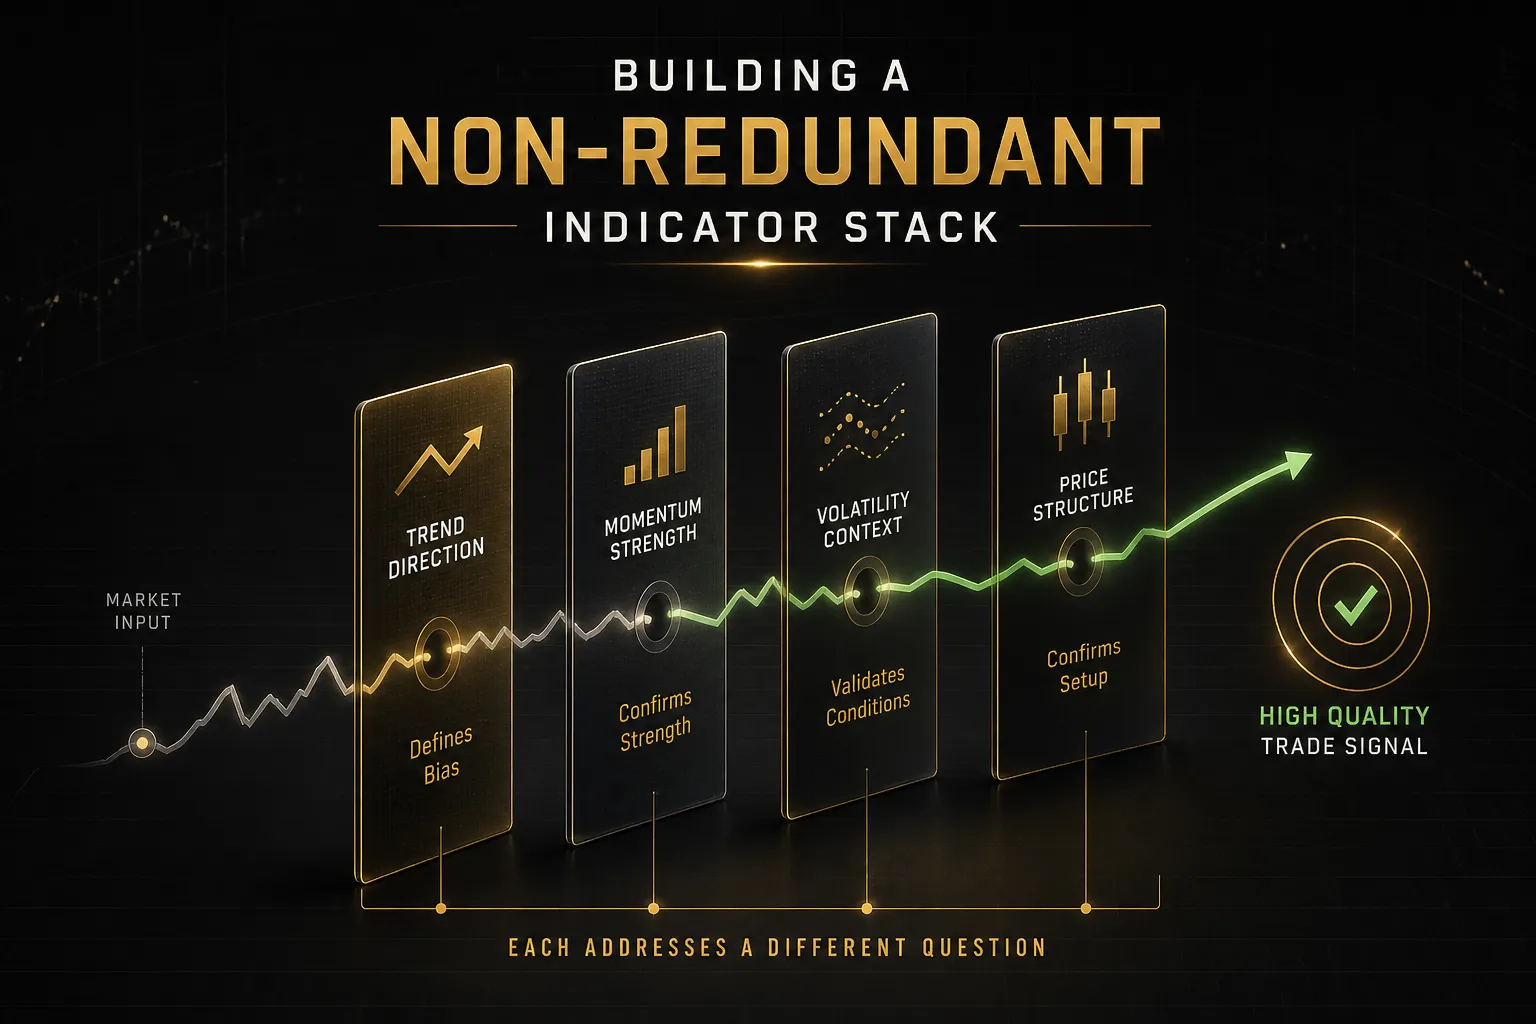
A workable stack has three or four components maximum, each drawn from a different category, each with a job the others don’t do.
Anything beyond that is decoration.
A Rules-Based Workflow
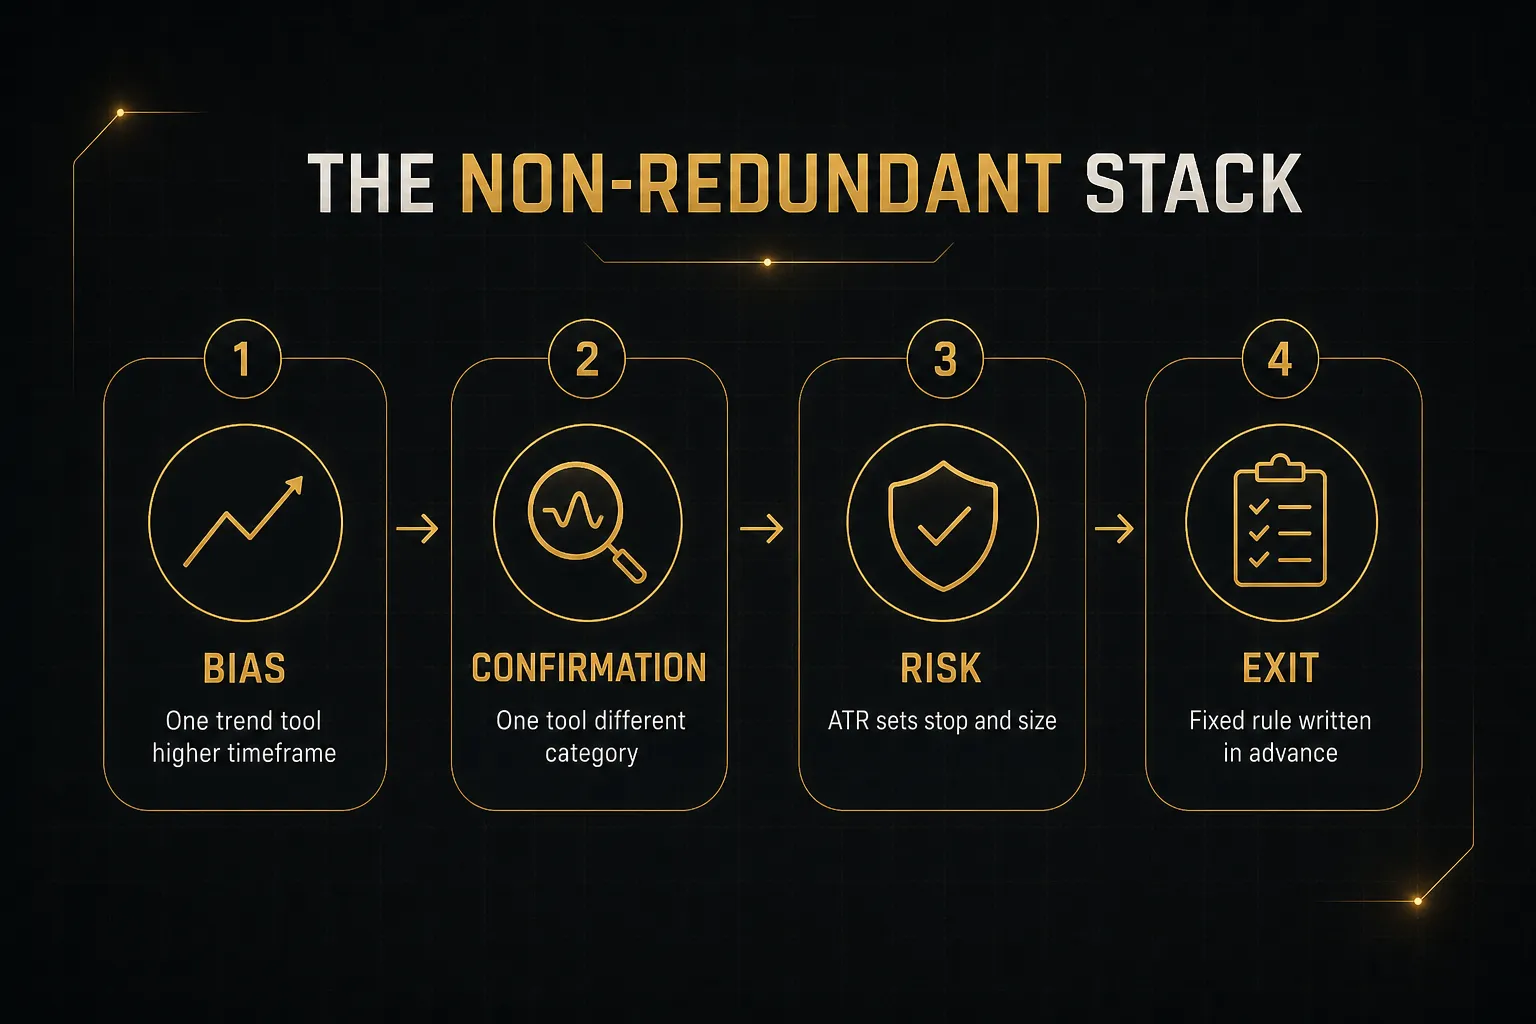
- Establish bias with one trend tool. Pick a single trend-following indicator on your higher timeframe, such as a 50 EMA on the H4, and decide one thing only: long-only, short-only, or stand aside. If price is above and the EMA is rising, you do not take shorts today. That constraint alone eliminates a large chunk of bad trades.
- Confirm with one tool from a different category. Now bring in momentum, and use it to time with the bias rather than against it. In an established uptrend, an RSI dip toward 40 and back up is a pullback entry, not a weakness signal. Do not add a second oscillator here. RSI plus stochastic tells you the same story twice and manufactures false confidence.
- Size the position with ATR. Read ATR on your entry timeframe and set your stop beyond normal noise, commonly 1.5 to 2x ATR from entry. Then calculate lot size so that distance equals a fixed percentage of your account, typically 0.5% to 1%. Your stop is now defined by market volatility, not by how much you feel like risking.
- Fix the target and exit rule before you enter. Decide the risk-to-reward ratio in advance, whether that’s a flat 1:2, a trailing stop behind swing structure, or a partial close at 1R. Write it down. The single largest source of inconsistent results is improvising exits while a position is open and your judgement is compromised.
- Log every trade against the rules. Record entry reason, whether all conditions were actually met, and outcome. After 30 trades you’ll know whether the strategy loses money or whether you lose money deviating from it. Those are very different problems with very different fixes.
Separating Signal From Entry
The deeper structural fix is to stop asking one indicator to do two jobs.
Most retail systems collapse direction and timing into a single arrow. Arrow appears, you buy.
But direction and timing operate on different logic, and merging them is why so many signals feel late.
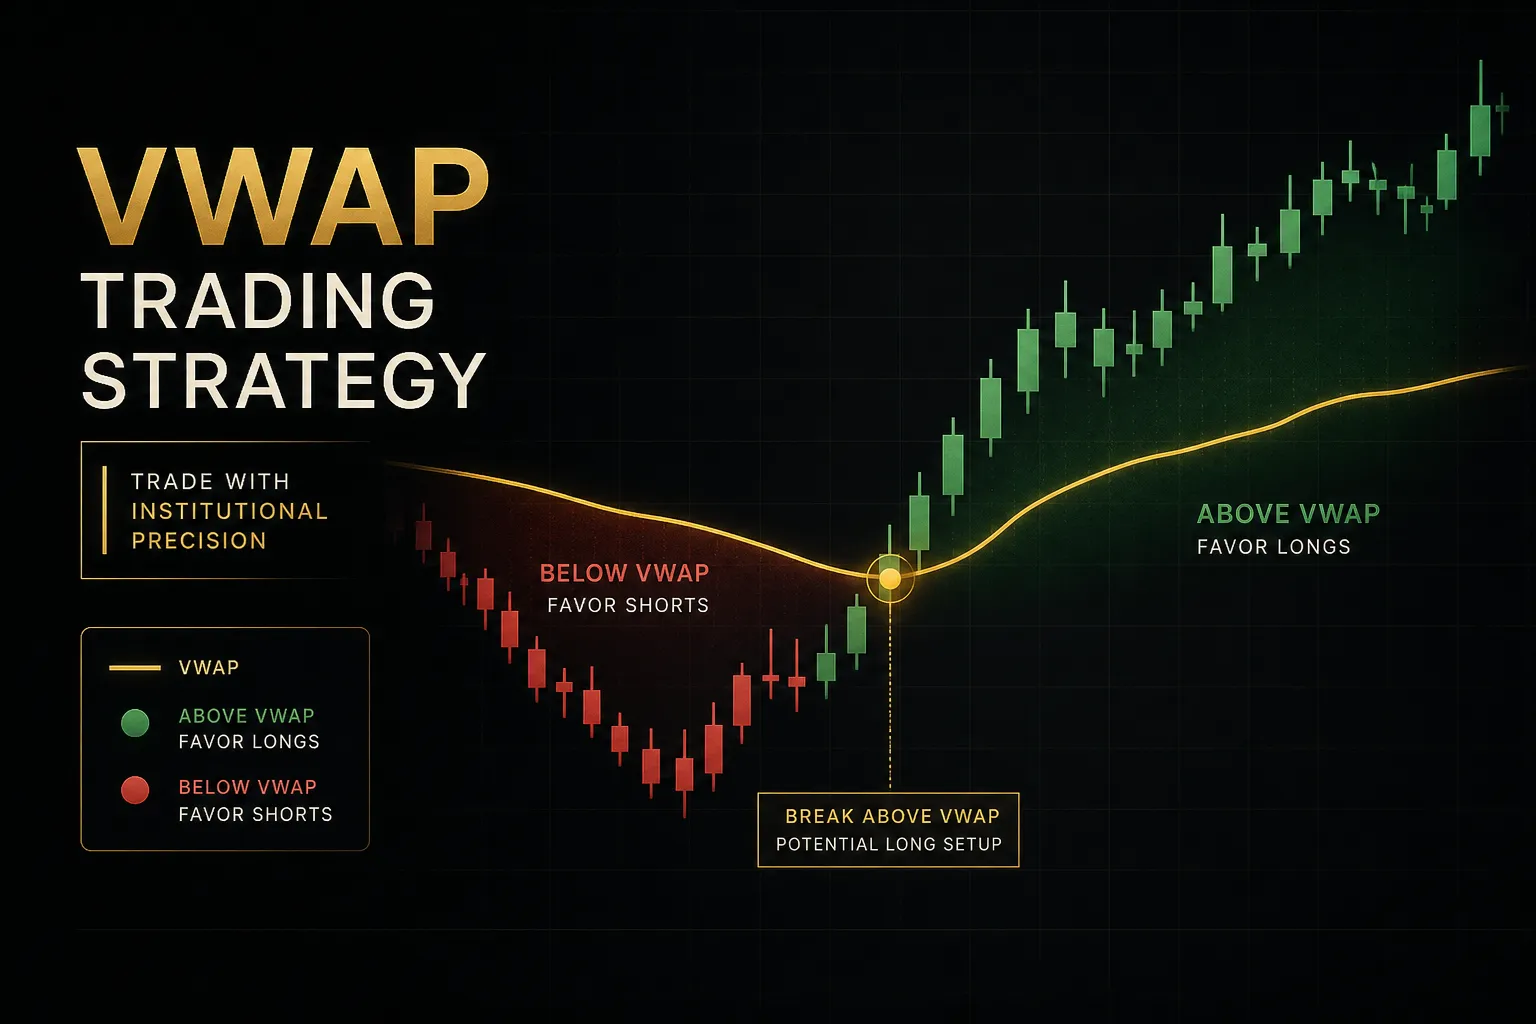
Platforms built around this separation handle it differently. PipTrend, for instance, delivers the directional call as colour-coded candles, a persistent read on which side of the market you should be on, then leaves the entry trigger to a separate layer: session highs and lows, VWAP, or marked supply and demand zones.
Bias says “we’re bullish today.” The entry layer says “here, at this level, is where the risk is defined.”
That split gives you something a single arrow can’t: the ability to skip a trade because the bias is right but the location is terrible.
The same principle extends to exits. A multi-timeframe confirmation table, showing whether M15, H1, H4 and Daily all agree at a glance, turns the hold-or-close decision into a rule instead of a feeling.
Full alignment across timeframes argues for holding through a pullback. Alignment breaking down on the higher timeframes argues for banking profit.
Bias, entry, exit: three decisions, three distinct inputs.
Can You Trust the Signal?
A signal that looked perfect in the backtest and evaporates in live trading usually isn’t a strategy problem.
It’s a measurement problem.
Repainting and Candle Close
There are two kinds of signal on any chart, and confusing them will destroy an otherwise sound system.
An intrabar signal is calculated on a candle that’s still forming. It’s live, it’s real, and it can vanish. Price ticks back the other way before close, the calculation updates, and the arrow that convinced you to enter is simply gone from the chart.
You’re left holding a position based on a signal that no longer exists.
A confirmed signal is one that survived the candle close. It’s slower, and you give up some of the move.
In exchange you get a signal that will still be there tomorrow.
Repainting is the more serious version of this problem. A repainting indicator retroactively redraws historical signals so that past performance looks far better than what a live trader could have achieved.
Scroll back and every arrow sits at a perfect turning point, because the indicator had the benefit of hindsight when it drew them.
A non-repainting signal locks once the candle closes and never moves again. Test for it directly: screenshot your live chart, come back a week later, and compare.
If the arrows have relocated, the historical results are fiction.
Candle-close confirmation is also your main defence against the false breakout, where price pierces a level, triggers a wave of entries, then closes back inside the range. Waiting for the close costs you a few pips of entry and saves you from a meaningful share of those traps.
Backtesting Without Fooling Yourself
Most retail backtesting proves nothing, because it’s twenty cherry-picked trades on a chart the trader has already seen.
Credible testing needs a few non-negotiables. A sample of at least 100 trades, because below that, variance swamps signal. An out-of-sample period the rules were never tuned on.
Then forward testing on demo or micro lots for several weeks, since live data arrives one candle at a time, exactly as it will when real money is at stake.
Calculate two numbers.
Trade expectancy is (win rate × average win) minus (loss rate × average loss), and it must be positive after costs. Maximum drawdown is the deepest peak-to-trough decline in the equity curve, and it tells you whether you could actually have sat through the bad stretch without abandoning the plan.
Guard against curve-fitting.
If a strategy only works with a 13-period RSI but collapses at 12 or 14, you’ve fitted noise.
Robust parameters degrade gracefully across a range of settings.
Then there’s friction, which quietly decides whether a marginally profitable system is actually profitable:
- Spread and slippage. A 1.2 pip spread against a 10 pip target consumes 12% of gross profit before you’ve done anything.
- Session liquidity. Spreads on the same pair can triple between the London open and the late Asian session.
- Rollover costs. Overnight financing accumulates on multi-day holds and can flip a small winner negative.
- Scheduled news. A backtest never shows the 30 seconds where your stop gapped through by 15 pips.
Frequently Asked Questions
What is the best indicator to use in forex?
There is no single best indicator, because indicators answer different questions and market conditions change which question matters.
A moving average is excellent for direction in a trending market and useless in a tight range. RSI is useful at range extremes and dangerous in a strong trend. Choose based on the category you need (trend, momentum, or volatility) and on whether the market is currently trending or ranging.
Which forex indicator gives the most accurate signals?
Accuracy depends entirely on the market condition the indicator was designed for, not on the indicator itself. ADX is highly reliable at identifying whether a trend exists, but it gives no entry signal at all.
Stochastic is reliable at range extremes and misleading in trends. A well-matched indicator on a confirmed candle close, filtered by higher-timeframe bias, will outperform any single tool used blindly.
What are the 3 best indicators for forex?
The most practical combination uses one tool from three different categories: a moving average for trend direction, RSI or MACD for momentum, and ATR for volatility-based stop placement and position sizing. This works because each answers a separate question with minimal overlap.
Combining three momentum oscillators instead gives you the same information three times, which feels like confirmation but adds no new evidence.
Is there a 100% accurate forex indicator?
No.
Every indicator is calculated from historical and current price data, so none of them can access information about future price movement. Any product advertising 100% or even 95% accuracy is either repainting historical signals, hiding losing trades, or counting a position as a “win” while it sits in deep unrealised drawdown.
Profitability comes from expectancy and risk control, not from win rate alone.
What indicator shows buy and sell signals in forex?
Moving average crossovers, MACD signal-line crossovers, and RSI level crosses all generate explicit buy and sell signals. So do the arrow-style tools and colour-coded candle systems built for retail platforms.
The important distinction is whether the signal is confirmed at candle close or still forming intrabar, since intrabar signals can disappear before the candle completes.
What is the best indicator for forex scalping?
Scalping needs minimal-lag tools, so fast exponential moving averages (5 to 20 period), VWAP, and short-period ATR are the usual choices. The bigger constraint is cost: with a 6 to 10 pip target, a 1.5 pip spread plus slippage can consume a quarter of your gross profit, so scalping only works on tight-spread pairs during high-liquidity sessions.
Confirm direction on the M15 and time entries on the M1 or M5, never the reverse.
The One Rule That Matters
Strip everything above down to a single operating principle: match the tool to the question, then stop adding tools.
If you’re starting out, run one trend indicator and one momentum indicator on the H4 or Daily.
Nothing else.
Trade that for two months before you even consider a third input. Higher timeframes give you fewer signals, cleaner price action, and far less pressure to react to noise.
And when your indicators disagree across timeframes? The answer is not to add a fourth indicator to break the tie.
Disagreement is the signal.
Reduce size or stand aside.
The market runs 24 hours a day, five days a week, and there is another setup coming.
One thing to do tonight.
Pick one pair.
Write your entry condition, stop rule and target rule on a single sheet of paper.
Then scroll back through the chart and manually work through 20 trades, recording each outcome honestly, before a single dollar goes live.
It’s tedious. It’s also the closest thing to a shortcut that exists.
Because the traders who last aren’t the ones who found a more accurate indicator. They’re the ones who built a repeatable process, waited for confirmed signals, sized every position the same way, and did that a thousand times without getting bored of it.
The edge was never in the tool.
Risk Disclaimer: Trading involves risk. Past performance doesn't guarantee future results. Only trade with money you can afford to lose. PipTrend is a tool to assist your trading decisions, not financial advice.