Parabolic SAR Explained: Reading the Dots Right
On this page
Getting Started With PSAR
Most traders learn the PSAR indicator backwards.
They see a dot flip from above price to below, they buy, and they wonder why the trade stopped out three candles later.
Here’s the correction that fixes most of that pain: the dots describe the current calculated trend state.
They do not forecast what price will do next.
A flip tells you the algorithm has switched sides, nothing more.
That distinction sounds academic until you count the losses. Traders who treat every flip as an automatic buy or sell signal end up feeding a whipsaw machine in sideways markets, where Parabolic SAR generates its worst signals.
This guide is for beginner and intermediate traders working in forex, stocks, futures, or crypto who want a repeatable process instead of blind signal-following. If you already run PSAR on a chart and feel like it works brilliantly half the time and terribly the other half, you are the target reader.
What follows: the real math behind each dot, including the acceleration factor and the two-period rule most tutorials skip.
Then the difference between a confirmed and a premature signal.
Then how PSAR behaves differently across market types and timeframes.
Finally, a complete confirmation workflow that pairs PSAR with directional bias and volatility context, plus the backtesting traps that make bad systems look profitable on paper.
How the Parabolic SAR Works
The indicator was designed in the 1970s to solve one specific problem: when do you get out of a winning trend trade?
Not when do you get in.
That framing explains almost everything odd about how it behaves.
What PSAR Stands For
PSAR stands for Parabolic Stop and Reverse, a trend-following indicator developed by J. Welles Wilder Jr. and published in his 1978 book New Concepts in Technical Trading Systems. The same book introduced RSI, ADX, and Average True Range, which is why those four tools pair so naturally.
The “parabolic” part refers to the curved path the dots trace as a trend extends. The “stop and reverse” part is literal: Wilder designed the system to always be in the market, flipping from long to short and back with no flat periods.
That original always-in design matters.
Wilder built PSAR for commodity futures in strongly trending markets, and he explicitly warned that the system performs poorly when a market lacks direction.
Fifty years on, that warning still holds.
The Calculation Behind Each Dot
Each dot is a running calculation, not a snapshot. The SAR formula for the next period is:
SAR(tomorrow) = SAR(today) + AF Ã, (EP − SAR(today))
Three components drive it.
The extreme point (EP) is the highest high reached during the current uptrend, or the lowest low during the current downtrend. It only updates when price makes a new extreme.
The acceleration factor (AF) starts at 0.02.
Every time price posts a new extreme point, the AF increases by another 0.02 step, and it keeps stepping up until it hits a maximum cap, typically 0.20.
That cap is the safety valve.
Without it, the acceleration factor would keep climbing and the dots would slam into price after a long trend, closing you out on the first minor pullback.
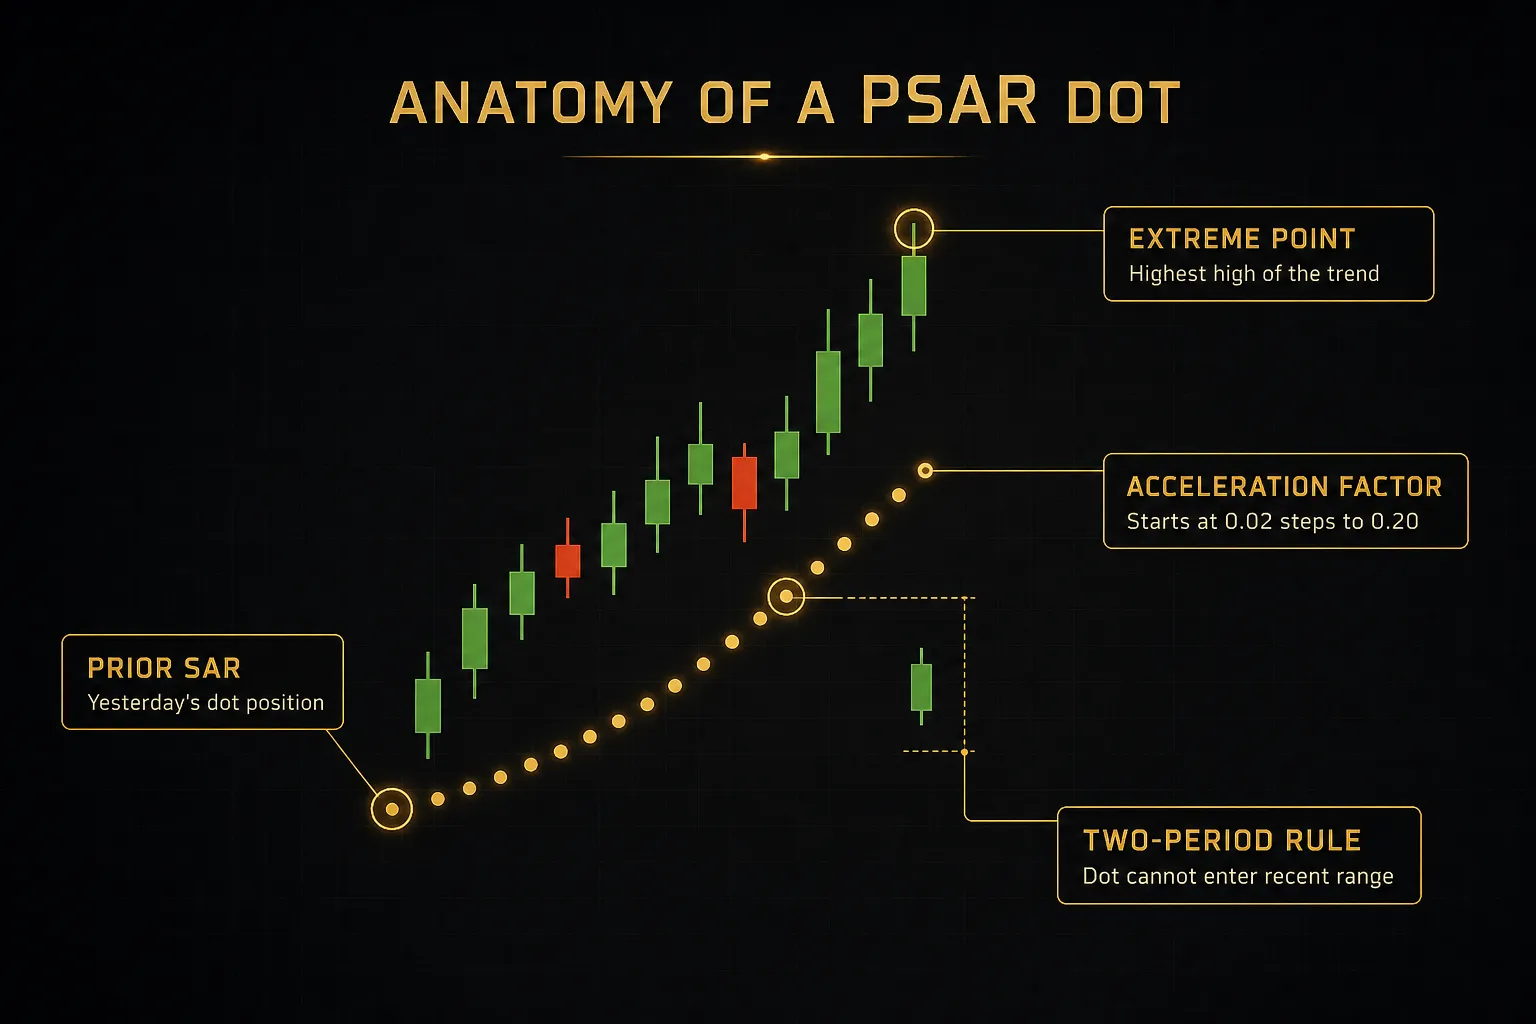
There is one more rule most tutorials skip, and it is the reason your dots look sensible instead of nonsensical. The SAR value can never be placed inside the price range of the previous two periods.
In an uptrend, if the calculation produces a SAR above the low of either of the last two candles, the indicator clamps it down to that lower low. In a downtrend, the reverse applies against the recent highs.
Why does this matter?
Without the clamp, a fast-accelerating AF could position tomorrow’s dot inside today’s candle body, which would trigger an instant reversal on totally normal price noise. The rule keeps dot placement realistic and gives trends a small amount of breathing room.
Reading Dots Above and Below Price
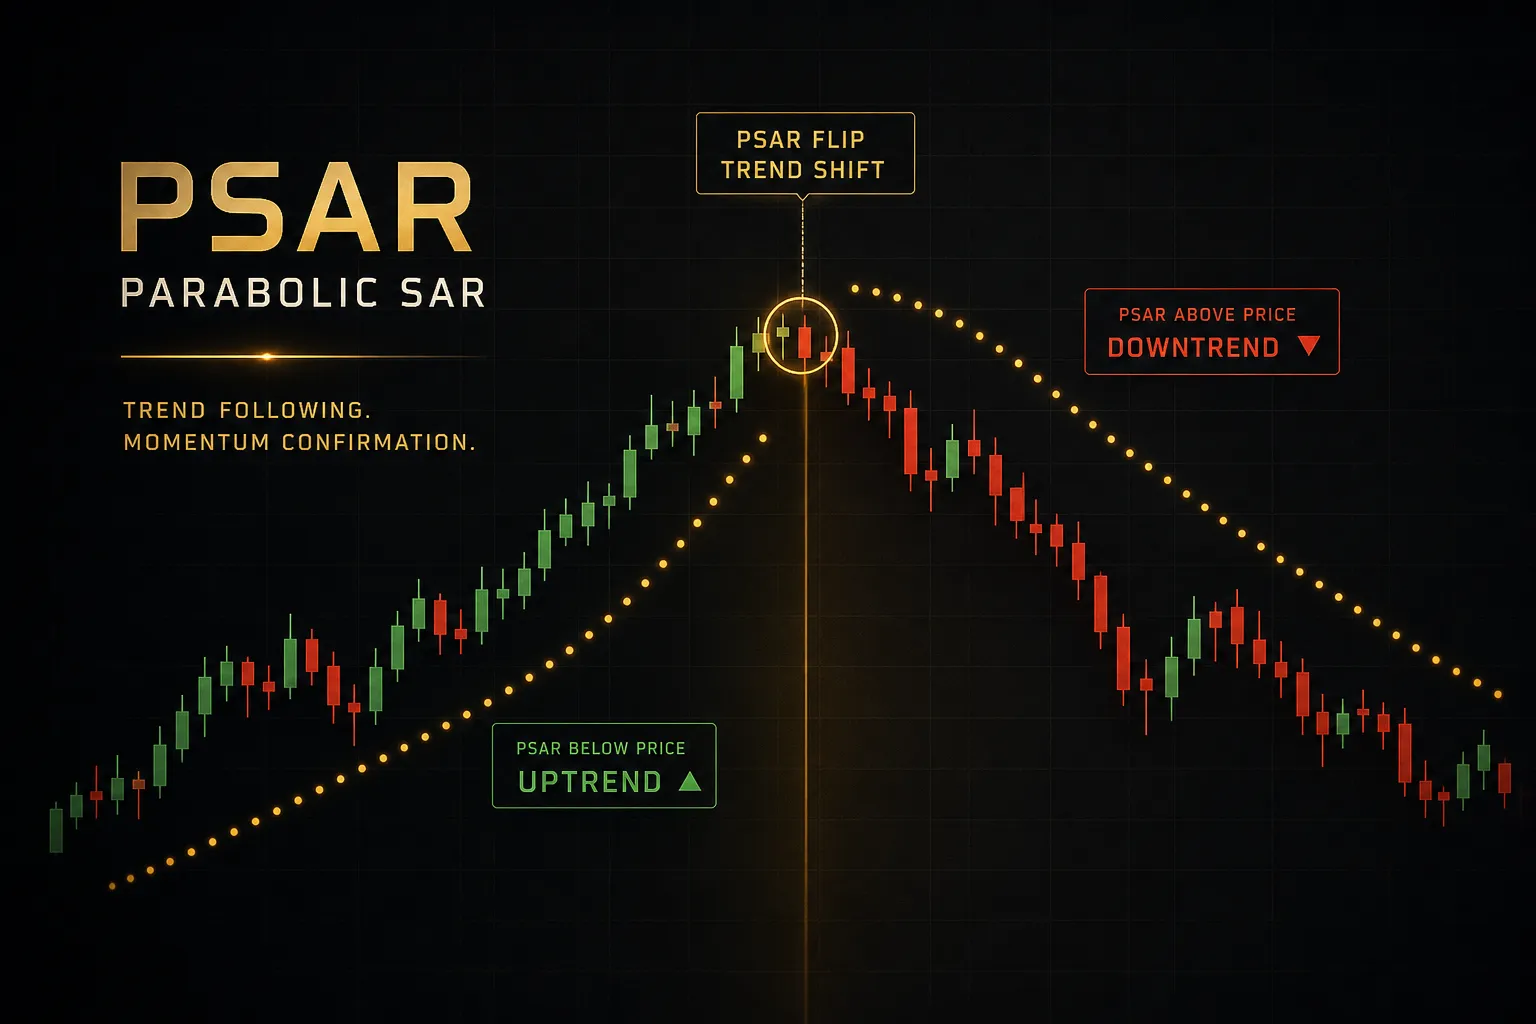
Dots below price mean the algorithm currently classifies the market as a bullish trend. Dots above price mean it classifies the market as a bearish trend.
That is the entire visual language.
Notice the tense.
Currently classifies.
The dot position reflects what has already happened to the extreme point and the acceleration factor, based on closed data. It contains no forward-looking component whatsoever.
Traders who internalise this stop asking “will the dot flip tomorrow?” and start asking a better question: “given the dots say uptrend, where does my risk sit right now?”
The dot value is a price level you can act on. The dot colour is context, not a crystal ball.
One practical read: the spacing between dots tells you about trend maturity.
Widely spaced dots that hug price tightly mean the AF has ramped up and the trend has been running a while. Loose dots far from price usually mean a fresh flip with a low acceleration factor.
Turning Dots Into Trade Signals
A flip is an event.
A trade is a decision.
Confusing the two costs more money than any other PSAR mistake.
Buy and Sell Signal Rules
The base logic is simple enough to state in one line.
When the dot moves from above price to below price, the indicator signals a potential long. When it moves from below to above, it signals a potential short.
Mechanically, the flip happens when price penetrates the current SAR value. At that moment the indicator resets: the new SAR becomes the prior trend’s extreme point, the acceleration factor drops back to 0.02, and the whole calculation restarts in the opposite direction.
That reset is the reason a fresh flip always has loose dot spacing. The trend has to earn its acceleration all over again.
Under Wilder’s original always-in-the-market design, a flip closes the old position and opens the new one simultaneously.
Almost nobody trades it that way today, and for good reason.
Being permanently exposed in a sideways market is a reliable way to bleed capital through spreads and small losses.
Why Candle Close Confirmation Matters
Here is where most retail traders lose money on an otherwise sound indicator. Intrabar, the SAR value is a moving target, and a wick that briefly pierces the dot can trigger a flip that vanishes before the candle closes.
Reacting to that intrabar cross means entering on noise. The dot reappears on its original side, your position is now wrong-footed, and you have paid the spread for nothing.
Waiting for the candle to close before acting on any flip eliminates a meaningful share of these false signals. On lower timeframes, where wick noise is proportionally larger, the improvement is substantial.
The trade-off is honest: you enter one full candle later, at a slightly worse price.
On a five-minute chart that costs you a few pips.
In exchange, you skip a large chunk of the whipsaw entries that make PSAR look unreliable.
Most platforms let you set alerts on bar close specifically.
Use that setting.
It is a one-click fix for a problem that costs traders real money.
Using PSAR as a Trailing Stop
Remember what Wilder actually built this for.
Exits.
As a trailing stop, PSAR is genuinely excellent.
The dot gives you a specific, objective, mechanically updated price level that ratchets in one direction only. It never moves against you, which removes the single most destructive discretionary habit: widening a stop to avoid taking a loss.
But there is a gap traders need to understand clearly.
PSAR does not predict the reversal price. It confirms the reversal after price has already moved against you.
Say a stock runs from $100 to $130 and then rolls over. Depending on how far the acceleration factor climbed, the dot might sit at $121.
You give back $9 of open profit before the flip confirms.
That is not a flaw.
That is the mechanical cost of every trailing stop. Loose enough to survive pullbacks means loose enough to give back profit on genuine reversals.
You cannot have one without the other.
So the honest summary: a dot flip alone is not a complete trade signal.
It is a state change.
Without directional bias and volatility context layered on top, you are trading a single input and calling it a system.
Settings That Change Everything
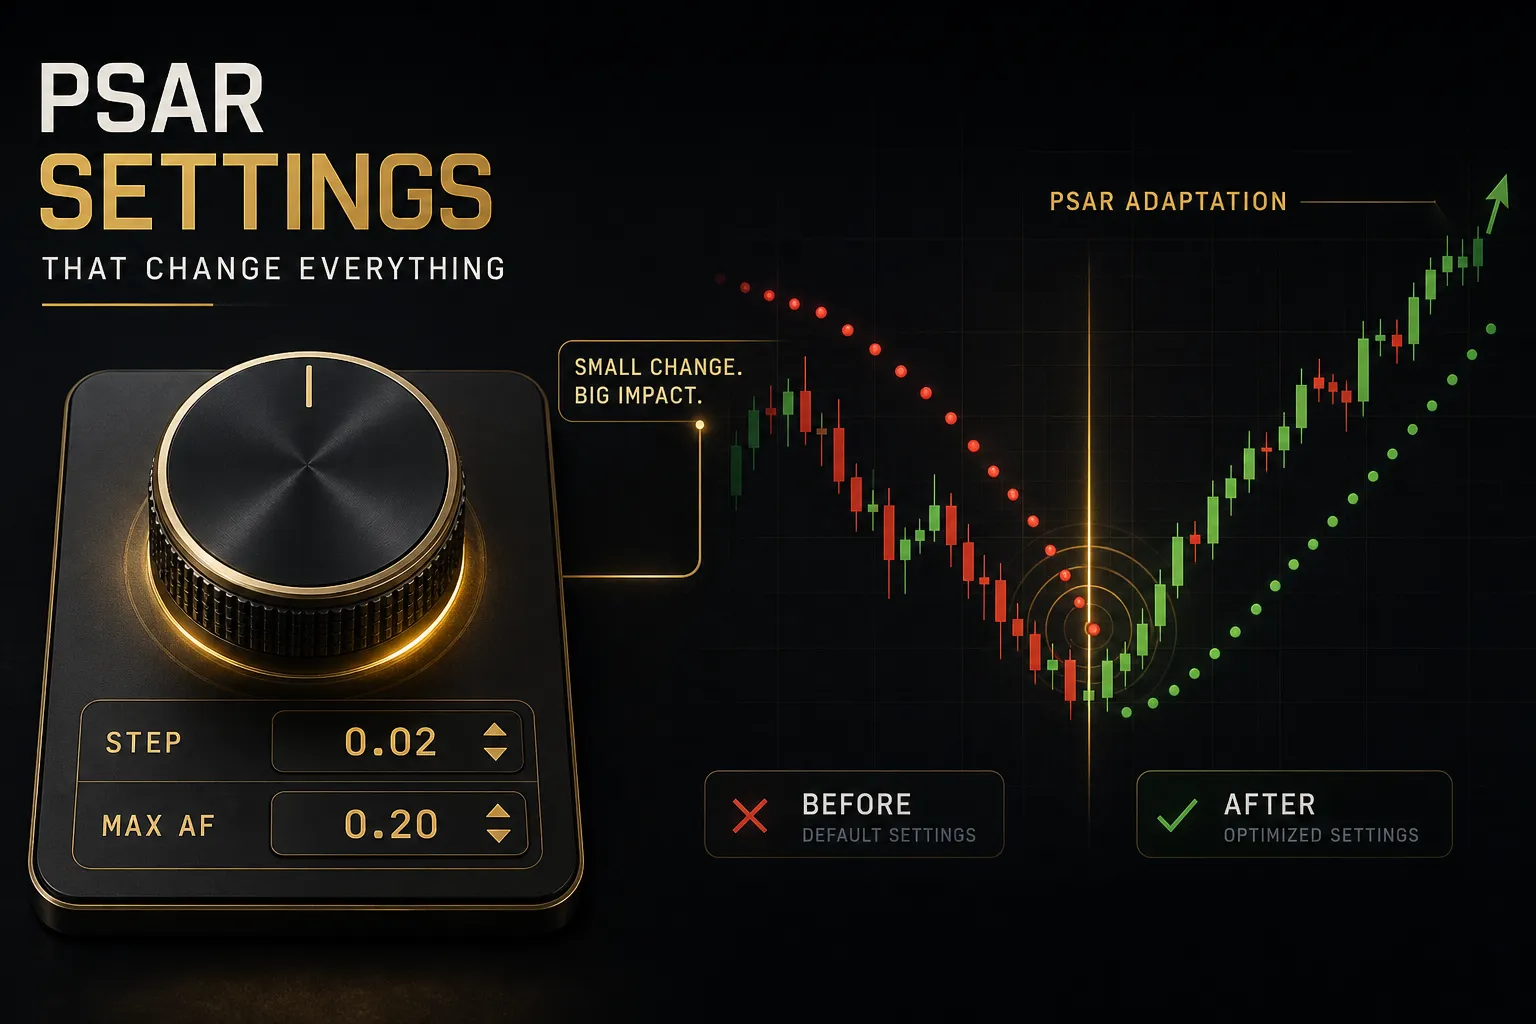
Change the acceleration factor step from 0.02 to 0.03 and you have effectively built a different indicator. Most traders never touch the defaults, then blame the tool.
Best Settings by Market and Style
The three inputs are start AF, step increment, and maximum AF.
Higher values make dots tighten faster, producing earlier flips and more of them. Lower values give trends more room and cut signal frequency.
Here is how the common configurations behave across market types and trading styles:
| Setting (Start / Step / Max) | Best Suited To | Signal Behaviour | Main Trade-Off |
|---|---|---|---|
| 0.02 / 0.02 / 0.20 (default) | Daily and H4 charts across all markets; the baseline for any backtest | Balanced; roughly 8 to 15 flips per 100 daily bars in mixed conditions | Too slow for scalping, too fast for multi-month position trades |
| 0.03 / 0.03 / 0.20 | Intraday day trading on M5 to M15 futures and index CFDs | Dots tighten roughly 50% faster; earlier exits on sharp intraday reversals | Noticeably more false signals during lunchtime and pre-news lulls |
| 0.01 / 0.01 / 0.10 | Swing forex on H4 and daily; crypto positions held over multiple days | Wide trailing stop; may hold a single trend for 30+ bars without flipping | Gives back a large share of open profit before confirming a reversal |
| 0.02 / 0.02 / 0.10 | Equities on daily charts where overnight gaps are common | Standard tightening but a capped ceiling, so dots never crowd price | Slower to exit blow-off tops in high-momentum growth names |
| 0.02 / 0.02 / 0.30 | Crypto majors during high-volatility regimes on H1 and H4 | Aggressive lock-in once a parabolic move extends | Frequently exits strong trends at the first deep retracement |
Market structure changes the picture too.
Forex runs on session rhythm, so PSAR flips during the thin Asian range on a EUR pair carry far less weight than flips during the London open.
Equities gap.
An overnight gap through the dot produces a flip at a price you could never have been filled at, which quietly inflates every backtest that ignores it.
Crypto trades 24/7 with no session close, so dots keep updating through hours of thin weekend liquidity.
Futures concentrate meaningful movement in liquidity windows around the cash open and economic releases, and flips outside those windows are worth discounting.
Why PSAR Struggles in Ranges
The failure mode is structural, not fixable with settings. In a range, price oscillates between two boundaries, which means it repeatedly crosses whatever level the SAR calculation has produced.
Each cross triggers a flip.
Each flip resets the acceleration factor to 0.02 and places the new dot at the prior extreme, which sits inside the range. Price then travels back across it within a few bars.
The result is a run of small losses, each one costing the spread plus a portion of the range width. In a tight consolidation on an intraday chart, five or six consecutive losing flips is common.
Risk-reward makes it worse.
Range trades have capped upside by definition, so even the winning flips return little, while the losers pay full freight. That asymmetry is why false signals in low-volatility conditions do disproportionate damage.
Adding a Higher-Timeframe Filter
The cheapest fix costs nothing and takes ten seconds. Before acting on a PSAR flip, check the trend on a higher timeframe.
The standard pairing is a factor of four to six.
Filter M15 signals with H1 or H4.
Filter H1 signals with the daily.
Filter daily signals with the weekly.
The rule is one line: only take flips that agree with the higher-timeframe direction. If the daily PSAR shows dots below price and the daily is above its 50-period moving average, you take long flips on H1 and ignore the short flips entirely.
You will cut your trade count roughly in half.
You will also remove most of the range-bound flips, because a market chopping on H1 usually shows no clean higher-timeframe direction at all, which the filter reads as “stand aside.”
Building a Complete PSAR System
A single indicator answers one question.
Trading requires answers to three: which direction, is the trend strong enough, and how much room does price need.
PSAR alone answers the first, poorly.
A Confirmation Workflow With MA, ADX, ATR
The three-part stack below is deliberately boring.
Each tool covers a specific blind spot in the others.
Layer one is directional bias via moving average confirmation.
A 50-period or 200-period moving average on your trading timeframe answers a question PSAR cannot: is this trend part of a larger move, or a counter-trend bounce? Take long flips only when price sits above the MA, short flips only below.
Layer two is trend strength via ADX. Wilder built ADX in the same 1978 book, and it exists precisely to solve PSAR’s ranging problem.
ADX trend strength above roughly 25 indicates a directional market; below 20 indicates a range where PSAR flips should be ignored.
This single filter removes most of the whipsaw trades. It is not perfect (ADX lags, and it rises during strong moves in either direction), but as a binary “trade or stand aside” gate it earns its screen space.
Layer three is volatility context via average true range.
ATR tells you how much a market typically moves per bar, which turns an abstract dot into a sizing decision.
If the current dot sits 1.2 ATR below price, that is a reasonable stop distance. If it sits 4 ATR away because the flip just reset, the risk is too large for a standard position and you either size down or wait for the dots to tighten.
Doing this manually across every pair and timeframe is where discipline breaks down.
Automated systems operationalise the same logic at scale. PipTrend, for example, runs a multi-timeframe table that reads trend state across 12 timeframes simultaneously and applies a whipsaw filter, so instead of judging a single dot flip in isolation you see whether the flip agrees with the broader structure before you click.
The tooling is not the point.
The confluence discipline is.
Whether you check three timeframes by hand or read a dashboard, the requirement is the same: never act on one input.
Backtesting Without Fooling Yourself
Most PSAR backtests are fiction.
Not because the coder was dishonest, but because four specific errors are easy to make and hard to spot.
- Look-ahead bias. Using the current bar’s SAR value to enter on the current bar’s open is physically impossible, since the value depends on that bar’s high or low. Always shift signals forward by one bar.
- Survivorship bias. Backtesting PSAR on today’s index constituents ignores every company that got delisted. Trend systems look far better on a universe of survivors.
- Unrealistic fills. Assuming you exit exactly at the dot value on a gap-down open is fantasy. Model gap fills at the actual open price, not the stop level.
- Ignoring costs. Spreads, commissions, slippage, and overnight financing. A strategy averaging 12 pips per trade dies instantly under a 2-pip spread and 1-pip slippage across 300 trades.
One more habit worth building: test across at least two distinct market regimes. A PSAR system tested only on 2020 to 2021 crypto data will look extraordinary and then fail the moment conditions turn choppy.
Split your data.
Optimise on the first 70%, validate on the untouched remaining 30%. If performance collapses out of sample, you curve-fitted the acceleration factor rather than finding an edge.
Troubleshooting Common PSAR Problems
Four issues account for the majority of support questions about the PSAR indicator.
Contradictory signals between indicators. PSAR flips long while ADX sits at 15 and price is below the 200 MA.
This is not a malfunction, it is the system correctly telling you to stand aside.
Rank your inputs in advance: trend filter first, strength filter second, PSAR flip last as the timing trigger.
Delayed or missing dots. Most platforms omit the first dot of a new trend or hide dots during the initialisation period, since the calculation needs prior data to seed the extreme point.
On very short data histories, expect the first several bars to be unreliable.
Unusual acceleration factor values. If dots seem to accelerate impossibly fast, check whether your platform increments the AF on every new extreme or only on the close of a new extreme.
That single implementation detail changes dot placement, and it varies between vendors.
Platform differences. TradingView, MT4, and MT5 can all produce slightly different dot positions on the same chart.
The common causes are differing treatment of the two-period clamp rule, different handling of the first bar, and different underlying price feeds with different session boundaries.
None of these gaps are large enough to invalidate the indicator. But they are large enough to break a backtest built on one platform and traded on another.
Test where you trade.
PSAR Questions Traders Ask
Is PSAR a good indicator?
PSAR is a good trailing-stop and trend-confirmation tool, and a poor standalone entry signal. It performs strongly in sustained directional moves, where the accelerating dots lock in profit mechanically without any discretionary judgement.
In ranging or low-volatility conditions it produces frequent false signals and negative expectancy. Judge it by the job Wilder designed it for: managing exits inside a trend you have already identified by other means.
What is the best setting for the PSAR indicator?
The default 0.02 start, 0.02 step, 0.20 maximum remains the best general-purpose setting and the correct baseline for any backtest. Wilder tested it extensively on commodity futures, and it holds up across most liquid markets on daily and H4 charts.
Day traders on M5 to M15 often prefer a 0.03 step for earlier exits, accepting more noise. Swing traders and crypto position holders frequently drop to a 0.01 step with a 0.10 cap for a wider trailing stop.
Change one variable at a time and validate out of sample.
How accurate is the Parabolic SAR indicator?
PSAR has no fixed accuracy rate, because its performance depends almost entirely on market regime. In strongly trending conditions with ADX above 25, a majority of flips capture the move; in consolidation with ADX below 20, the same settings can produce five or six consecutive losers.
Raw win rate is also the wrong metric for a trend-following indicator. A system winning 40% of trades can be highly profitable if the winners run several times the size of the losers, which is exactly what a trailing stop is built to produce.
What is the difference between PSAR and Supertrend?
PSAR accelerates over time based on new extreme points, while Supertrend sets its bands using a multiple of average true range. That means PSAR tightens the longer a trend runs, whereas Supertrend widens or narrows with volatility regardless of trend age.
Practically, PSAR exits mature trends sooner and suits traders who prioritise locking in profit. Supertrend gives volatile markets more room and produces fewer signals, which suits swing traders holding through deep retracements.
Neither is superior; they solve different problems.
Which indicator works best with Parabolic SAR?
ADX is the strongest single partner for PSAR, because it directly filters the ranging conditions where PSAR fails. Wilder designed both indicators in the same framework, and requiring ADX above 25 before acting on a flip removes most whipsaw trades.
Beyond that, a 50 or 200-period moving average supplies directional bias, and ATR converts the dot distance into a position-sizing decision. The three together cover direction, strength, and volatility.
How do you use Parabolic SAR for stop loss?
Place your stop-loss order at the current dot value and move it to each new dot as price trends in your favour. Because the SAR only ratchets in one direction, this enforces a stop that never widens, which removes the most common discretionary error.
Two cautions.
On fast moves and gap opens, slippage means your actual fill can be materially worse than the dot value, so size positions assuming a worse exit. And after a fresh flip the dot sits far from price, so check the distance in ATR terms before committing full size.
Making PSAR Work for You
The decision rule fits in one sentence.
Use PSAR as a trailing stop and trend-confirmation tool inside trends you have already identified, and never as a standalone entry trigger in flat or choppy conditions.
Everything in this guide supports that one line.
The acceleration factor mechanics, the two-period clamp, the candle-close rule, the ADX gate, the higher-timeframe filter. All of it exists to keep you from trading dots in a vacuum.
Here is your next action, and it takes under a minute. Before you act on the next flip on your chart, check two things: is ADX above 25, and does the higher timeframe agree with the direction of the flip?
If either answer is no, skip the trade.
Do that consistently for a month and count how many losing trades you avoided.
One last honest note.
No indicator, PSAR included, removes market risk, execution risk, or the need for disciplined position sizing.
The dots give you structure.
What you do with it is still your call.
Sources
Risk Disclaimer: Trading involves risk. Past performance doesn't guarantee future results. Only trade with money you can afford to lose. PipTrend is a tool to assist your trading decisions, not financial advice.