On this page
What MACD can and can’t tell you
Most traders who give up on MACD never had a MACD problem. They had a plan problem.
They bought every bullish cross, sold every bearish one, and watched choppy markets eat their account one small loss at a time.
Moving average convergence divergence (MACD) is a momentum and trend-timing tool. It tells you whether short-term momentum is speeding up or slowing down relative to a longer baseline.
It does not predict where price will go next, and it knows nothing about support levels, news events, or your account size.
That distinction matters.
An indicator reading is one input. A trading plan is a full set of rules covering when to enter, when you’re wrong, where your stop goes, how much you risk, and when you take profit.
A MACD crossover is a question, not an answer. The rest of your strategy exists to decide whether that question deserves a trade.
This guide builds a MACD strategy from six parts working together:
Trend context tells you which direction to favor. Market regime tells you whether MACD signals are worth trading at all right now.
Price structure and confirmation filter out weak entries, while risk management and backtesting keep the whole system honest.
You won’t find another generic definition followed by “buy when the lines cross.” Instead, you’ll get testable entry rules, invalidation criteria, stop-loss placement methods, and exit logic you can write down and backtest as of 2026 on any charting platform.
MACD line, signal line, and histogram
Gerald Appel built MACD in the late 1970s using nothing more than two moving averages and some subtraction. Thomas Aspray added the histogram in 1986.
Nearly five decades later, those same three components still do all the work, so understanding each one precisely is the foundation of everything that follows.
The MACD and signal lines
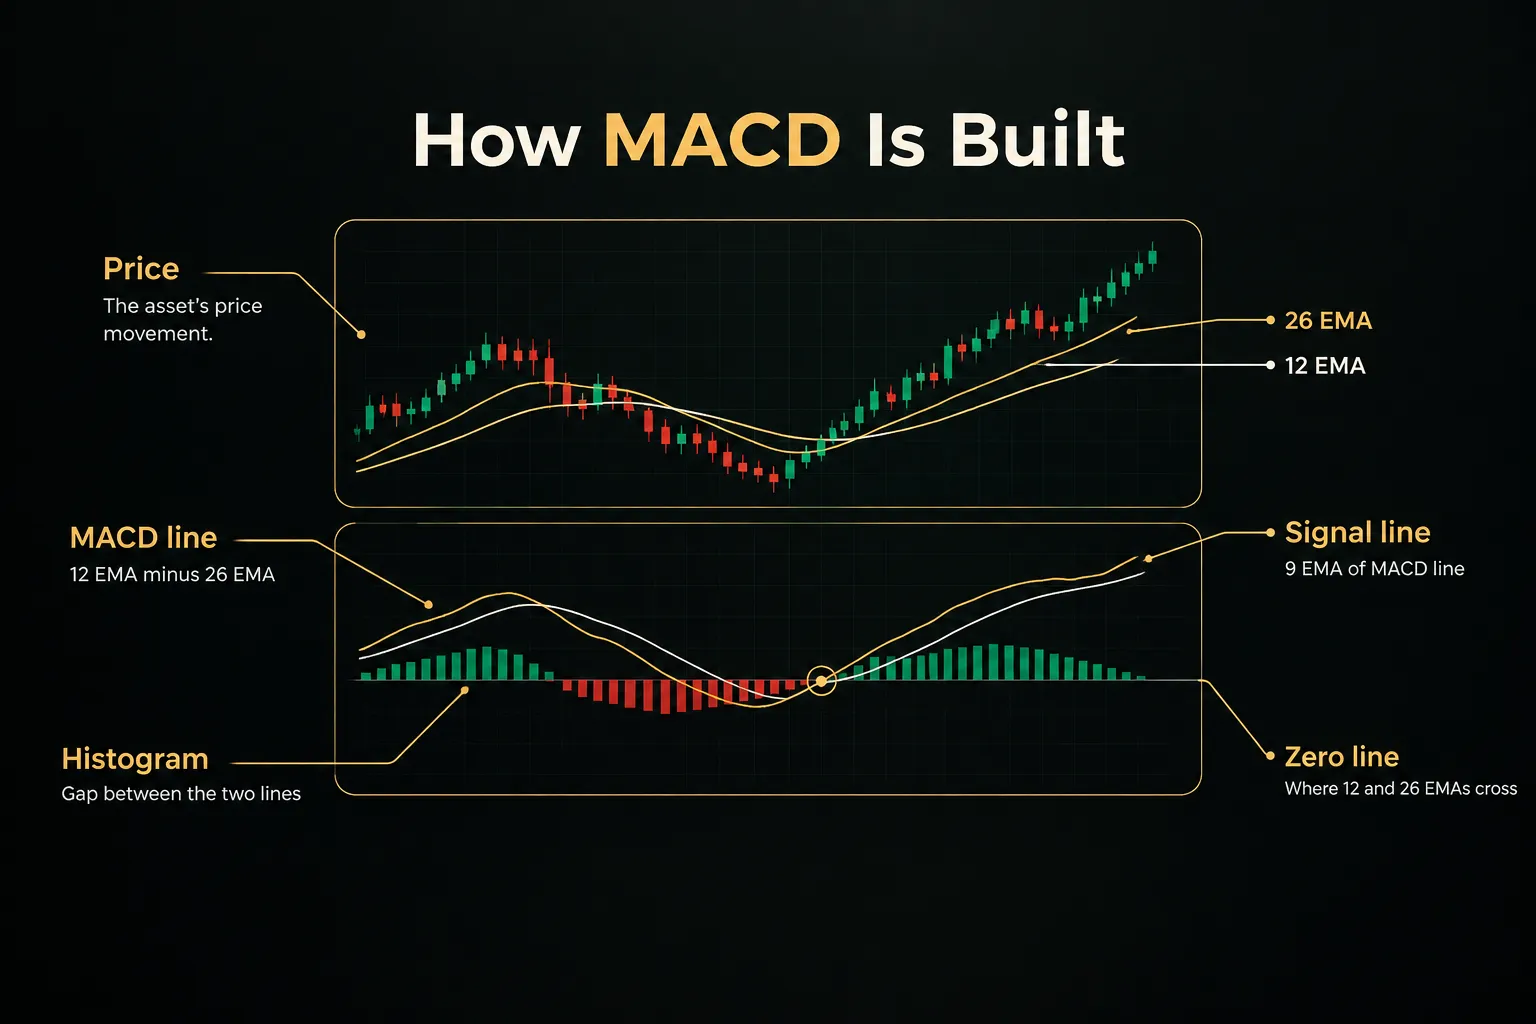
The MACD line is the 12-period exponential moving average (EMA) minus the 26-period EMA. When the faster average pulls away from the slower one, the MACD line moves further from zero.
When they converge, it moves back toward zero.
The signal line is a 9-period EMA of the MACD line itself. Think of it as a moving average of momentum.
Because it smooths the MACD line, it lags slightly behind, and that lag is what creates the familiar signal-line crossover.
Here’s an analogy.
The MACD line is your car’s speedometer reading. The signal line is your average speed over the last few minutes.
When your current speed drops below your recent average, you’re decelerating, even if you’re still moving forward.
The histogram’s early warning role
The MACD histogram plots the distance between the MACD line and the signal line. Positive bars mean the MACD line sits above the signal line.
Negative bars mean it sits below.
But the real value is in the bar heights. The histogram can start shrinking several bars before the lines actually cross, because the gap narrows before it closes.
A sequence of falling histogram bars during an uptrend is an early momentum warning, often arriving well ahead of the crossover itself.
Shrinking bars don’t mean “sell.” They mean “pay attention.”
The trend may resume, or it may be running out of fuel.
Why the zero line matters
The zero line marks the exact point where the 12 EMA and 26 EMA cross each other. A zero-line crossover is therefore a broader trend shift, not just a change in short-term momentum.
When MACD moves above zero, the fast average has overtaken the slow one.
This is a different event from a signal-line crossover. A signal-line cross can happen anywhere on the chart, including deep below zero during a downtrend.
A zero-line cross tells you the underlying trend structure of the averages has flipped.
One more point catches many traders out.
MACD is unbounded. Unlike RSI, which lives between 0 and 100, MACD has no fixed ceiling or floor, and its values scale with the price of the instrument.
A reading of 2.5 on a stock index means something completely different from 0.0015 on EUR/USD.
So don’t treat MACD as a fixed overbought or oversold oscillator. A “high” MACD reading during a strong trend can keep climbing for weeks.
Turning crossovers into real entries
A raw crossover system on a ranging chart can generate a dozen signals in a week, and most of them will be whipsaw trades that reverse almost immediately.
The fix isn’t a magic setting.
It’s treating each type of crossover as a separate event and then requiring context before acting.
Three different crossover events
These three events often fire at different points in the same move. Learn to tell them apart before building rules around them.
- Watch for the histogram flip first. When histogram bars shrink and then change sign, momentum has shifted direction. This is the earliest of the three and also the noisiest.
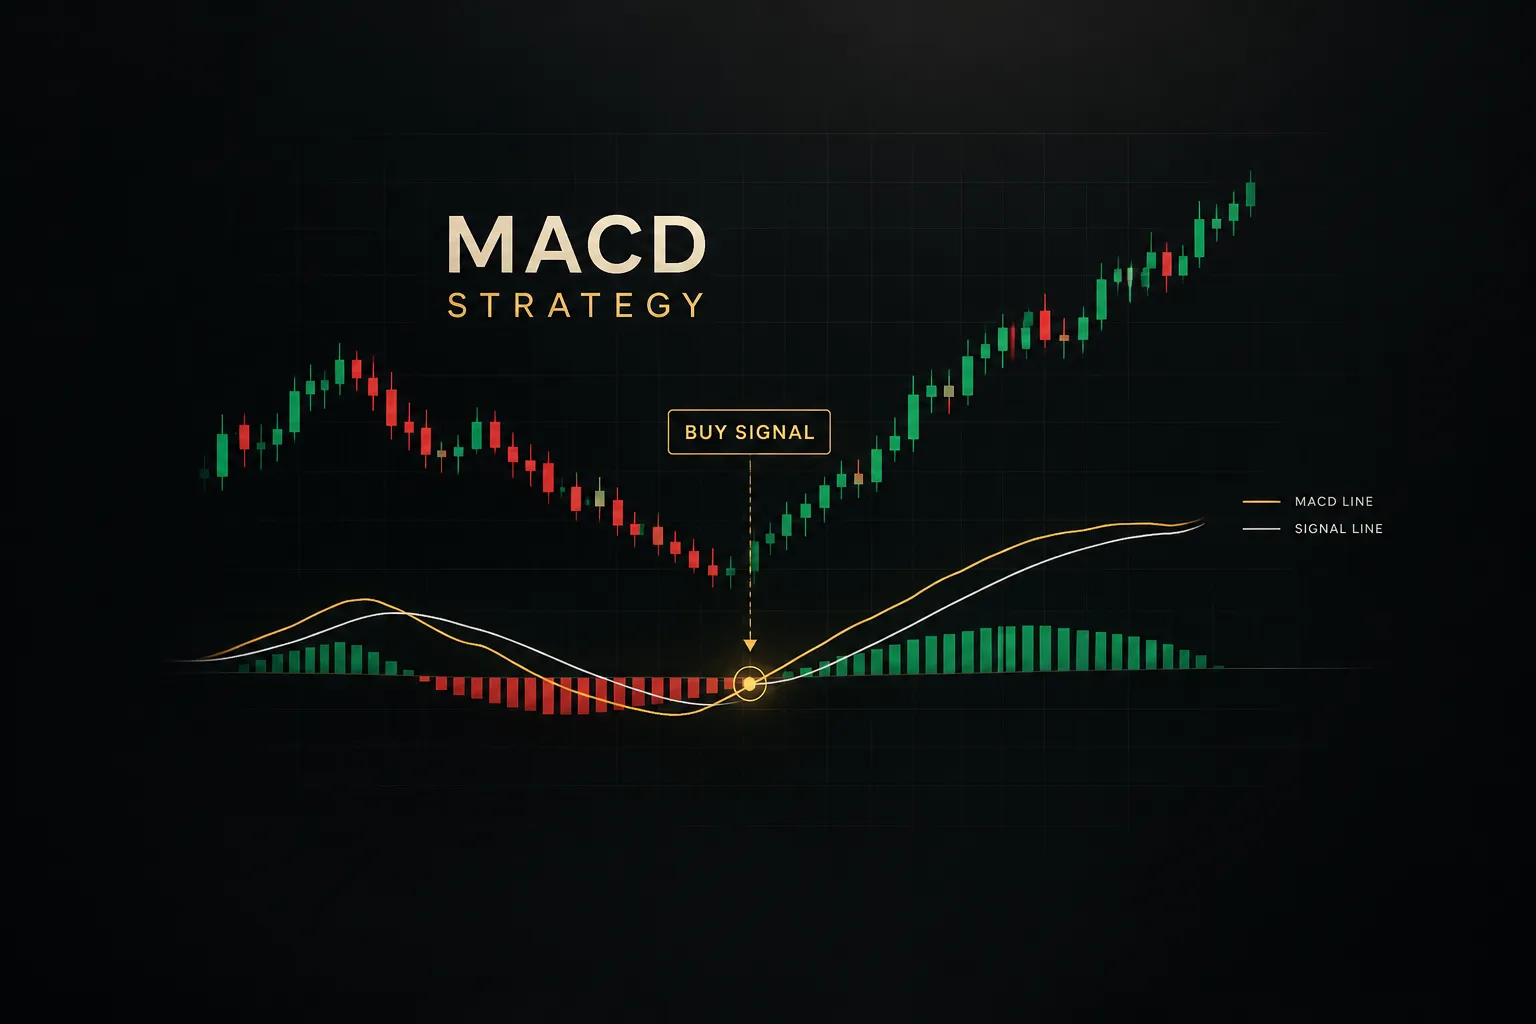
- Treat the signal-line crossover as your timing trigger. The MACD line crossing the signal line confirms the histogram flip and is the most common entry event. It usually arrives a few bars after momentum starts turning.
- Use the zero-line cross as trend confirmation. When MACD crosses zero, the 12 and 26 EMAs have crossed, signaling a broader trend change. It’s the slowest event, so it works better as a filter or a hold signal than as an entry.
Filtering whipsaws with trend context
A signal-line crossover only becomes a valid entry once it passes through a few filters. Here’s a practical sequence for long trades (reverse everything for shorts).
- Check the higher-timeframe trend. If you trade the 1-hour chart, confirm the 4-hour or daily trend is up, for example price above a rising 50 EMA or MACD above zero on that timeframe. Only take bullish crosses in that direction.
- Locate the cross relative to structure. A bullish cross that forms as price bounces off support and resistance, a prior swing low, or a retest of broken resistance carries far more weight than one in the middle of nowhere.
- Prefer crosses near or below zero in uptrends. A bullish signal-line cross below zero during a higher-timeframe uptrend often marks the end of a pullback. A cross far above zero often comes late, after much of the move has happened.
- Require price action confirmation. Look for a higher low, a bullish engulfing candle, or a break of a minor swing high before entering. This single filter removes a large share of false starts.
- Choose your settings deliberately. The standard 12/26/9 balances sensitivity and lag. Faster settings like 5/13/6 produce more signals with less lag but more false positives, while slower settings like 19/39/9 lag more but filter noise better. No setting is universally best, so test the one that fits your timeframe and holding period.
The settings trade-off is worth seeing side by side:
| Setting | Sensitivity | Signal frequency | Lag | Typical use |
|---|---|---|---|---|
| 5/13/6 | High | Many signals | Low | Intraday and scalping, needs strict filters |
| 8/17/9 | Moderately high | Above average | Low to moderate | Short swing trades on 1H to 4H charts |
| 12/26/9 | Balanced | Moderate | Moderate | General default across most timeframes |
| 19/39/9 | Low | Few signals | High | Position trading and trend confirmation |
Why candle close matters
Ever seen a perfect crossover on a live chart, entered, and then watched it vanish?
That’s an unclosed candle at work.
- Wait for the bar to close. MACD recalculates with every tick, so a crossover mid-candle can disappear before the bar finishes. Only a closed candle gives you a confirmed signal.
- Enter on the next bar’s open or a limit order. Once the cross is confirmed, enter at the open of the following candle or set a limit at a pullback level. Write down which method you use so your backtest matches live execution.
- Match backtest logic to live logic. Many backtests assume close-of-bar entries while traders act on intrabar signals live. That mismatch alone can turn a profitable system into a losing one.
Divergence, regimes, and timeframes
Divergence is the most hyped MACD signal and probably the most misused. Traders post annotated charts of perfect reversals, but those charts rarely show the ten divergences that failed.
Getting divergence right starts with knowing exactly which type you’re looking at.
Regular vs hidden divergence
Regular divergence is a reversal warning.
Bearish divergence occurs when price makes a higher high while MACD makes a lower high. Bullish divergence occurs when price makes a lower low while MACD makes a higher low.
Hidden divergence points the other way.
It’s a continuation signal.
In an uptrend, hidden bullish divergence shows price making a higher low while MACD makes a lower low, suggesting the pullback was a pause, not a reversal.
Then there’s plain momentum deceleration.
MACD drifting lower while price grinds sideways or slowly higher is neither regular nor hidden divergence. It just means the trend is maturing, and treating it as a reversal signal is a common and expensive mistake.
Where you measure divergence also matters.
Divergence on the MACD line compares the distance between the two EMAs at each swing. Divergence on the histogram compares the gap between MACD and its signal line, which reacts faster.
Because the histogram is essentially momentum of momentum, histogram divergence often appears earlier and more frequently than MACD-line divergence.
Earlier isn’t automatically better.
You get more warnings, and more of them fail.
Every divergence looks obvious on a historical chart. The question is whether you would have spotted it, and acted on it, before you knew the outcome.
That’s the hindsight trap.
When you scroll back through charts picking divergence examples, you naturally remember the ones that led to big reversals. Discretionary selection like this dramatically overstates reliability, so define divergence with objective rules (for example, two swing highs at least 10 bars apart, measured on closing prices) before testing it.
How market regime changes MACD
MACD is a trend-following indicator and a momentum indicator at the same time. That makes it brilliant in one market regime and nearly useless in another.
In trending markets, MACD shines.
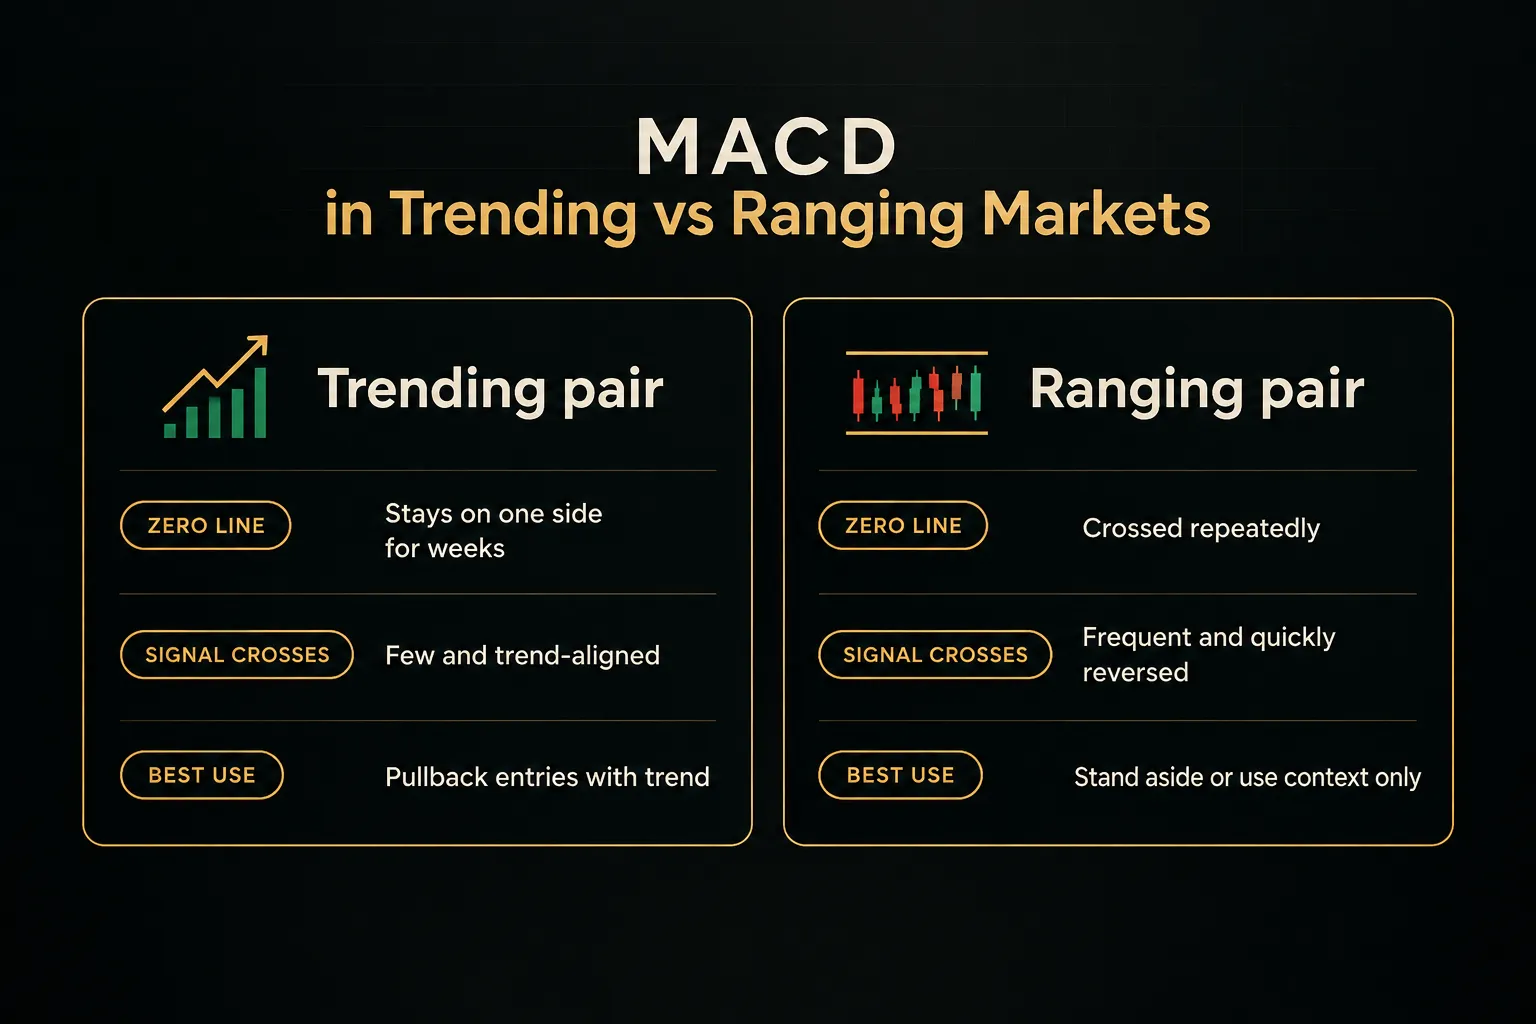
Signal-line crosses in the trend direction catch pullback entries, and the indicator stays on one side of zero for long stretches. In sideways ranges, MACD oscillates around zero and crosses back and forth constantly, producing whipsaw after whipsaw.
Low-volatility conditions create a different problem.
MACD flattens near zero, and tiny price moves generate crossovers that mean almost nothing. News-driven spikes do the opposite, pushing MACD to extreme values in a single bar and triggering late signals right as the move exhausts itself.
Picture two currency pairs over the same month.
GBP/JPY trends steadily higher, holding above its rising 50 EMA, and its daily MACD stays above zero with three clean bullish crosses on pullbacks. EUR/CHF chops inside a 60-pip range, and its MACD crosses zero five times and its signal line nearly a dozen times, with almost every cross reversing within a few bars.
Same indicator. Same settings. Completely different results.
A simple regime filter helps.
Use average true range (ATR) to check whether volatility is expanding or compressed, and a slope check on a longer moving average to confirm a trend exists.
If both point to chop, stand aside.
Picking and confirming your timeframe
Here’s a rule that fixes many MACD problems on its own: use a higher timeframe for directional bias and a lower timeframe for execution. A ratio of roughly 4:1 to 6:1 works well, such as daily for bias and 4-hour for entries, or 1-hour for bias and 15-minute for entries.
The logic is straightforward.
The higher timeframe tells you which way the current is flowing. The lower timeframe helps you time an entry with tighter stops and better risk-to-reward ratio potential.
Proper multi-timeframe analysis means checking alignment before every trade. Flipping through charts manually works, though it gets tedious fast.
Tools like PipTrend’s 12-timeframe table display trend direction across all timeframes at once, making it quick to confirm that your execution timeframe agrees with the bigger picture before you commit.
Forex traders face extra variables on short timeframes. Session overlaps, especially London and New York, bring the strongest volume and cleanest trends, while the late Asian session often produces thin, choppy price action that generates false crosses.
Spreads also widen during low-liquidity hours and around rollover.
And scheduled releases like nonfarm payrolls, CPI, or central bank decisions can blow through any MACD setup in seconds… so many traders simply avoid entries in the 15 to 30 minutes around high-impact news.
Risk, exits, and backtesting
A mediocre entry with excellent risk management will usually outlast a great entry with sloppy exits.
That’s the uncomfortable truth behind most profitable MACD systems.
The entry rule gets the attention, but stops, targets, and costs decide whether the strategy actually makes money.
Stop-loss and take-profit placement
Arbitrary stops, like “always 20 pips,” ignore what the market is doing. Good stop-loss placement goes beyond recent structure, where price would have to travel to prove your trade idea wrong.
Your profit target should be tied to prior support or resistance, or to a fixed multiple of your risk.
Equally important is an invalidation rule.
A strong example: exit if an opposite signal-line crossover occurs and price breaks the most recent swing low (for longs). Requiring both conditions avoids bailing on every minor wobble while still cutting trades that have genuinely failed.
| Rule type | Method | How to apply | Best suited for |
|---|---|---|---|
| Stop-loss | Swing structure | Place stop just beyond the most recent swing low (long) or swing high (short) | Most trend-pullback MACD entries |
| Stop-loss | ATR buffer | Structure level plus 0.5 to 1.0 times the 14-period ATR to avoid noise stop-outs | Volatile pairs and news-heavy sessions |
| Take-profit | Prior support/resistance | Target the next significant swing high/low or horizontal level | Range edges and structured trends |
| Take-profit | Fixed risk-reward | Exit at 1.5R, 2R, or 3R, where R equals initial risk distance | Systematic, easily backtested strategies |
| Invalidation | Cross plus structure break | Exit when an opposite crossover closes and price breaks the last swing point | Stalling or failing trades before the stop hits |
Stops also drive position sizing.
Decide your risk per trade first (many traders use 0.5% to 1% of account equity), then calculate position size from the distance to your stop. A wider structural stop simply means a smaller position.
Spread, slippage, and other costs
MACD is a lagging indicator, so by the time a crossover confirms, part of the move is already gone.
Trading costs then take another bite.
On short timeframes, that combination can erase an edge that looked healthy on paper.
| Cost | What it is | When it hurts most | How to account for it |
|---|---|---|---|
| Spread | Gap between bid and ask prices | Low-liquidity hours, exotic pairs, scalping | Use realistic or variable spreads in your backtest |
| Slippage | Fill price worse than the order price | News releases, fast markets, stop orders | Add a fixed slippage estimate per trade, such as 0.5 to 1 pip on majors |
| Commission | Broker fee per lot or per trade | High-frequency strategies with small targets | Deduct round-trip commission from every simulated trade |
| Swap / rollover | Overnight interest charged or paid | Multi-day swing trades held against the carry | Include daily swap rates for trades held past rollover |
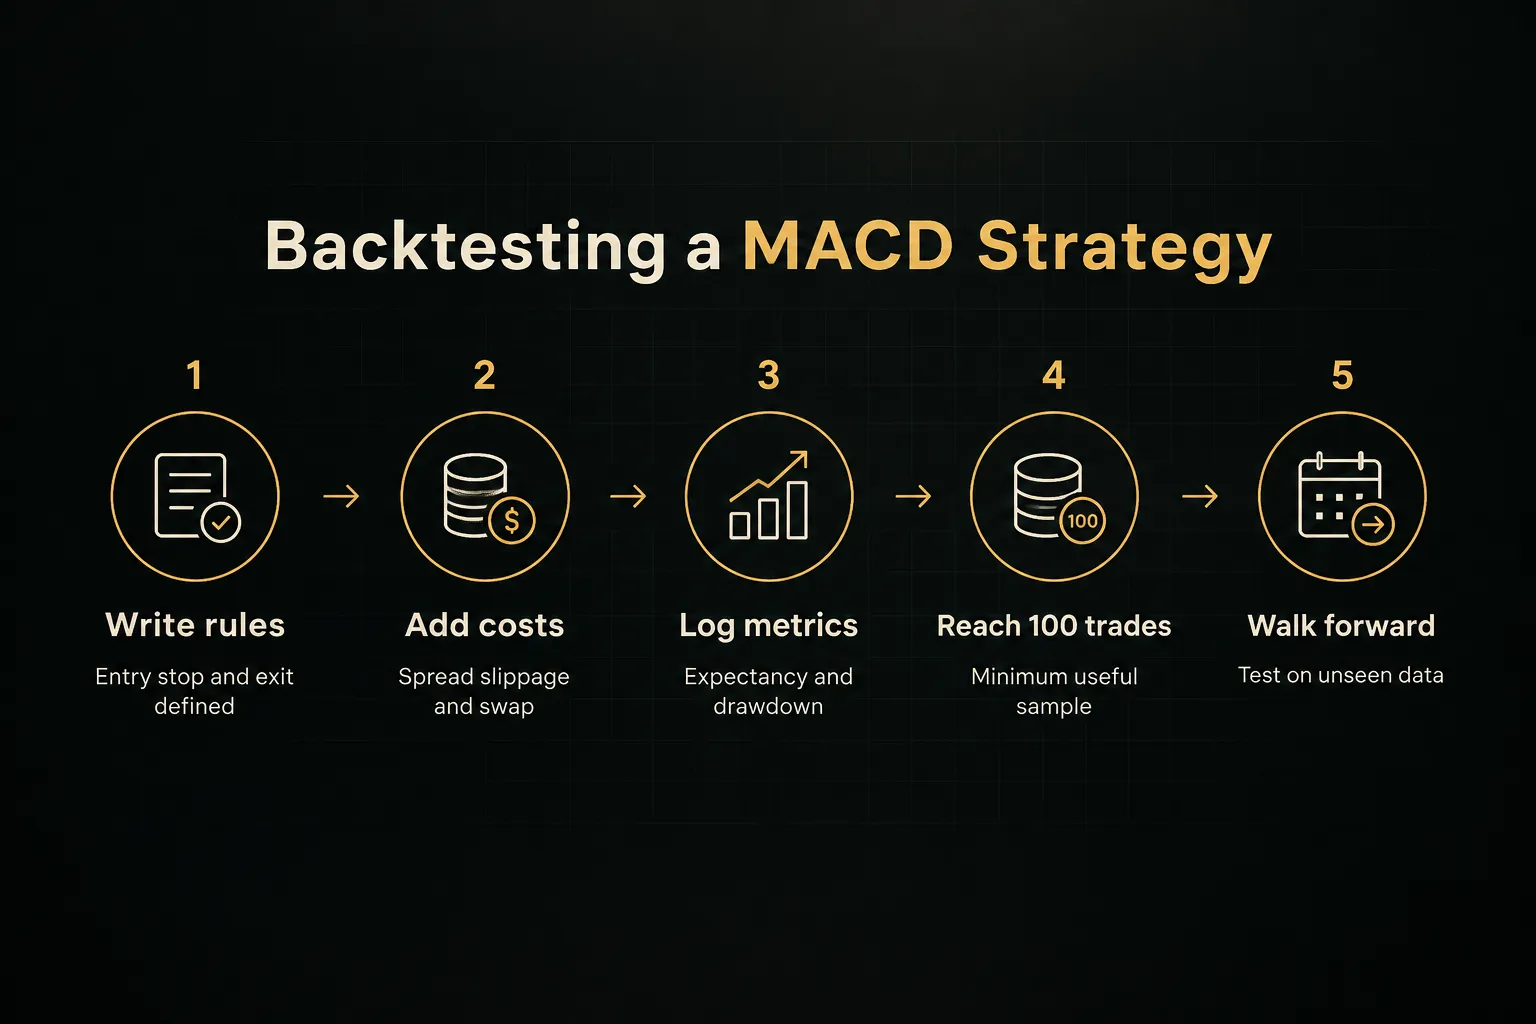
A backtesting checklist that matters
Backtesting turns opinions into evidence.
But only if you log the right numbers and resist the urge to tweak settings until a few charts look perfect.
| Metric | What it tells you | Practical benchmark |
|---|---|---|
| Expectancy | Average profit or loss per trade in R or currency | Must be positive after all costs |
| Profit factor | Gross profit divided by gross loss | Above 1.3 is workable; above 1.5 is strong |
| Maximum drawdown | Largest peak-to-trough equity decline | One you could sit through without abandoning the system |
| Average risk-to-reward | Average winner size relative to average loser | Read alongside win rate, never alone |
| Win rate | Percentage of trades that close profitably | 35% to 45% can be profitable with 2R+ winners |
| Sample size | Number of trades in the test | At least 100 trades, ideally across multiple regimes |
The biggest danger is curve-fitting.
If you optimize MACD to 7/23/11 because it nailed six chart examples, you’ve fitted noise, not found an edge. Use walk-forward testing: optimize on one period, then test unchanged rules on a later, unseen period.
Common MACD questions answered
What is the most accurate MACD strategy?
No single MACD strategy is the most accurate.
Accuracy comes from combining a higher-timeframe trend filter, price structure, and candle-close confirmation, not from any specific crossover or setting. A trend-aligned signal-line cross at support beats a random cross almost every time.
What is the best MACD setting for day trading?
Many day traders use faster settings like 5/13/6 for quicker signals on 5-minute to 15-minute charts. The trade-off is clear: less lag, but more false positives.
If you use faster settings, tighten your filters accordingly, especially around session opens and news.
Is MACD better than RSI?
Neither is better, because they answer different questions.
MACD is an unbounded trend and momentum tool that shows direction and acceleration. RSI is a bounded oscillator from 0 to 100 designed to flag overbought and oversold conditions, and many traders use both together.
What does it mean when MACD crosses above or below zero?
A cross above zero means the 12 EMA has moved above the 26 EMA, signaling a broader bullish shift.
A cross below zero means the reverse.
This is distinct from a signal-line cross, which only reflects short-term momentum changes.
How reliable is MACD divergence?
MACD divergence is a warning, not a guaranteed reversal signal.
Strong trends can show divergence repeatedly while continuing to run. Reliability improves noticeably when divergence forms at a key structure level and gets confirmed by a break of a swing point or a signal-line cross.
Can MACD be used as a standalone trading strategy?
MACD is not recommended as a standalone strategy.
On its own, it ignores market regime, structure, costs, and position sizing. Pair it with trend context, defined risk rules, and thorough backtesting to turn a single indicator into a complete trading plan.
The bottom line on MACD
Keep the decision rule simple.
If the market is trending, trade signal-line crosses in the direction of the higher-timeframe trend, confirmed on candle close and backed by structure. If the market is ranging or choppy, stand aside or use MACD only for zero-line context.
Precision never comes from the crossover itself.
It comes from stacking MACD with support and resistance, price action confirmation, sensible stops, and position sizing that survives a losing streak.
Your next step is concrete.
Pick one market and one timeframe.
Write your entry, invalidation, stop, and exit rules on paper, then backtest at least 100 trades with realistic costs before risking a single dollar of live capital.
Sources
Risk Disclaimer: Trading involves risk. Past performance doesn't guarantee future results. Only trade with money you can afford to lose. PipTrend is a tool to assist your trading decisions, not financial advice.