Forex Strategy: A Framework for Choosing and Testing One
On this page
What a Forex Strategy Actually Is
Most traders who say they have a strategy actually have a setup.
There’s a difference, and it’s expensive.
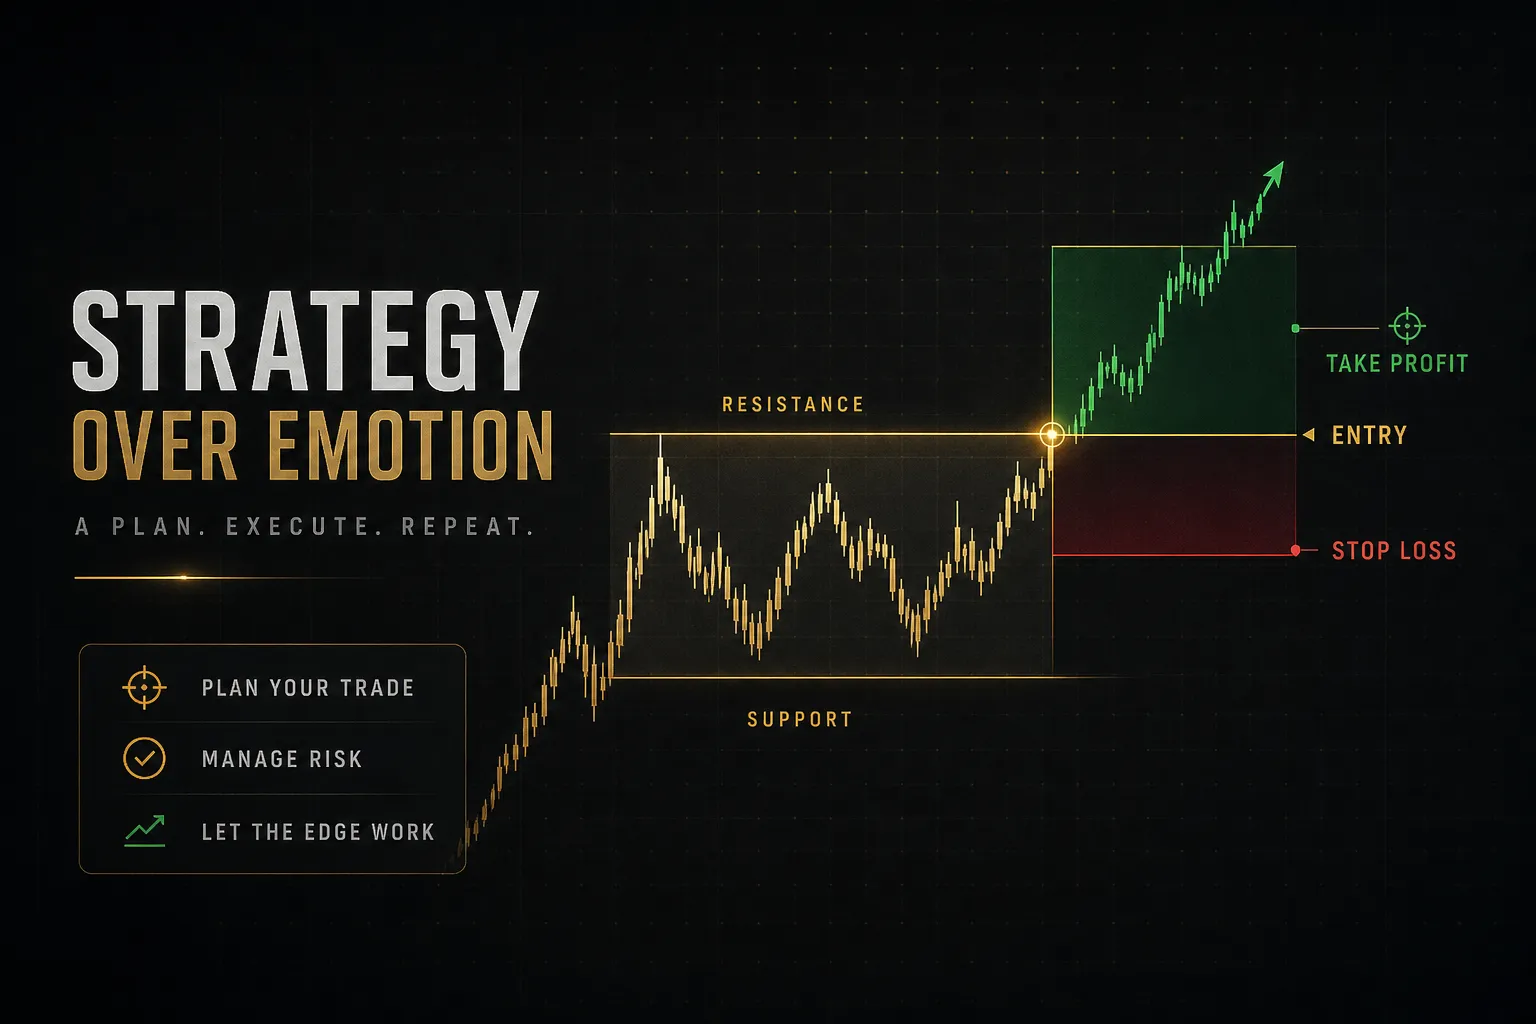
A forex strategy is a complete, testable rule set that answers four questions before you click anything: which direction you’re trading, where you enter, where you exit (both in profit and in loss), and how much you risk.
Remove any one of those and you don’t have a strategy.
You have a hunch with an indicator attached.
This is where the confusion starts.
A moving average crossover is a signal. A pin bar at support is a setup.
Neither tells you your stop distance, your target, your position size, or what price proves the idea wrong.
Traders who confuse these things end up executing the same signal five different ways across five different trades, then wonder why their results look random.
Inconsistent rules produce inconsistent results. Not because the edge failed, but because there was never one edge being tested.
The second thing to accept early: there is no single best method.
Profitability comes from the interaction between your strategy type and the current market regime.
Trend following prints money in a directional market and bleeds slowly in a range. Mean reversion does the exact opposite.
The strategy didn’t change.
The market did.
So this guide follows a four-part framework, in order:
- Match strategy type to regime so you’re not fighting the market’s current behaviour.
- Build complete rules covering entry, exit, invalidation, and management.
- Size risk properly, including exposure you didn’t realise you’d stacked.
- Validate with realistic testing that includes spread, slippage, and enough trades to mean something.
Skip a step and the ones after it stop working.
Matching Strategy Type to Market Conditions
Here’s the uncomfortable truth about most “failed” strategies: they worked fine.
They were just deployed in the wrong regime.
Currency markets cycle between three broad behaviours. They trend, they range, and they convulse around news.
Each behaviour rewards a different logic and punishes the other two.
Your job isn’t to find the strategy that wins everywhere. It’s to read which regime you’re in and pick the tool that fits.
Trend-Following Approaches
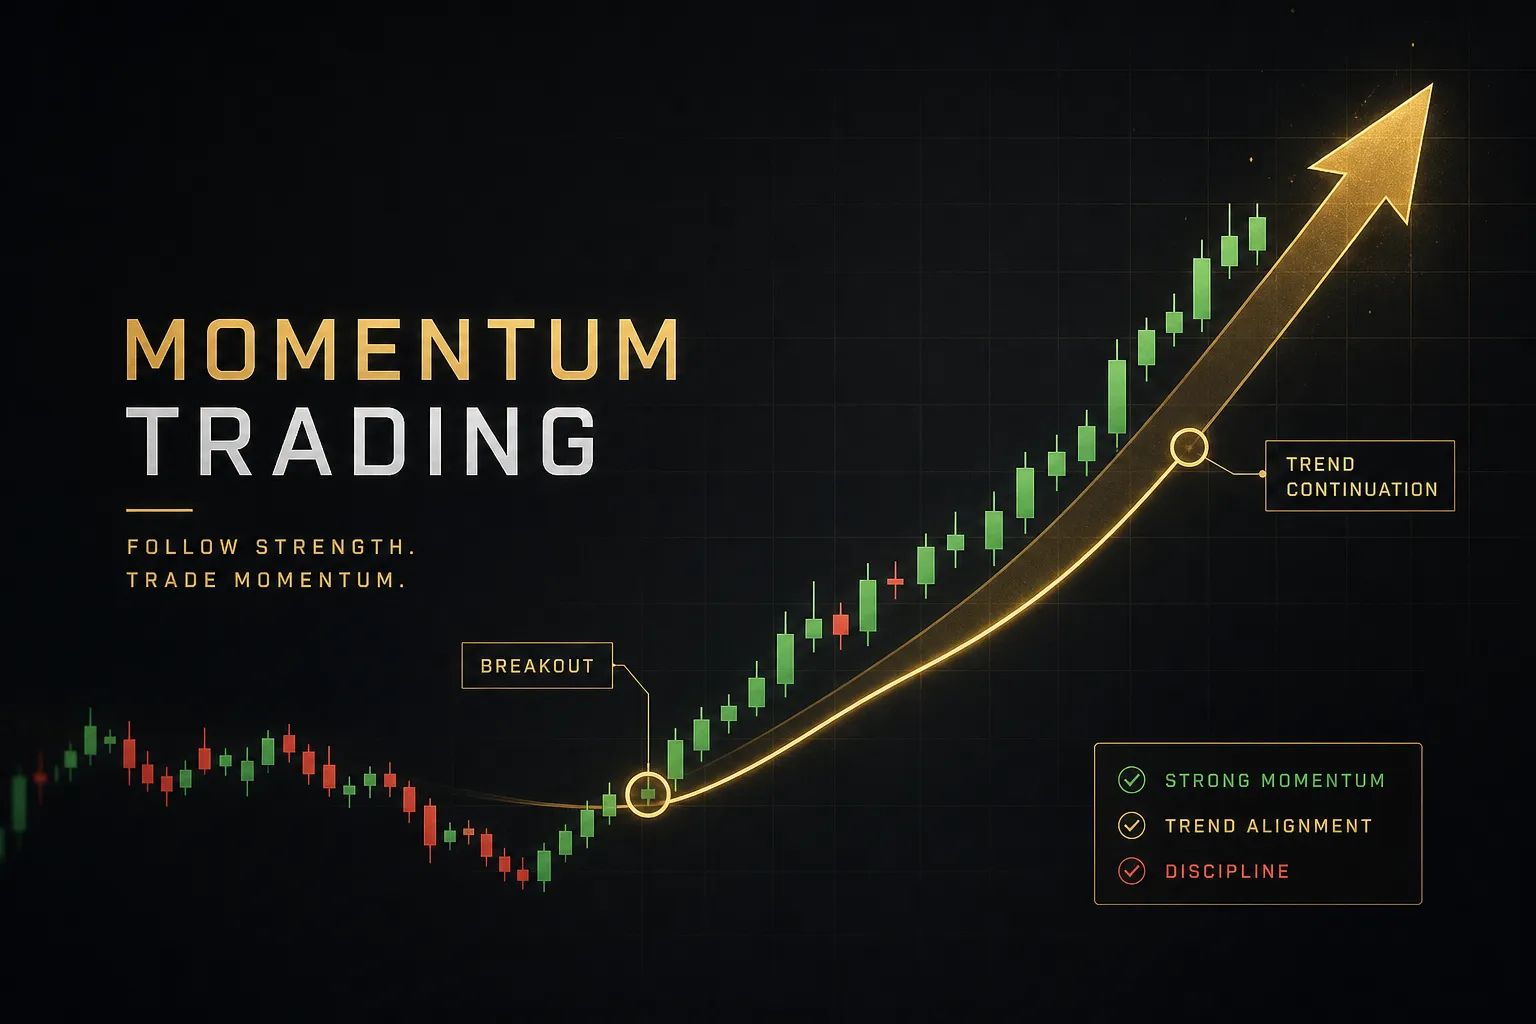
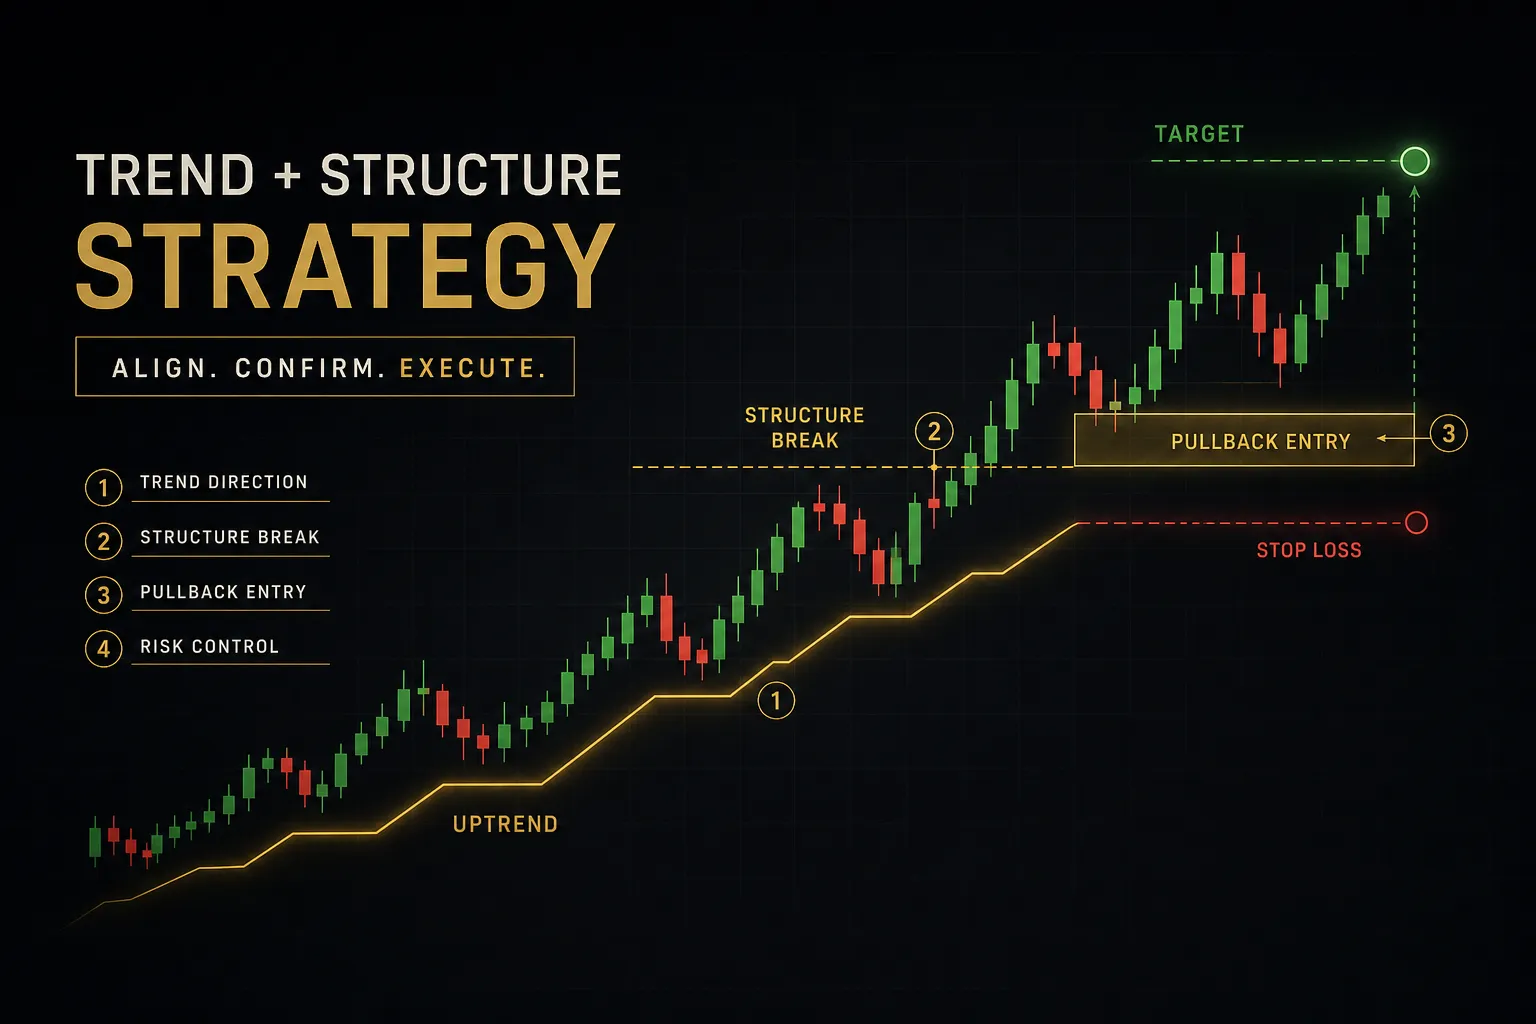
Trend following assumes that price in motion tends to stay in motion. The rule sets are usually built around structure and alignment: higher highs and higher lows on the chart, a shorter moving average holding above a longer one, or price breaking a prior swing high and continuing.
Two common entry styles dominate. Breakout trading buys the moment price clears a defined level, accepting more false starts in exchange for catching the move early. Pullback entry waits for price to retrace into a moving average or prior support and resistance zone, which improves the risk-to-reward ratio but means some trends leave without you.
Trend systems typically win less than half their trades.
That’s by design.
They rely on a handful of large winners paying for a long tail of small losses.
Which is precisely why they suffer in choppy, low-volatility ranges. In a market drifting sideways across 40 pips, breakouts fail immediately, moving averages flatten and cross repeatedly, and every small loss lands with no large winner to offset it.
Death by a thousand paper cuts.
If your average true range has compressed and the last three breakouts reversed within a session, the regime is telling you something.
Range and Mean-Reversion Approaches
Mean reversion assumes the opposite: price stretched away from its average tends to snap back. The classic implementation buys the lower boundary of an established range, sells the upper boundary, and uses an oscillator like the relative strength index to confirm that price has reached an extreme.
Range strategies usually post high win rates, often 60% to 70%, with small individual targets.
The trade-off is obvious once you’ve lived through it. Win rate is high, but a single failure can erase several wins because you’re trading against momentum by definition.
The failure mode is a genuine breakout.
When a range that held for two weeks finally gives way, mean-reversion rules will tell you to sell into strength again and again while price walks away. This is where the stop-loss stops being a formality and becomes the entire reason you survive.
Range traders who move stops “because the level should hold” don’t last.
High-Volatility and News Conditions
Then there are the twenty minutes around a central bank decision, when your carefully tested rules stop describing reality.
During major releases, spreads widen dramatically.
A currency pair that normally trades at a 0.8 pip spread can gap to 5 or 10 pips, and limit orders fill at prices you never agreed to.
Spread and slippage that were rounding errors in your backtest suddenly consume the entire expected profit of the trade.
Worse, stop-loss orders become approximate. In a fast market, a stop at 1.0850 may fill at 1.0838.
Your 1% risk just became 1.4%.
The practical response is unglamorous: check the economic calendar before every session, know when central bank policy announcements land, and either reduce position size, widen stops to reflect real volatility, or stand aside entirely.
Standing aside is a strategy decision, not an absence of one.
None of these three approaches is superior in isolation. A scalper on the 5-minute chart, a swing trader on the 4-hour, and someone holding a position through a rate cycle are all reading different regimes on the same pair.
Trader profile, timeframe, and pair characteristics all shift which approach fits.
And misreading the current regime remains the single most common reason a fundamentally sound strategy loses money.
Turning an Idea Into Testable Rules
“I trade moving average crossovers” is not a strategy.
It’s a topic.
Two traders following that sentence would produce completely different results, which means neither of them can test it, improve it, or trust it.
Below is the process for converting a vague idea into something you can actually evaluate. Work through it with pen and paper before you touch a chart.
Entry and Exit Logic
- Specify the exact signal conditions. Not “moving average crossover” but “the 20-period EMA crosses above the 50-period EMA on the 4-hour chart of EUR/USD, with both averages sloping upward.” Every parameter gets a number.
- Define the confirmation requirement. Decide whether you need a close beyond the level, a candle closing in the direction of the signal, or momentum confirmation from RSI above 50. Write down what you will accept and, critically, what you will reject.
- Set the invalidation price before entry. This is the price at which the idea is wrong, structurally, not the price where you get uncomfortable. For a pullback entry, that’s usually below the swing low that formed the pullback. If price trades there, the setup is void.
- Place the stop-loss using volatility, not preference. A common approach is 1.5x the current average true range beyond the invalidation level, which keeps you outside normal noise. A fixed 20-pip stop applied to both GBP/JPY and EUR/CHF is a mismatch waiting to happen.
- Define the take-profit target with a minimum ratio. If your stop is 40 pips and your rule demands a minimum 2:1 risk-to-reward ratio, your first target sits 80 pips out. If no logical structure exists at that distance, the trade doesn’t qualify. Skip it.
- Write your partial scaling rule. For example: close half the position at 1.5R, move the stop to break-even, trail the remainder below each new swing low. Ambiguity here is where discipline quietly dies.
- List your early-exit conditions. These are non-price reasons to leave, such as a high-impact release landing while you’re in the trade, or the 4-hour candle closing back inside the range you broke out of. Decide now, not in the moment.
Position Sizing and Risk Per Trade
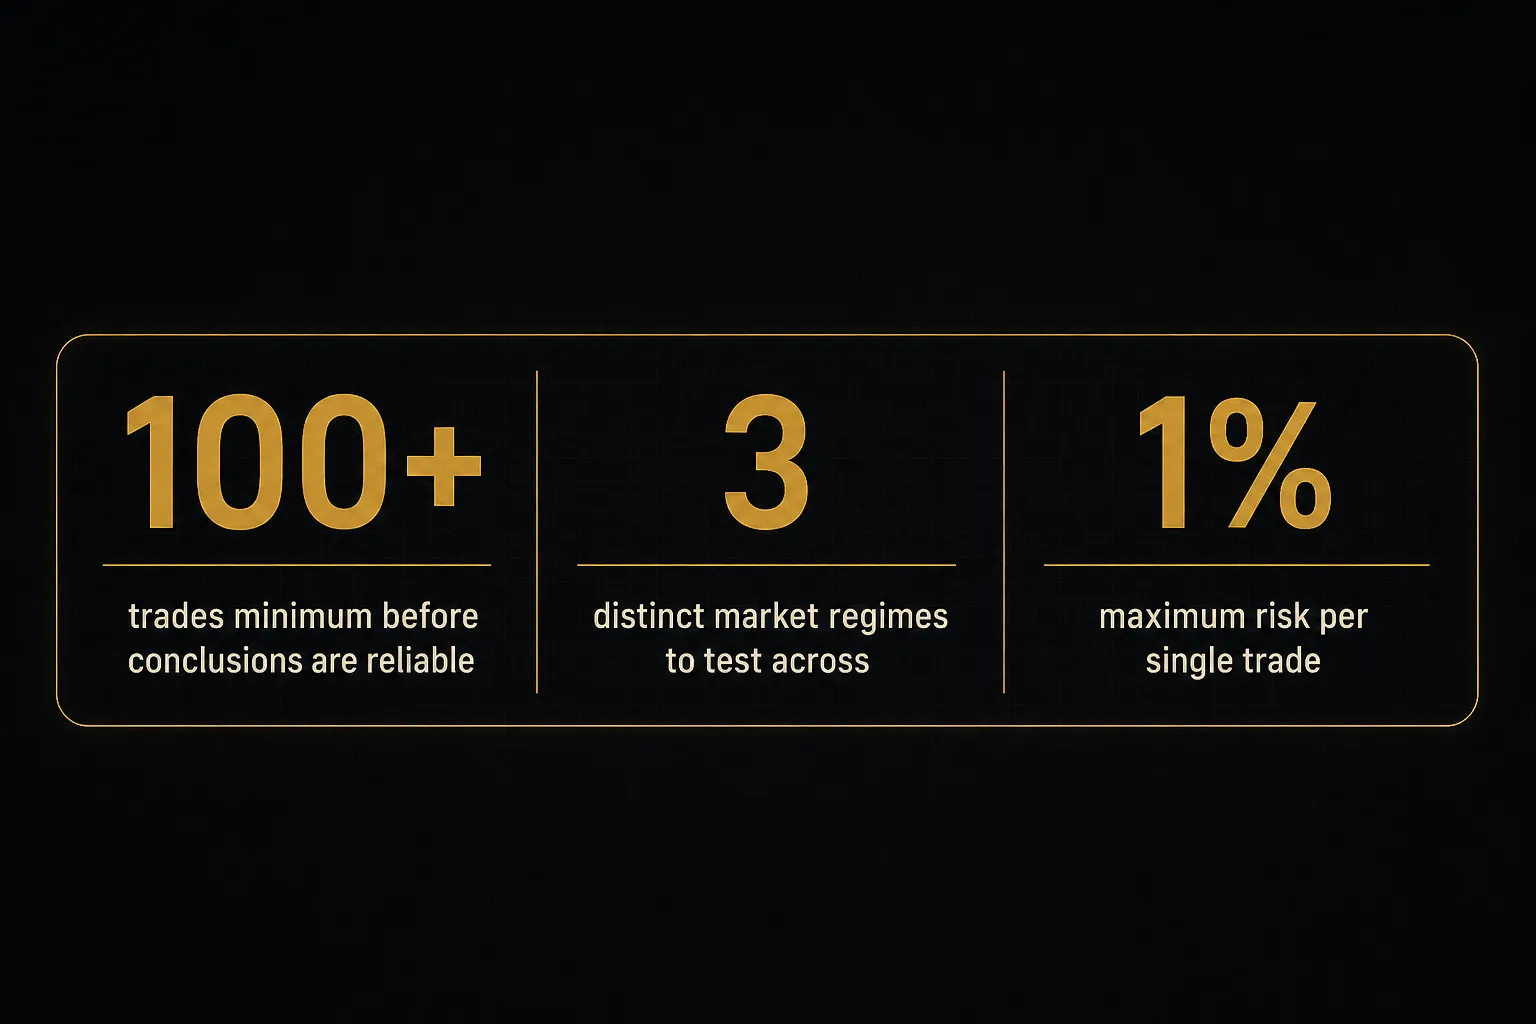
- Fix your risk per trade at a percentage, not a lot size. The 1% rule caps loss on any single trade at 1% of account equity. On a $10,000 account, that’s $100 maximum, regardless of how confident the setup looks.
- Work backwards from the stop distance. The formula: position size = (account balance x risk %) ÷ (stop distance in pips x pip value per lot). This is the only correct order of operations. Size follows the stop; the stop never follows the size.
- Run the calculation before every entry. Take a $10,000 account, 1% risk ($100), a 25-pip stop on EUR/USD, and a pip value of $10 per standard lot. That gives $100 ÷ (25 x $10) = 0.4 lots. Widen the stop to 50 pips and size drops to 0.2 lots. Same risk, different exposure.
- Account for leverage and margin separately. Leverage and margin determine whether you can take a position; your risk rule determines whether you should. Confusing the two is how accounts vanish in a single session.
Correlated Exposure Across Pairs
- Identify the shared currency in every open position. Long EUR/USD, long GBP/USD, and long AUD/USD are not three trades. They’re one short-dollar bet in three costumes.
- Add the correlated risk, don’t average it. Four positions at 1% each that all depend on dollar weakness represent roughly 4% risk on a single macro outcome. One hawkish Fed surprise closes all four together.
- Cap total exposure per currency. A workable rule: no more than 2% aggregate risk tied to any single currency’s direction, and no more than 6% open risk across the account. Correlated exposure is the reason traders following the 1% rule still take 5% hits.
- Log every trade with its correlation tag. Your trading journal should record the pair, the direction, the shared currency, and the regime you believed you were in. Three months of that data will teach you more than any course.
Proving the Edge Before You Trust It

A strategy that looks profitable on a chart and a strategy that is profitable are separated by three things: expectancy, real costs, and sample size.
Most traders check none of them.
Expectancy Beats Win Rate
Trade expectancy is the average amount you expect to earn per trade over many trades. The formula:
Expectancy = (win rate x average win) − (loss rate x average loss)
Win rate alone tells you almost nothing.
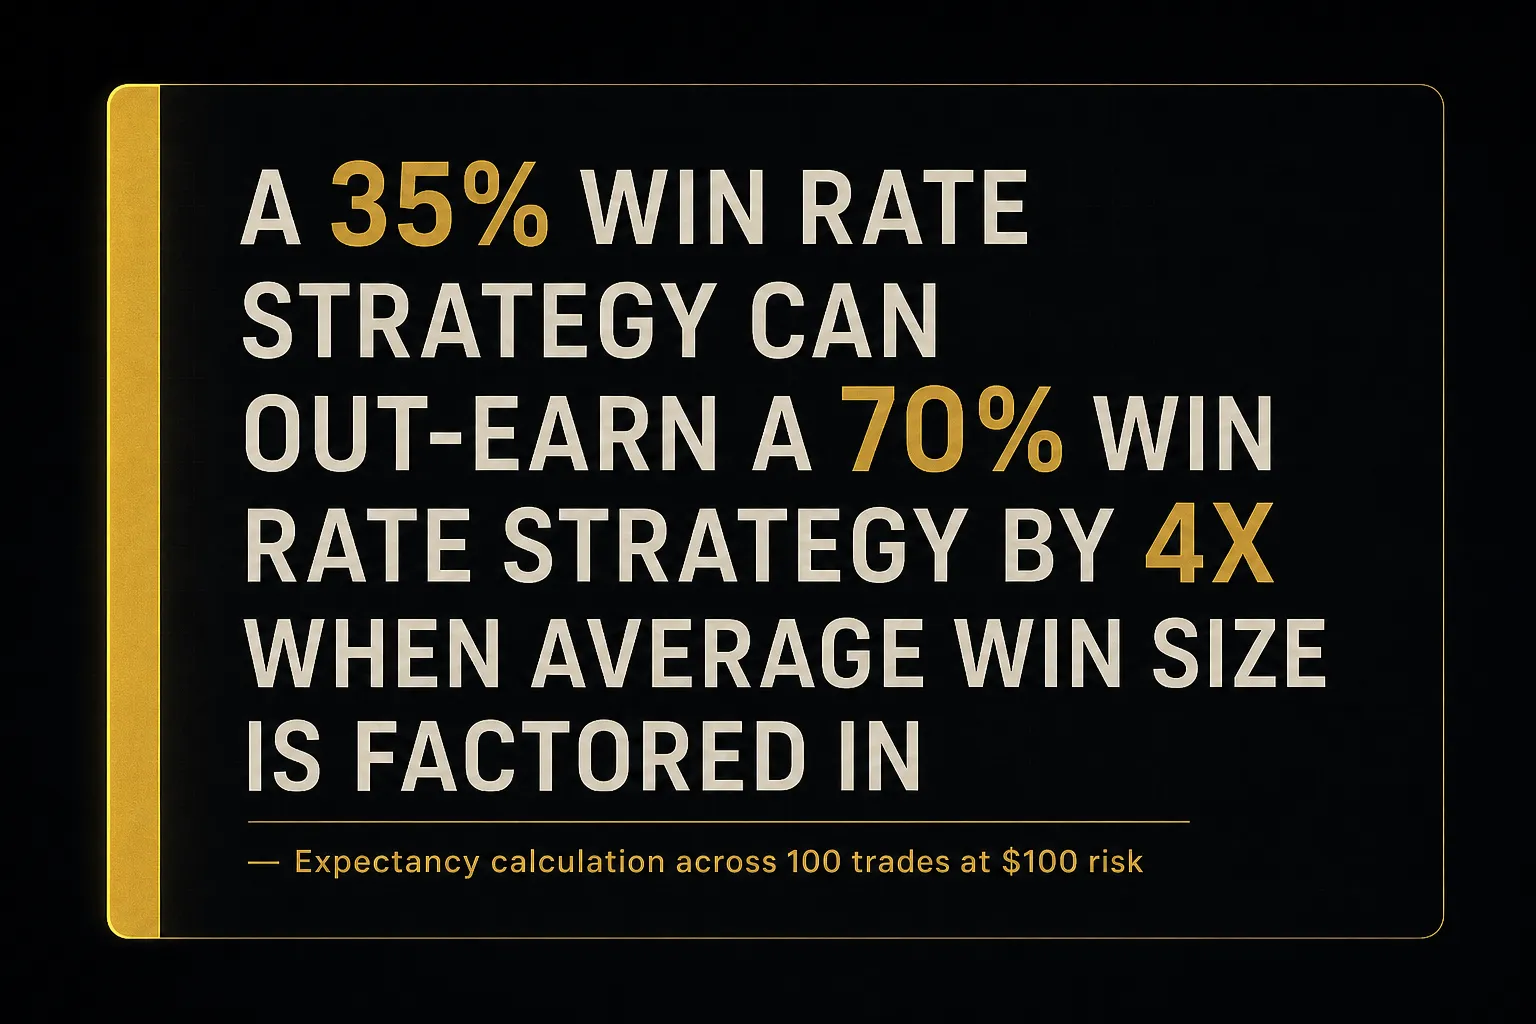
Here’s the proof, using a $100 risk per trade across 100 trades:
| Metric | Strategy A: Range Scalper | Strategy B: Trend Follower |
|---|---|---|
| Win rate | 70% | 35% |
| Average win | $60 | $320 |
| Average loss | $100 | $100 |
| Expectancy per trade | (0.70 x $60) − (0.30 x $100) = +$12 | (0.35 x $320) − (0.65 x $100) = +$47 |
| Result over 100 trades | +$1,200 | +$4,700 |
| Profit factor | 1.40 | 1.72 |
| Typical maximum drawdown | Shallow but frequent | Deep; 8-10 losses in a row is normal |
The trend follower loses two out of every three trades and makes nearly four times as much money.
Meanwhile a 90% win rate strategy with an average win of $20 and average loss of $250 has an expectancy of negative $7 per trade.
It feels wonderful and drains the account.
The psychological cost differs too.
Strategy B’s edge is real, but it demands you sit through drawdowns that make you question everything.
Choose the expectancy profile you can actually execute.
Backtesting With Real Costs
Raw price charts lie by omission.
They show where price went, not what it cost you to be there.
Every one of these needs to be in your backtesting model:
- Spread. A 1-pip spread on a strategy targeting 10 pips consumes 10% of gross profit before anything else happens. Scalping strategies live or die here.
- Commission. Typically $3.50 to $7 per standard lot round-turn on raw-spread accounts. Across 300 trades a year that’s real money.
- Slippage. Budget 0.5 to 2 pips on market entries and stop fills, more during volatile sessions. Assuming perfect fills is the most common backtesting error.
- Swap charges. Positions held overnight accrue financing based on interest rate differentials. A swing strategy holding negative-carry pairs for five days at a time can lose a meaningful slice of its edge to rollover.
- Spread widening around news. If your rules allow trading through releases, model spreads at 5x normal for those windows. Many strategies that look robust turn negative once this is included.
Rerun the earlier range scalper with a 1.2 pip spread and 0.5 pips of slippage per trade.
That $12 expectancy drops toward $2.
The edge was mostly transaction cost.
This is why low-target strategies need forensic cost accounting and higher-target strategies survive sloppier estimates.
Sample Size and Overfitting
Twenty winning trades prove nothing.
Neither do twenty losers.
Evaluate any strategy across at least 100 trades, and make sure those trades span multiple distinct regimes: a clear trend, a sustained range, and at least one high-volatility episode. A trend-following system tested only on the 2020-2021 dollar downtrend will look extraordinary and then hand back everything the moment conditions change.
Then watch for overfitting.
The warning signs are consistent:
- The system has more than four or five tuned parameters, each optimised to a specific value like “RSI period 13.5” or “exit at 1.83R.”
- Performance collapses when a single parameter is nudged 10% in either direction. Genuine edges are tolerant; curve-fitted ones are brittle.
- Equity curve is unnaturally smooth on historical data, with drawdowns that never exceed a few percent.
- Rules include exceptions that exist only to skip specific historical losses (“no trades on Wednesdays in August”).
The cure is forward testing.
Run the frozen rule set on data it has never seen, ideally in real time on a demo account, for at least 30 to 50 trades.
If performance degrades sharply, you optimised noise, not market structure.
Where Indicators and Systems Fit In
Indicators aren’t the problem.
Expecting them to make decisions they can’t make is.
Price Action vs Indicator Signals
Discretionary price action reading has one genuine advantage: it responds to what’s happening now, without mathematical lag. A trader watching a failed breakout and immediate rejection candle at a weekly level sees the shift before any moving average registers it.
Its failure mode is subjectivity.
The same chart supports a bullish and bearish reading depending on which swing you anchor to, and human beings reliably find the reading that matches the position they already hold.
Confirmation bias with extra steps.
Indicator-based rules invert both traits.
They’re objective and testable, which is exactly why they’re easier to validate.
But moving averages lag by construction, oscillators generate false signals in trends, and any indicator will happily produce a clean buy signal into a wall of resistance because it cannot see the wall.
Neither is superior.
Objective rules with a discretionary veto on obvious structural conflicts tends to be the practical middle ground.
How Many Indicators Are Enough
Two or three non-redundant tools.
That’s the working answer.
The trap is redundancy disguised as confirmation.
Stacking MACD, RSI, and Stochastic feels like triple validation, but all three are derived from recent price and momentum. They’ll agree with each other most of the time, which tells you nothing new and creates false confidence.
Indicators genuinely add information when they measure something price alone doesn’t display directly:
- Volatility context from average true range, which tells you how wide your stop needs to be and whether the current regime supports breakout trading.
- Momentum divergence, where price makes a new extreme but the oscillator doesn’t, flagging exhaustion that raw candles obscure.
- Relative positioning across timeframes, showing whether your 15-minute signal aligns with the daily bias or fights it.
Three tools measuring three different things beats six measuring one.
Using a Multi-Timeframe Confirmation System
This is where a lot of traders misunderstand what they’ve bought.
Signals and automated systems are not strategies.
They typically supply direction only.
Entry price, stop placement, target, position size, and exit management still require your explicit rules.
A useful way to see the separation in practice is a platform like PipTrend, where the three jobs stay distinct but connected:
- The signal engine supplies directional bias, answering “which way am I looking?” and nothing more.
- Session levels, VWAP, and supply-demand zones supply the entry price and, by extension, the logical invalidation point behind them.
- The 12-timeframe confluence table informs the hold-or-exit decision, showing whether alignment is building or decaying while the trade is live.
Direction, entry, and management are three separate decisions.
A system that collapses them into one arrow on a chart has removed the parts that determine whether you make money.
Forex Strategy Questions Answered
What is the most successful forex strategy?
No single strategy is most successful across all conditions, and any source claiming otherwise is selling something.
Success is determined by positive expectancy after real costs, plus a regime match: trend following in directional markets, mean reversion in ranges.
The most successful strategy is the one whose drawdown profile you can execute without abandoning it after six losses.
What is the 5-3-1 rule in forex?
The 5-3-1 rule is a simplification framework: trade 5 currency pairs, use 3 strategies, and trade at 1 consistent time of day.
Its real value is reducing variables so you can actually build a meaningful sample size per setup.
Note the overlap with correlated exposure: five pairs sharing the dollar is functionally fewer bets than it looks, so check the shared currency before assuming you’re diversified.
What is the best forex strategy for a $100 account?
On a $100 account, the best strategy is a low-frequency, higher-timeframe approach with strict 1% risk, which means $1 per trade.
That constraint matters because transaction costs are a fixed percentage regardless of account size, so scalping small accounts hands most of the gross profit to the spread.
Treat a $100 account as an execution training tool, not an income source, and focus on proving your rules work rather than growing the balance.
Can you make $100 a day with forex?
Yes, but only with sufficient capital, because profit does not scale independently of account size.
A realistic target of 0.5% to 1% average daily return would require roughly $10,000 to $20,000 in capital to produce $100 consistently, and even then results arrive unevenly across winning and losing weeks.
Chasing $100 daily on a $500 account requires 20% daily returns, which means position sizes that guarantee eventual ruin.
What is the 1% rule in forex?
The 1% rule limits the maximum loss on any single trade to 1% of account equity.
Position size is calculated from the stop distance, so a wider stop produces a smaller position, never a larger risk.
The rule only works if you also cap correlated exposure, since four separate 1% trades on the same underlying dollar view amount to a single 4% bet.
Is forex strategy really profitable?
A forex strategy can be profitable, but only when expectancy stays positive after spread, slippage, commission, and swap costs are deducted.
The mathematics is neutral; the constraint is human execution across drawdowns and sample sizes above 100 trades.
Most retail losses come from inconsistent position sizing and regime mismatch rather than from strategies with no edge at all.
Choose, Test, Then Trust
Reduce the whole framework to a decision tree.
If market structure shows higher highs and higher lows with expanding range, favour trend-following rules and pullback entries.
If price is oscillating between defined support and resistance with compressing volatility, favour mean-reversion rules with tight targets and hard stops.
If volatility is spiking around a central bank decision or major data release, cut position size or stand aside.
Then do one thing this week.
Pick a single strategy type, write its complete rules on one page (entry conditions, stop, target, size formula, invalidation price, early-exit triggers), and forward-test it on a demo account for at least 30 trades before any capital is at risk.
One page.
One strategy.
Real data.
And carry this reframe with you: a forex strategy is a risk-management system with an entry attached.
It doesn’t predict where price is going.
It defines what happens to your account either way.
Sources
Risk Disclaimer: Trading involves risk. Past performance doesn't guarantee future results. Only trade with money you can afford to lose. PipTrend is a tool to assist your trading decisions, not financial advice.