TradingView Indicators Explained: A Beginner's Guide
On this page
Why Indicators Confuse More Traders Than They Help
Open any beginner’s chart and you’ll usually find the same scene: five oscillators stacked under the price, three moving averages tangled across the candles, and a trader who can’t pull the trigger on anything. More indicators were supposed to mean more confidence.
Instead, they created paralysis.
Here’s the uncomfortable part. Most of those tools are measuring the exact same thing in slightly different ways. Running the relative strength index, MACD, and a stochastic together doesn’t triple your confirmation.
It triples your noise.
This guide takes a different approach. Instead of ranking the “top 10 most accurate” indicators (a ranking that changes with whoever is writing the listicle), you’ll learn to pick tools by function: what job does this indicator actually do, and do I already have something doing that job?
By the end, you’ll know how to add and configure a TradingView indicator properly, set alerts that don’t fire on every intrabar wiggle, spot the red flags of repainting scripts, and combine 3-4 tools into a workflow you can actually repeat.
Not a magic signal. A process.
The goal isn’t to find the indicator that predicts the market. It’s to build a chart where every tool has a distinct job and nothing is redundant.
That shift, from collecting indicators to assigning them jobs, is what separates traders who use technical analysis from traders who drown in it.
What a TradingView Indicator Actually Does
Strip away the marketing and an indicator is surprisingly simple: it’s a mathematical formula applied to price, volume, or time data, plotted on your chart in real time. A moving average sums closing prices and divides by the period. The relative strength index compares recent gains to recent losses.
That’s it. No prediction engine, no crystal ball, just math rendered visually.
On TradingView, most indicators are written in Pine Script, the platform’s own coding language. This matters for beginners because it means anyone can publish a script to the Community library.
Some are brilliant.
Some are broken.
The platform hosts over 100,000 community scripts as of 2026, and quality varies wildly.
Indicators come in two visual flavors. Overlays plot directly on the price candles, think moving averages, Bollinger Bands, and VWAP. Oscillators live in a separate pane below the chart and swing between bounded values, like RSI moving between 0 and 100.
Indicator vs. Strategy
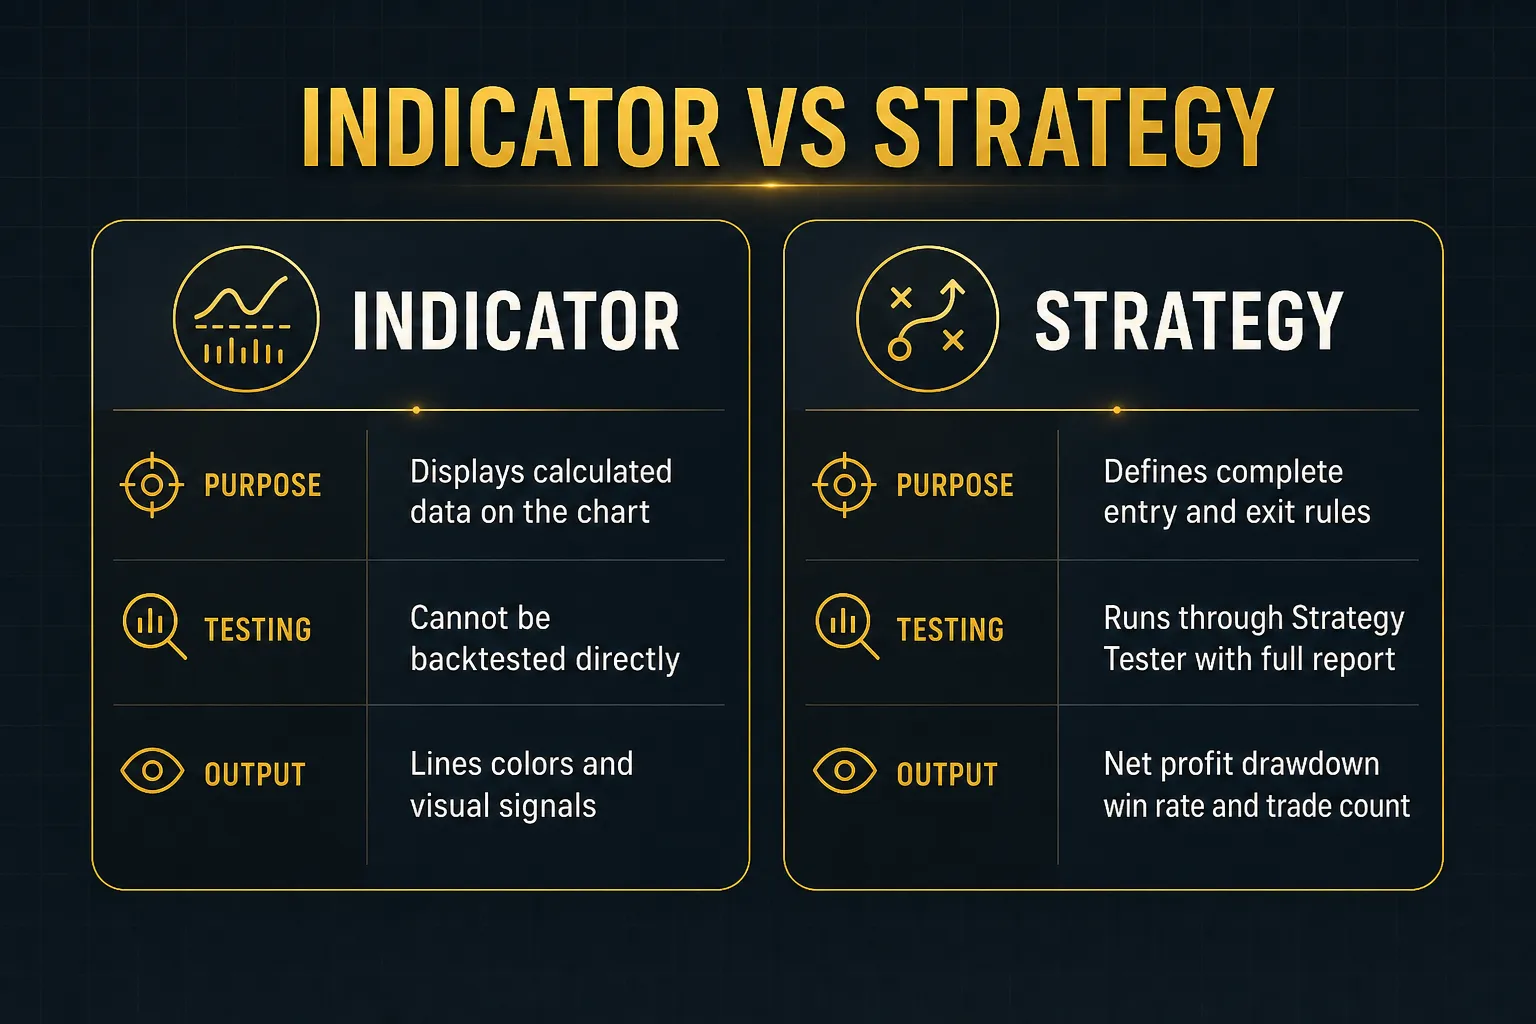
This distinction trips up more beginners than anything else on the platform. An indicator displays information. A strategy defines complete trade rules, entries, exits, position sizing, that TradingView can run through its Strategy Tester.
The Strategy Tester produces a backtesting report with hard numbers: net profit, maximum drawdown, win rate, profit factor, and total trades.
An indicator produces… colors and lines.
Both are useful, but only one can be objectively evaluated against historical data.
Why does this matter?
Because many community scripts paint buy and sell arrows on the chart. Those arrows are visual signals, not verified trade results.
Unless the author built the logic as a strategy and published the tester output, nobody, including the author, actually knows if those arrows made money after costs.
Five Jobs Indicators Perform
Every legitimate indicator does one of five jobs. Learn these categories and you’ll never again wonder whether a new tool belongs on your chart.
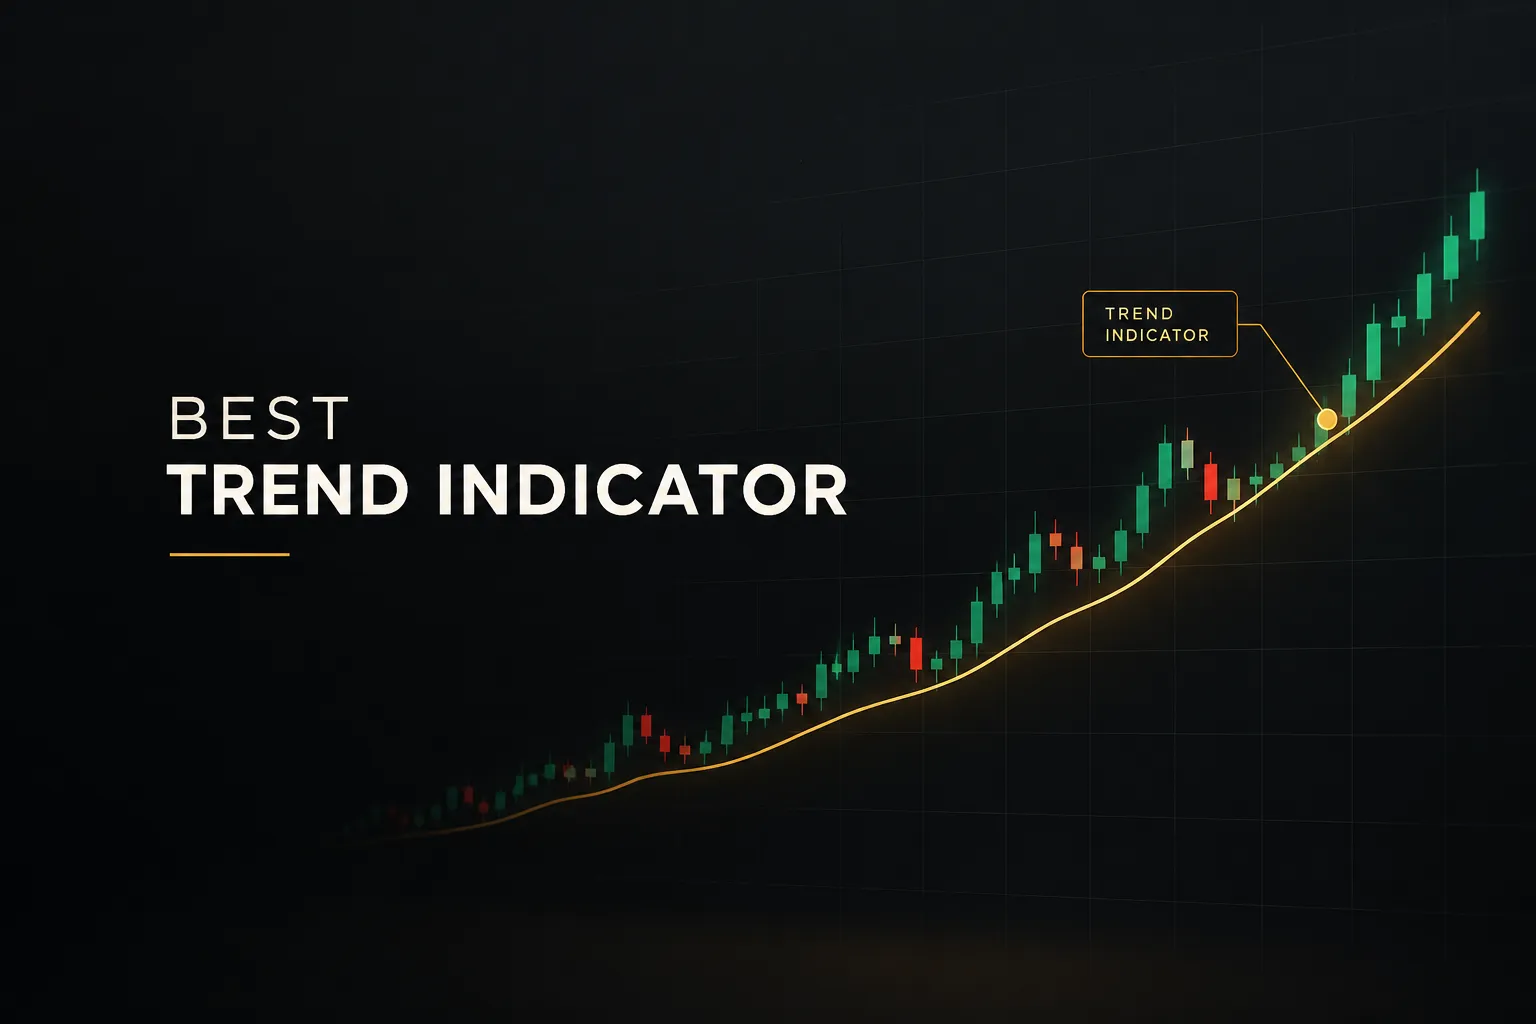
Trend regime. Is the market trending or ranging, and in which direction? A moving average (simple or exponential moving average) and ADX answer this. A trend-following indicator keeps you from fighting the dominant direction.
Momentum confirmation. Is the current move gaining or losing strength? This is the territory of the momentum oscillator family: RSI, MACD, and stochastic.
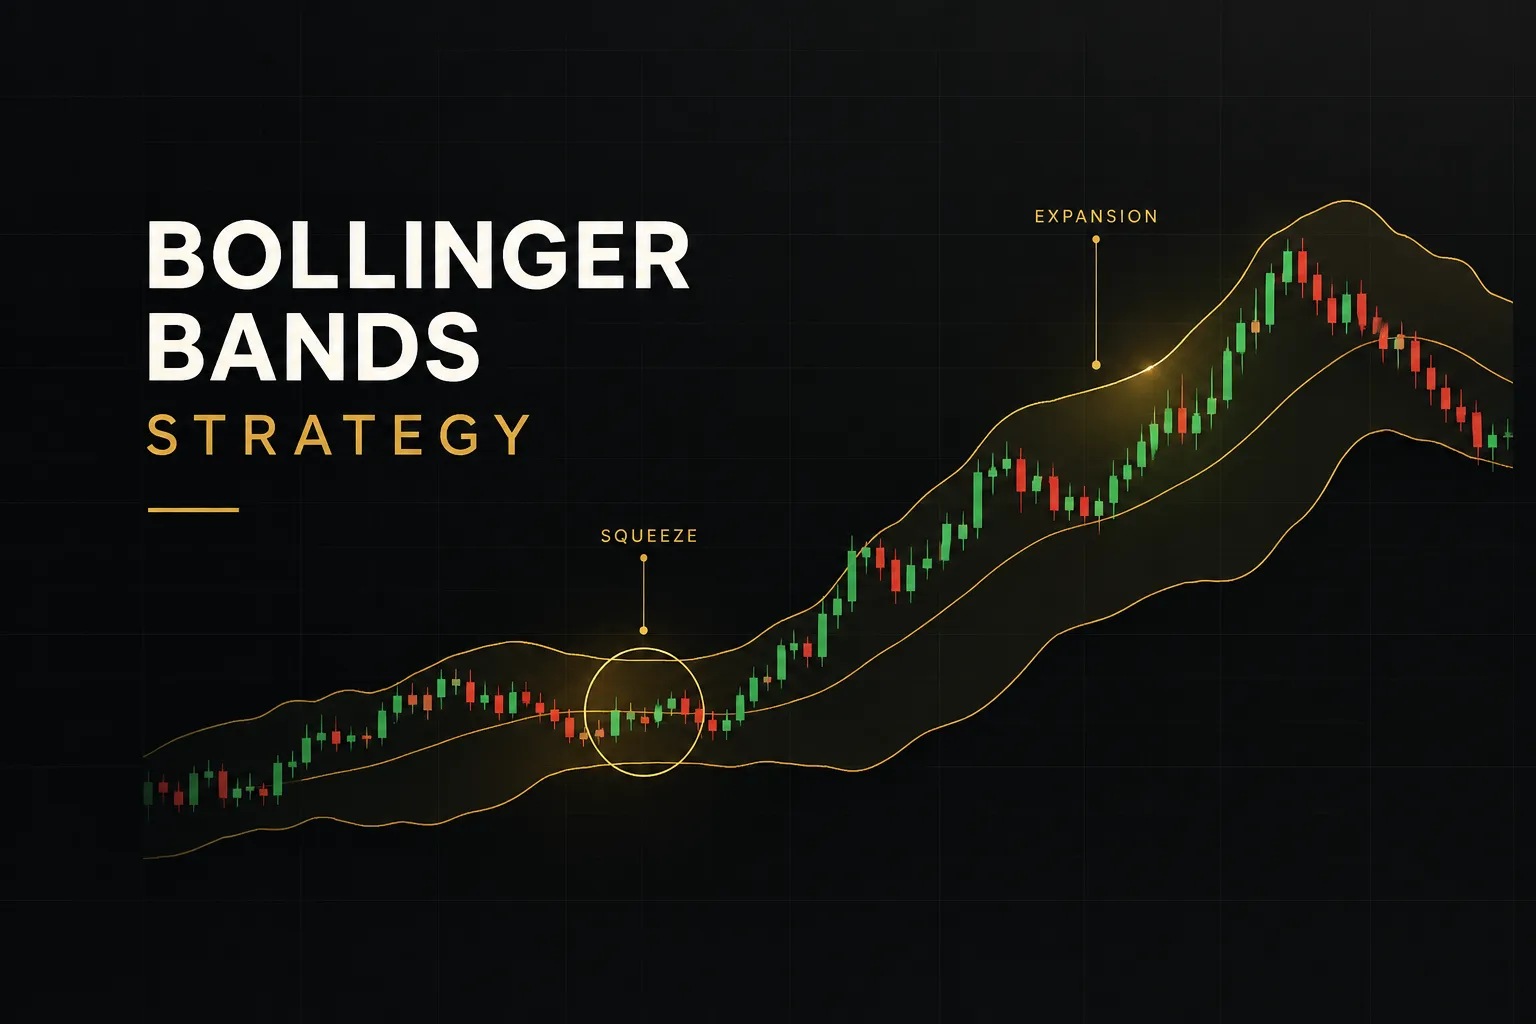
Volatility-based stop placement. How far can price wander without invalidating your idea? The average true range and Bollinger Bands measure how much price typically moves, letting you size stops to the market rather than to hope.
Liquidity and structure context. Where has real business been transacted? Volume profile, order blocks, and classic support and resistance levels map the market structure that price tends to react to.
Entry timing. Once everything else aligns, where exactly do you execute? VWAP and session levels give intraday traders a precise reference for pulling the trigger.
Notice what this framework does: it turns “which indicator is best?” into “which job needs filling?”
That’s a question you can actually answer.
Adding an Indicator to Your Chart
Adding an indicator takes about ten seconds. Configuring it so it actually fits your market and timeframe takes a bit more thought, and it’s the part most beginners skip.
- Open the Indicators panel. Click the “Indicators” button at the top of any chart (or press the forward-slash key). A search window opens with tabs for built-in Technicals, Community Scripts, and your Favorites.
- Search or browse. Type the name (say, “ATR” or “VWAP”) or browse Community Scripts sorted by popularity. Built-in indicators are maintained by TradingView; community scripts are user-published Pine Script and vary in quality.
- Click to add it. One click drops the indicator onto your chart. Overlays appear on the candles; oscillators open a new pane below.
- Open Settings and adjust inputs. Double-click the indicator’s name on the chart (or hover and click the gear icon). The Inputs tab controls the math, period length, source price, calculation method. The Style tab controls colors, line thickness, and visibility.
- Sanity-check the defaults against your timeframe. Default settings are calibrated for “average” conditions that may not match yours. A 14-period RSI on a 1-minute crypto chart reacts to the last 14 minutes of one of the most volatile assets on earth. The same 14-period RSI on a daily forex chart summarizes nearly three weeks of institutional flow. Same formula, completely different behavior. Adjust periods to match your asset’s volatility and your session hours, then observe before trading.
Setting Alerts That Fit Your Plan
Alerts are where indicators become practical, because nobody can watch charts all day. Right-click the indicator on your chart and choose “Add Alert”, or click the alarm-clock icon and select the indicator as your condition source.
The setting that matters most is the trigger frequency. “Once per bar close” waits for candle-close confirmation before firing. “Any time” (intrabar) fires the instant the condition is touched, even if the candle reverses seconds later and the condition disappears.
For beginners, candle-close alerts are almost always the right call.
Intrabar triggers generate a stream of false technical alerts that either exhaust you or, worse, tempt you into unconfirmed entries. Your alert settings should mirror your trade rules: if your plan requires a confirmed close above a moving average, your alert should too.
What the Free Plan Allows
The free TradingView plan is genuinely usable, but it has real constraints. You get a limited number of indicators per chart (two on the free tier as of 2026), a small alert allowance, one chart per layout, and no second-based intervals.
Some invite-only community scripts also require the author’s permission plus, occasionally, a paid TradingView tier to run. For a beginner, the two-indicator limit is less painful than it sounds.
It forces exactly the discipline this guide recommends: one trend tool, one confirmation tool, and nothing redundant.
Consider it training wheels you’ll eventually outgrow into a paid tier, not a handicap.
Matching Indicators to Your Trading Style
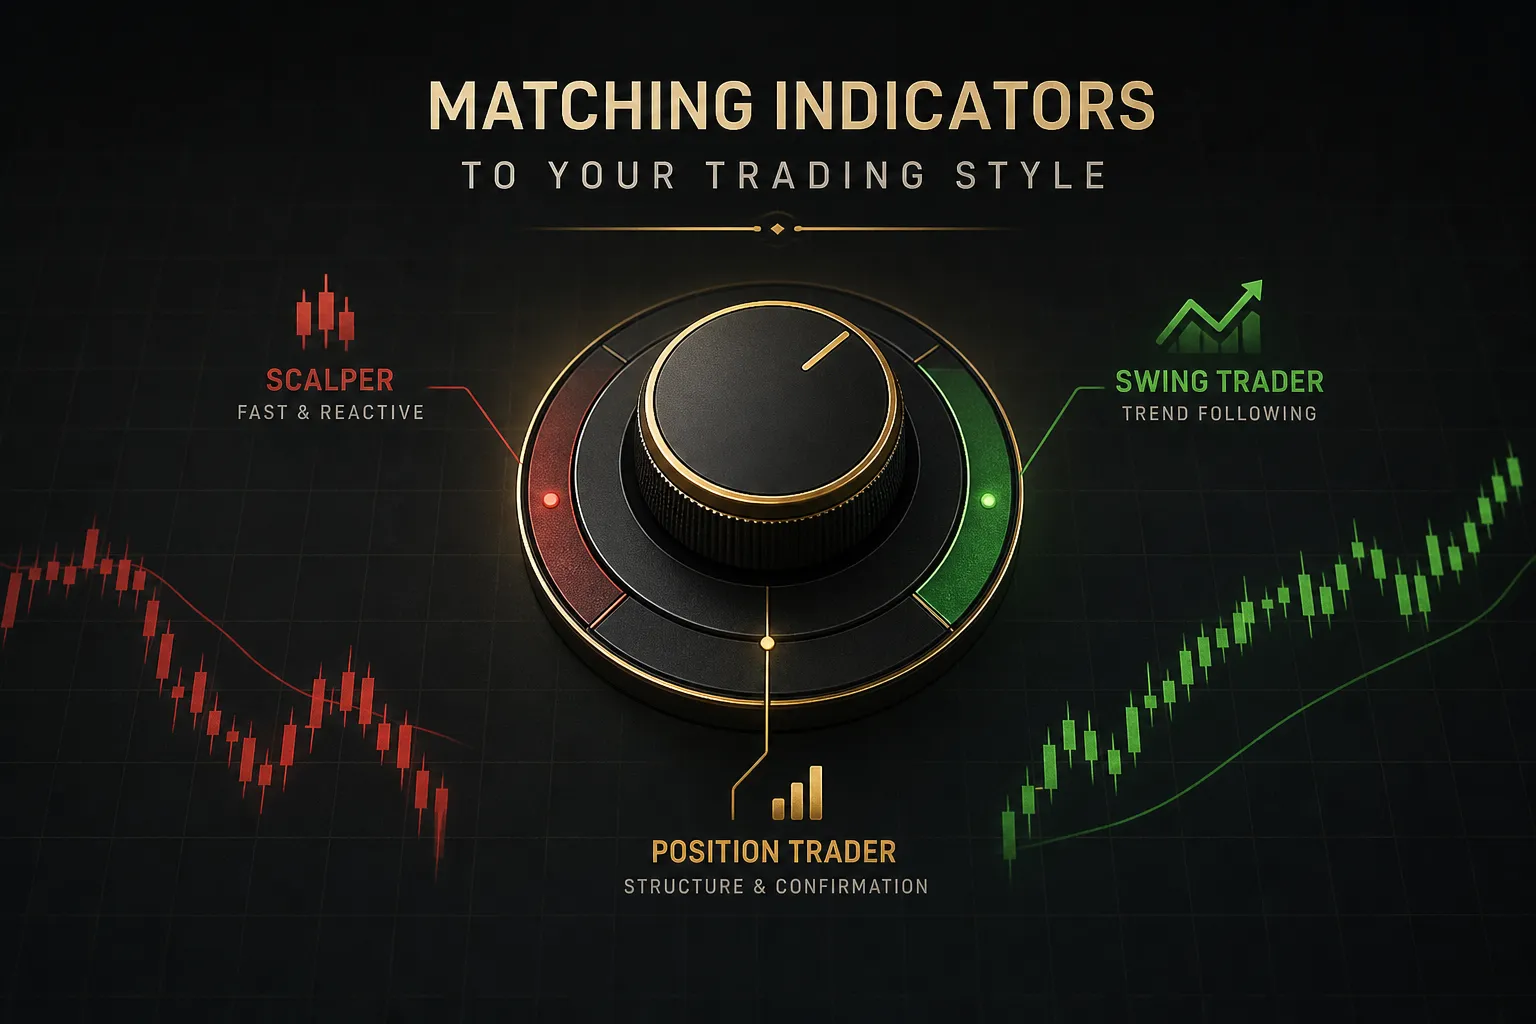
Here’s a rule that will save you months of frustration: 3-4 indicators total, each covering a distinct job, is usually enough.
Not per pane. Total.
The logic follows directly from the five-jobs framework. If you have one tool telling you the trend regime, one confirming momentum, and one measuring volatility for stop placement, you’ve covered the decisions that matter for most setups. A fourth tool for structure or timing is reasonable.
A fifth is almost always duplication.
Trend, Momentum, or Volatility?
Your trading style determines which jobs deserve the most precision. A swing trader holding for days needs a reliable trend filter, a daily exponential moving average or ADX reading, more than split-second entry timing. A scalper needs the opposite: VWAP and session levels matter enormously, while a 200-day moving average is background scenery.
Volatility tools are the exception.
Everyone needs one.
The average true range tells you what a “normal” move looks like on your timeframe, which is the foundation of sensible stop placement and position sizing.
A stop that ignores ATR is a stop placed by feelings.
Start by writing down your style in one sentence (“I swing trade daily forex charts” or “I scalp index futures during the New York session”). Then assign one tool per job that fits that sentence.
If a shiny new indicator doesn’t fill an empty job, it doesn’t go on the chart.
Why Stacking Similar Tools Backfires
RSI, MACD, and stochastic all derive from the same underlying input: recent price change. When RSI shows overbought, the stochastic almost always agrees, because they’re cousins doing near-identical math. Running all three doesn’t give you three independent confirmations.
It gives you one signal wearing three costumes.
This creates what psychologists call false confidence. Three tools “agreeing” feels like overwhelming evidence, so traders size up or skip other checks.
But the agreement was baked into the formulas, not discovered in the market.
Real confluence comes from independent information sources, trend plus momentum plus volume, not from three momentum oscillators reading the same price series.
Volume deserves its own warning here, because volume analysis means different things in different markets. Stock volume reflects actual shares traded on an exchange. Forex and CFD “volume” is usually tick volume, the number of price updates, since spot forex has no central exchange. Futures and crypto volume is exchange-real but fragmented across venues.
A volume profile that’s rock-solid on the S&P 500 needs looser interpretation on a forex pair.
Same indicator, different data quality underneath.
Using Multiple Timeframes Correctly
Multi-timeframe analysis is one of the most powerful concepts in technical analysis, and one of the most misused. Done correctly, it means checking whether trend and momentum align across timeframes before you execute: the daily trend is up, the 4-hour momentum confirms, so you look for entries on the 1-hour.
Done incorrectly, it becomes an automatic trigger: “everything’s green across five timeframes, so I buy now.” Alignment tells you conditions are favorable. It doesn’t tell you the entry is here, the stop belongs there, or the risk-reward ratio justifies the trade.
Those decisions still belong to your rules.
Think of multi-timeframe confluence as a weather report. Clear skies improve your odds of a good hike.
They don’t pick the trail for you.
Can You Trust What You’re Seeing?
This is the question that should keep every indicator user slightly uncomfortable, because the honest answer is: only if you verify it. Charts can lie in ways that are invisible until real money is on the line.
What Repainting Really Means
First, a clarification, because “repainting” gets thrown around loosely. It is completely normal for an indicator’s current, unconfirmed candle to fluctuate while that candle is still forming. RSI wiggles, moving averages shift, signals appear and vanish on the live bar.
That’s real-time data doing its job.
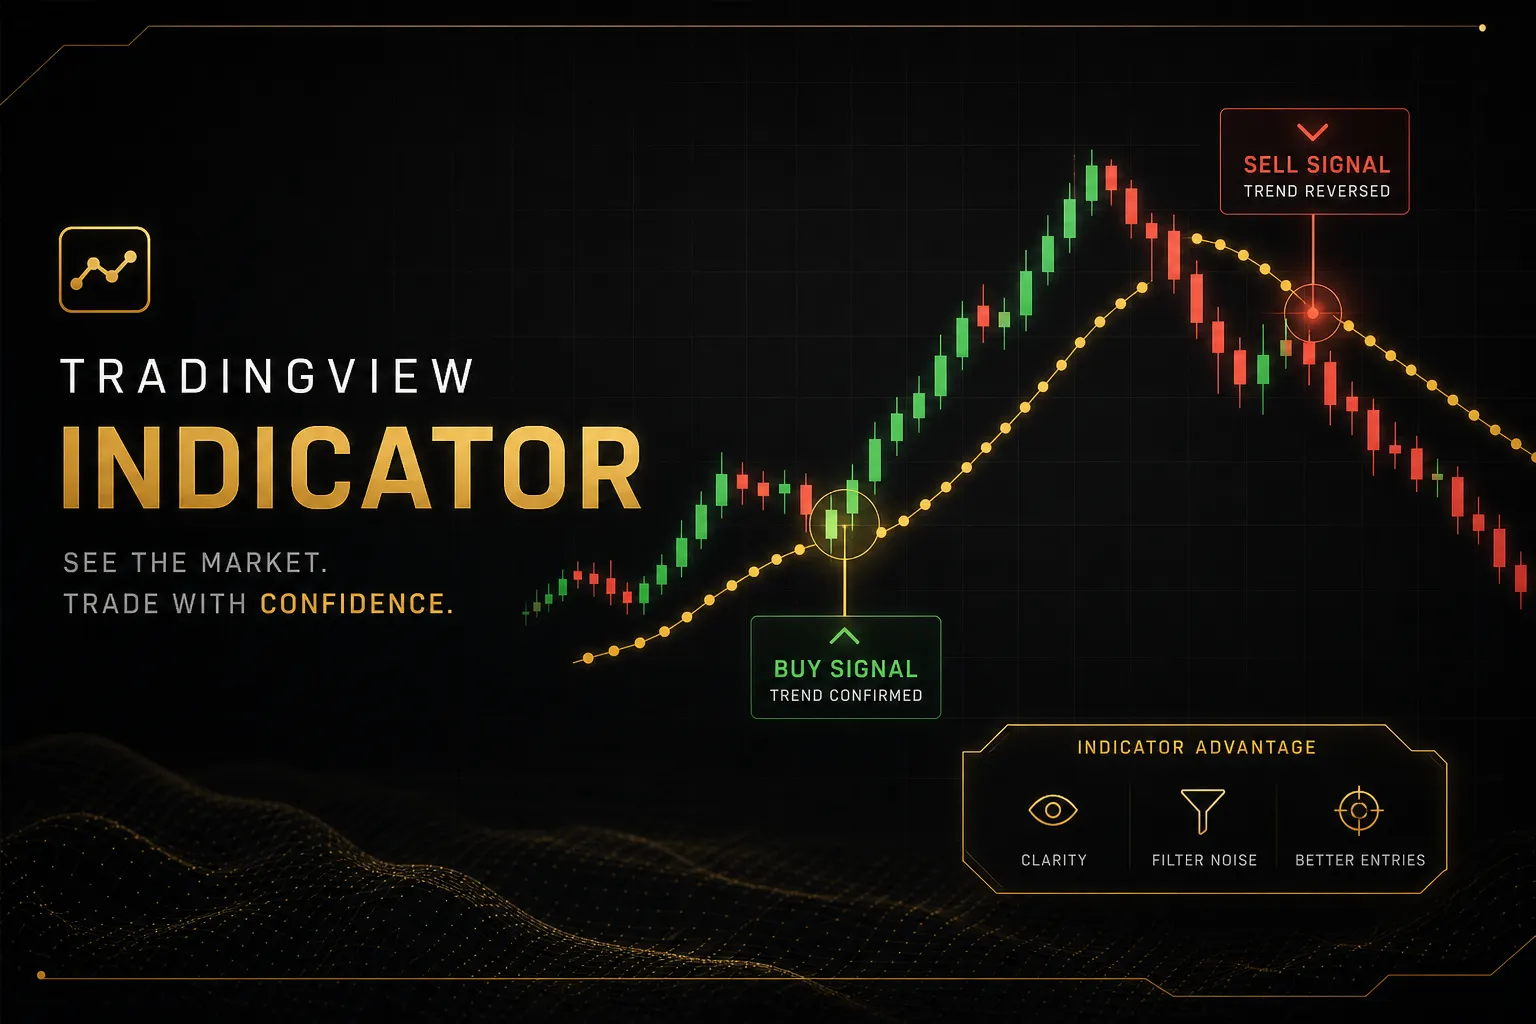
True repainting is something else entirely: historical signals that relocate or disappear after the candle has closed. A buy arrow prints, price moves against it, and the script quietly deletes the arrow. Look back a week later and the indicator’s history shows flawless entries, because the losers were erased.
The backtest looks like genius. Live trading looks like a nightmare.
A related trap is lookahead bias, where a script pulls higher-timeframe data into a lower timeframe incorrectly, effectively letting historical calculations “see” a daily close before it happened. On a chart of past data, this produces impossibly prescient signals. In live trading, that future information simply doesn’t exist yet.
Some developers address this directly by design. PipTrend, for example, builds its indicators to be explicitly non-repainting: signals lock permanently on candle close and never move retroactively, so the history you review is the history that actually printed.
That’s the standard to look for.
But don’t take it, or any developer’s claim, on faith. Verify it yourself by taking screenshots of live signals and comparing them to the chart days later.
If they match, the tool is honest about its own history.
A Legitimacy Checklist for Custom Indicators
Before trusting any community script, especially a paid one, run it through this filter. A legitimate tool passes most of these; a marketing gimmick fails nearly all of them.
- Visible or clearly described logic. You don’t need full Pine Script source, but you need to know what the indicator measures and why. “Proprietary AI algorithm” with zero explanation is a red flag.
- Confirmed candle-close behavior. Signals should finalize on bar close and stay put. Verify with your own screenshots over at least a week.
- Consistency between historical and live signals. If the history looks dramatically better than what you see in real time, something is repainting.
- Published sample size. Twenty cherry-picked trades prove nothing. Look for results across hundreds of signals and multiple market conditions.
- Drawdown and expectancy data. Serious developers report maximum drawdown and trade expectancy (average profit per trade), not just win rate.
- Transparent results including losses. Any track record showing only winners is curated, and curated means untrustworthy.
Why High Win Rates Can Mislead
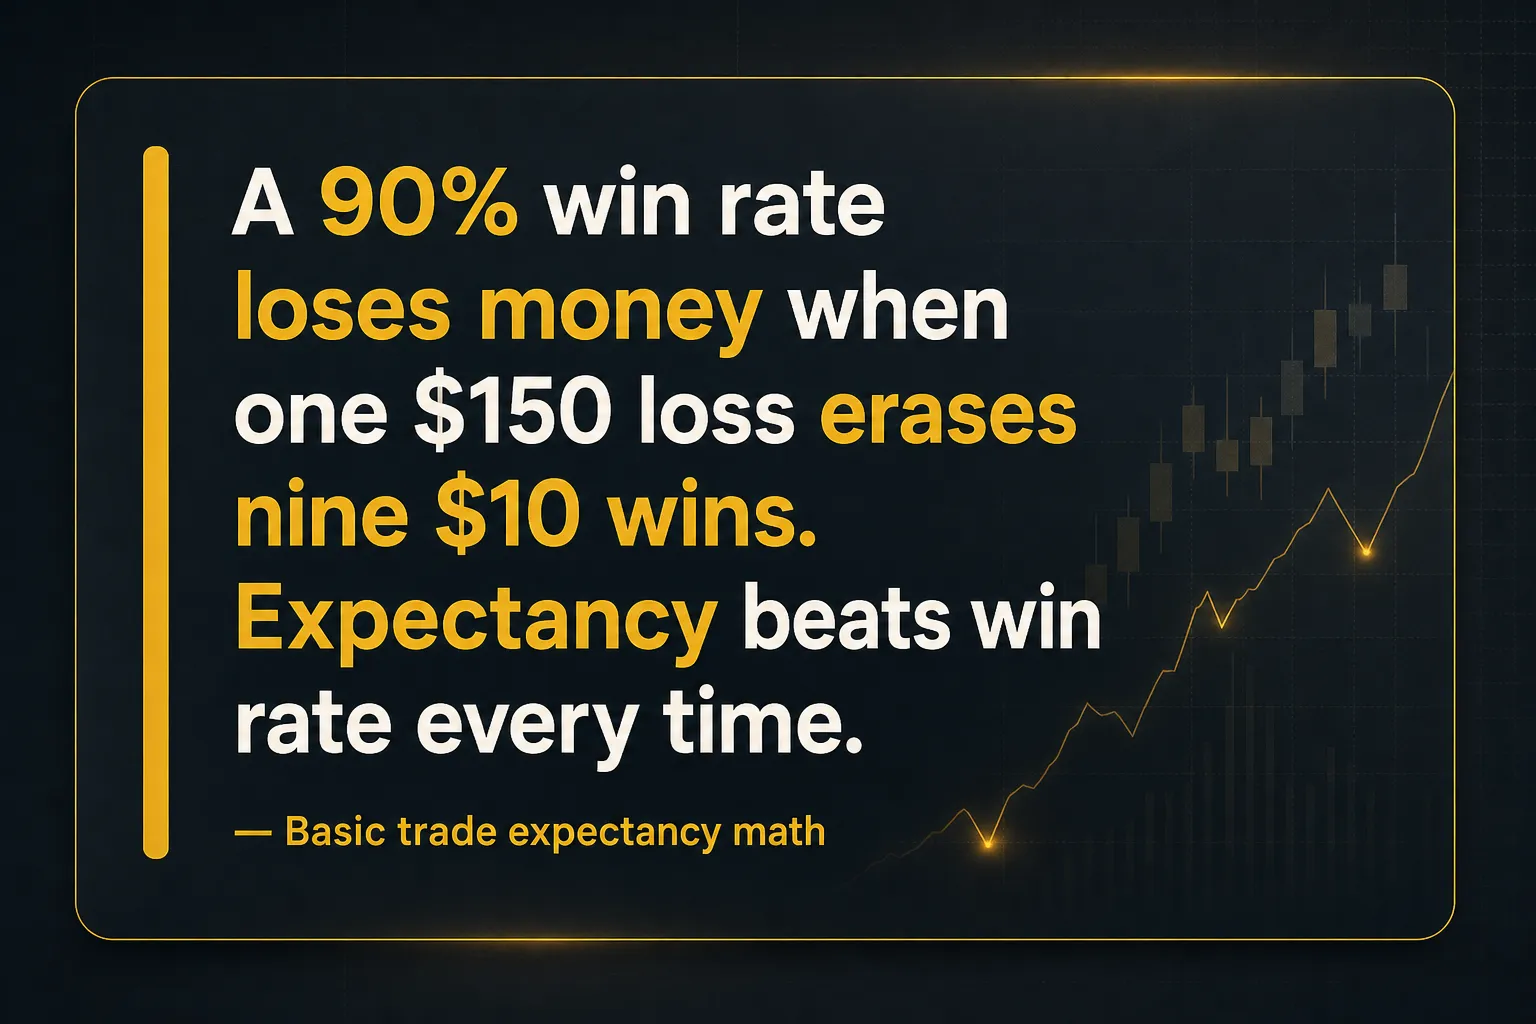
Here’s the math most indicator marketing hopes you never do. A system winning 90% of the time can still lose money if the average loss is large enough. Win $10 nine times, lose $150 once, and you’re down $60 despite a 90% win rate.
Trade expectancy, not win rate, determines profitability.
Costs compound the problem. Spread, commission, and slippage are invisible in most indicator demos but very real in your account. A scalping signal with a $5 average edge per trade evaporates when round-trip costs run $6.
And then there’s overtrading. An indicator firing 40 signals a day practically begs you to take them all, turning a marginal edge into a cost-generating machine. Backtesting has its own blind spots too: historical data gets revised, and intrabar assumptions (did price hit your stop or your target first within a single candle?) can flatter results.
This is why forward testing, running the tool live on a demo account for weeks, is the final exam no backtest can replace.
Common Questions About TradingView Indicators
What is the most accurate indicator on TradingView?
No single indicator is universally the most accurate. Accuracy depends on matching a tool’s function to current market conditions: a trend-following indicator excels in trending markets and fails in ranges, while a momentum oscillator does the opposite.
Instead of hunting for the “best” tool, validate any candidate yourself using the legitimacy checklist: confirmed candle-close signals, consistent live behavior, published sample size, and expectancy data that includes losses. An indicator you’ve verified beats a famous one you haven’t.
What are the best free indicators on TradingView?
Volume Profile, VWAP, the average true range, and moving averages are the strongest free starting points for beginners. Each is well-documented, built into the platform, and covers a distinct job: Volume Profile maps structure, VWAP handles intraday timing, ATR measures volatility for stops, and a moving average defines trend regime.
Add the relative strength index if you want a momentum read, and you’ve covered every functional category without spending anything.
Free and simple beats paid and mysterious.
How do I use indicators on TradingView?
Click the Indicators button on any chart, search for the tool you want, and click to add it. Then open Settings to adjust the period and inputs for your timeframe, and right-click the indicator to add an alert set to trigger on candle close.
The configuration step matters more than the adding step. Default settings assume average conditions, so check how the indicator behaves on your specific asset and timeframe before trading with it. The full walkthrough is in the steps section above.
How many indicators should I use for trading?
Three to four indicators covering distinct functions is the practical maximum for most traders. That typically means one trend tool, one momentum confirmation, one volatility measure for stop placement, and optionally one structure or timing tool.
Avoid stacking similar tools. RSI, MACD, and stochastic all measure momentum from the same price data, so running all three adds noise and false confidence, not extra confirmation.
Do TradingView indicators really work?
Yes, as decision-support tools inside a rules-based plan.
No, as standalone predictors of future price.
An indicator summarizes what price and volume have already done; it cannot see what comes next.
The traders who profit from indicators use them to define conditions (“only long above the 200-day exponential moving average”), place stops (ATR-based), and time entries, all within a plan that includes position sizing and a defined risk-reward ratio.
The indicator supports the process. It isn’t the process.
What is the difference between an indicator and a strategy on TradingView?
An indicator displays calculated data on your chart, while a strategy defines complete entry and exit rules that TradingView’s Strategy Tester can backtest. The tester produces a report with net profit, maximum drawdown, win rate, and total trades, objective numbers an indicator alone can never provide.
Practically: buy and sell arrows on an indicator are visual suggestions with no verified track record. If you want proof a set of rules worked historically, it needs to exist as a Pine Script strategy with published tester results.
Turning Indicators Into a Real Trading Edge
Here’s the perspective shift worth keeping: an indicator is only as reliable as the process wrapped around it. Entry rules, stop placement, position sizing, and honest post-trade review decide your outcomes.
The signal is maybe 20% of the equation.
Your discipline is the rest.
So here’s your action for tonight.
Pick one chart. Strip it down to 2-3 non-redundant indicators, one per job, and delete everything else. Then set alerts on candle-close conditions only, so unconfirmed noise never reaches your phone.
Tools can support that workflow. PipTrend’s multi-timeframe table, for instance, organizes trend and momentum confluence across 12 timeframes in a single view, which removes a lot of manual chart-flipping.
But the table doesn’t take the trade.
Your rules do, your risk management does, and your review process is what compounds a decent signal into a durable edge.
Clean chart. Clear jobs. Confirmed signals. Start there.
Sources
Risk Disclaimer: Trading involves risk. Past performance doesn't guarantee future results. Only trade with money you can afford to lose. PipTrend is a tool to assist your trading decisions, not financial advice.