How to Build a Trading Strategy That Actually Holds Up
On this page
How to Build a Trading Strategy That Actually Holds Up
How to Build a Trading Strategy That Actually Holds Up
What Is a Trading Strategy, Really?
Most people who say they have a trading strategy actually have a preference.
They like breakouts. They like buying dips.
That’s not a strategy.
A trading strategy is a documented, rule-based decision framework that answers five questions before you ever click a button: which market you trade, which direction you take, when you enter, when you exit, and how much you risk.
Written down.
Repeatable by someone else reading your notes.
The difference matters more than most traders admit. Rule-based decisions produce data you can measure.
Impulsive decisions produce stories you tell yourself afterward, usually in a way that makes the loss sound like bad luck and the win sound like skill.
If you cannot hand your rules to another trader and have them take the same trade you would, you don’t have a strategy yet. You have a habit.
This guide covers the five components that turn a habit into a system: directional bias, entry timing, exit management, position sizing, and validation. Each one is a separate decision with its own rules, and most failed strategies collapse because one of the five was never defined.
One honest expectation before we go further.
A strategy reduces randomness.
It does not eliminate it, and it certainly does not guarantee profit. Every valid system produces losing streaks, and maximum drawdown is a feature of the design, not a sign the design broke.
Traders who understand that survive their bad months. Traders who don’t abandon a working system on the third loss and start over.
That cycle, not a lack of good setups, is what ends most trading accounts.
Strategy, System, Setup, and Style
Ask ten traders to define “setup” and you’ll get ten answers, three of which are actually descriptions of an indicator.
The vocabulary confusion isn’t pedantic. It’s the reason people bolt a relative strength index reading onto a chart and call it a plan.
Here’s the hierarchy, from broadest to narrowest, with a concrete example for each.
| Term | Definition | Scope | Concrete Market Example |
|---|---|---|---|
| Style | The time horizon and frequency you operate on | Broadest: shapes everything below it | Swing trading equities with 3 to 10 day holds |
| Strategy | The complete rule set covering market, bias, entry, exit, and sizing | Full framework for one approach | Buy pullbacks to the 50-day moving average in stocks above their 200-day average, risking 1% per trade |
| System | A strategy made fully mechanical, with zero discretionary input | Executable by code | An algorithm that scans the S&P 500 nightly and auto-submits limit orders on qualifying pullbacks |
| Setup | The specific chart or data condition that signals a potential trade | One trigger inside a strategy | Price touches the 50-day MA while RSI holds above 40 |
| Indicator | A single calculated input derived from price or volume | Narrowest: one data point | The 14-period RSI reading 38.6 |
Notice the direction of the relationship. An indicator feeds a setup, a setup lives inside a strategy, a strategy expresses a style, and a system is what a strategy becomes when you remove every judgment call.
Nobody trades an indicator profitably, because an indicator tells you nothing about size, stop, or exit.
The Four Trading Style Categories
Your style determines your costs, your screen time, and how much noise you have to tolerate.
Pick it before you pick anything else.
- Scalping: holding periods from seconds to a few minutes, often 20 to 100+ trades per session. Spread and commission dominate the maths here; a strategy that clears costs at 4 pips of profit can be net negative at 6.
- Day trading: minutes to hours, always flat by the close. Removes overnight gap risk entirely, but demands continuous attention and works best on liquid instruments with tight spreads.
- Swing trading: two days to several weeks, capturing one leg of a larger move. The sweet spot for people with jobs, since setups are identified on daily charts and monitored once or twice a day.
- Position or long-term investing: months to years, where fundamental analysis carries as much weight as technical analysis. Costs become negligible, but a single bad thesis can sit in the account for eighteen months.
Trend-Following vs Mean-Reversion
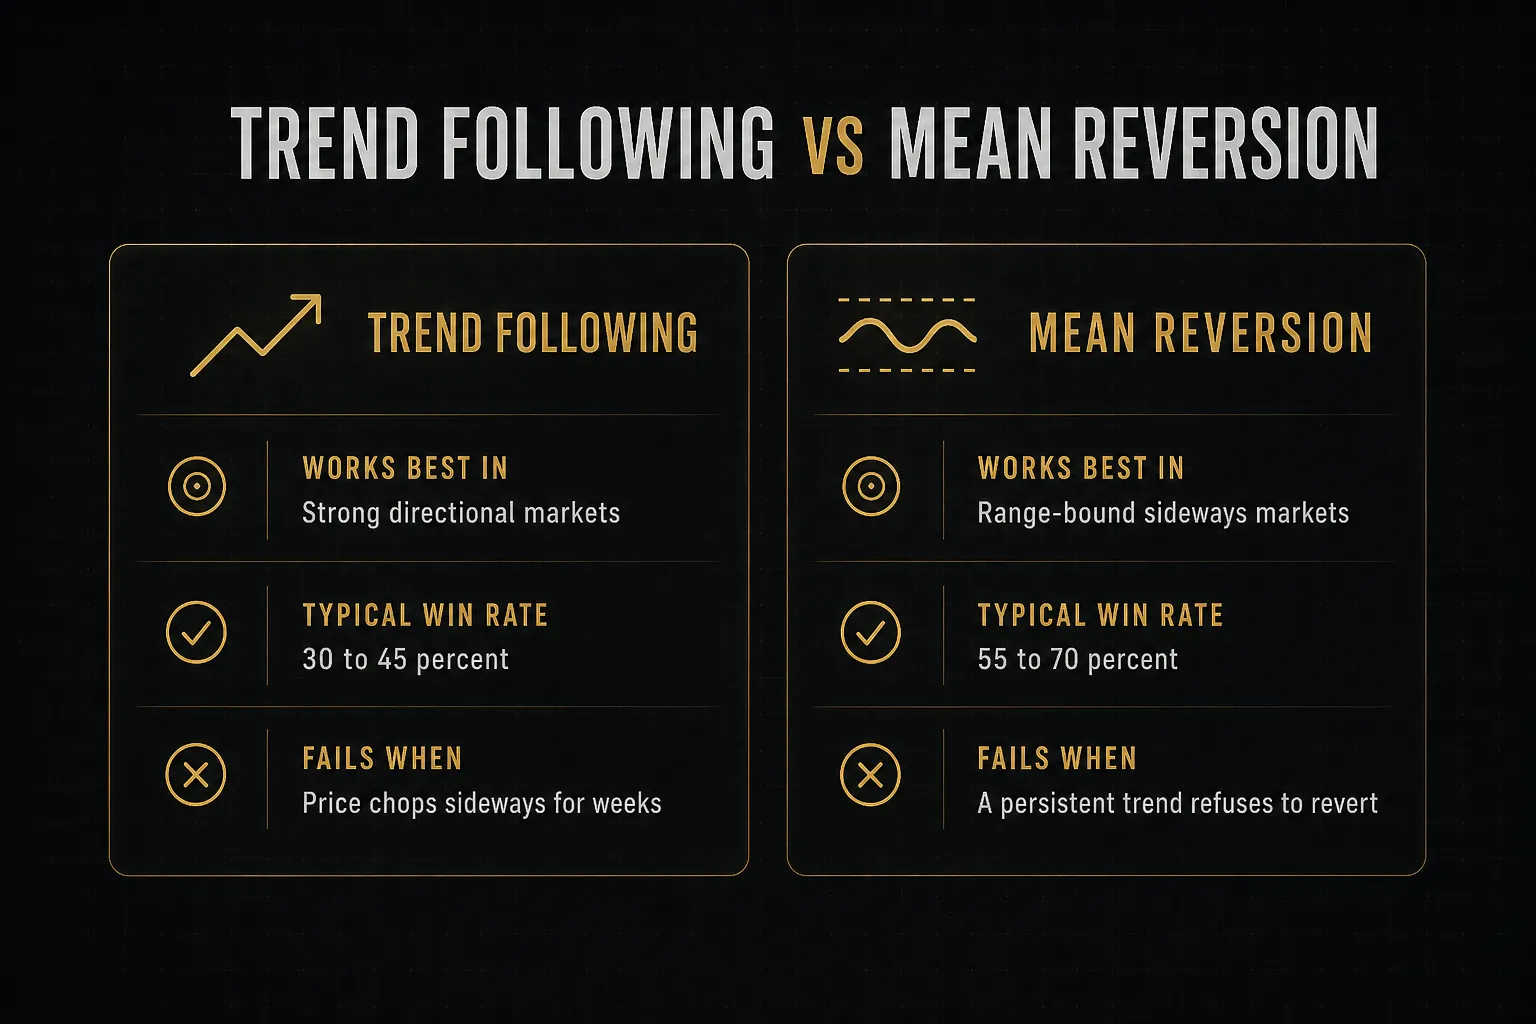
Every strategy makes an implicit bet about market regime, and this is where most of them break.
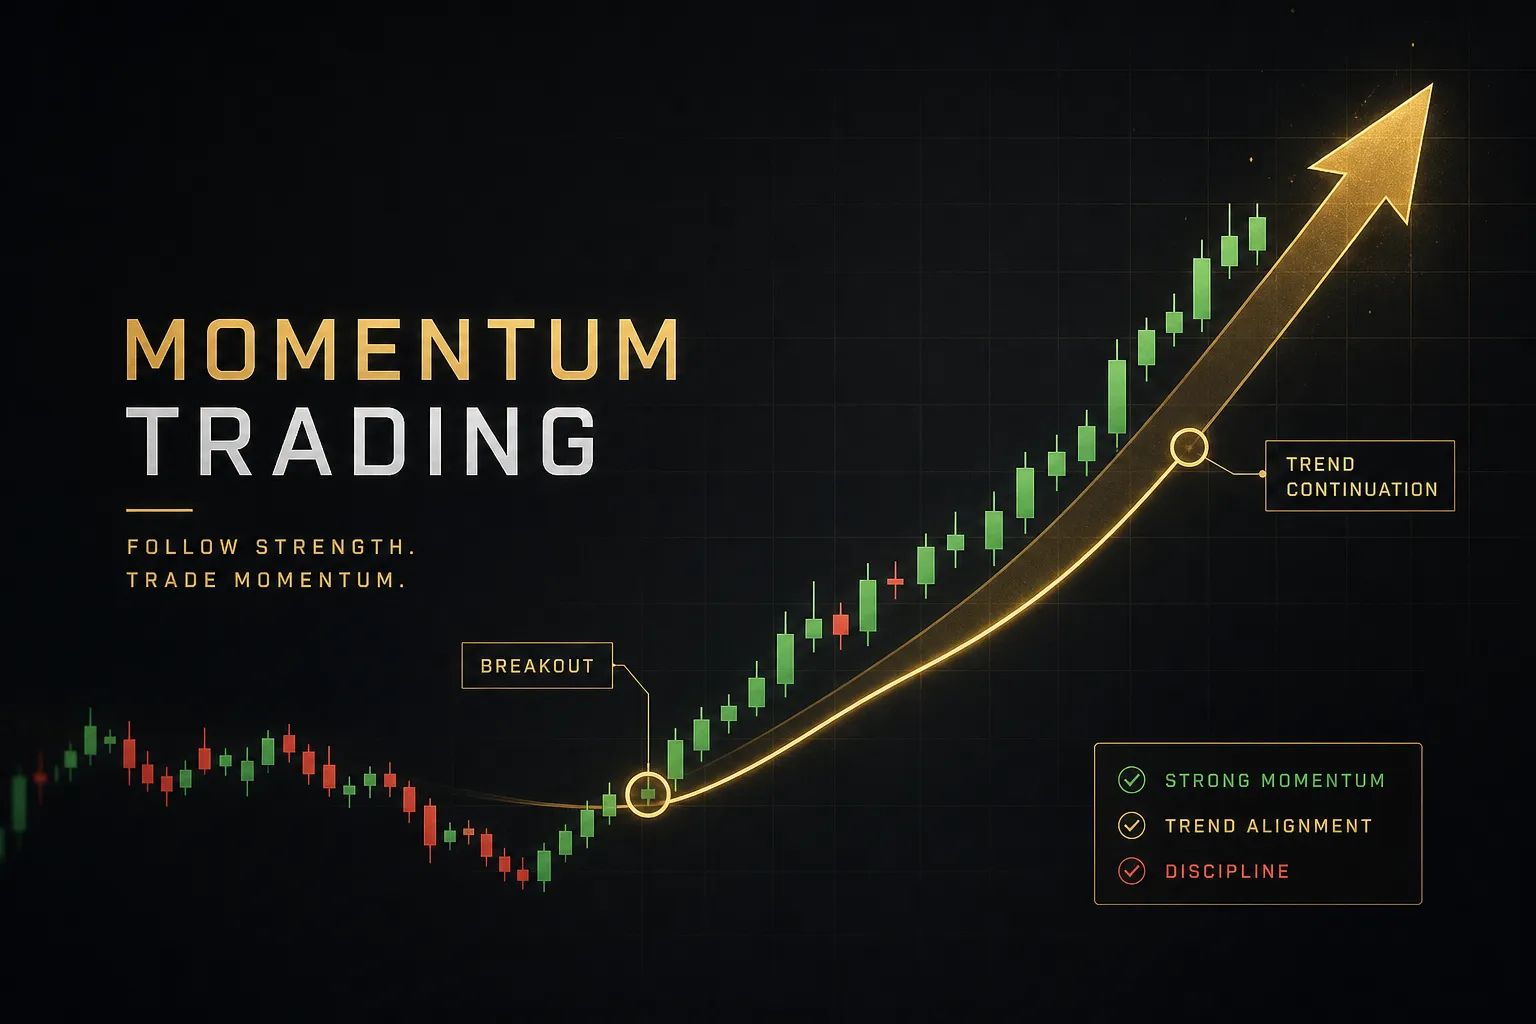
Trend following and breakout trading assume price that has moved will keep moving.
In a sideways market, that assumption produces a brutal cycle: you buy the top of the range, price reverts, you stop out, price breaks the other way, and you get chopped repeatedly.
A trend system in a range can post a 25% win rate for months without anything being wrong with the code.
Mean reversion makes the opposite bet: stretched price snaps back. It prints small consistent wins in a range, then meets a persistent trend and hands back six months of gains in three weeks, because “oversold” kept getting more oversold.
Neither approach is superior.
The skill is knowing which regime you’re in, and the practical tool for that is a volatility or trend filter such as average true range expansion, price relative to a 200-period moving average, or simple higher-high/higher-low structure on the weekly chart.
Building Your Strategy Step by Step
The sequence matters.
Traders who start with the entry trigger and work outward almost always end up with a strategy that has no coherent risk logic, because sizing gets bolted on last as an afterthought.
Build it in this order instead.
Market Selection and Bias
- Choose two or three instruments, maximum. Liquidity, spread, session hours, and typical daily range vary enormously between EUR/USD, small-cap equities, and crude oil futures. Depth beats breadth: knowing how one instrument behaves around news is worth more than watching forty charts.
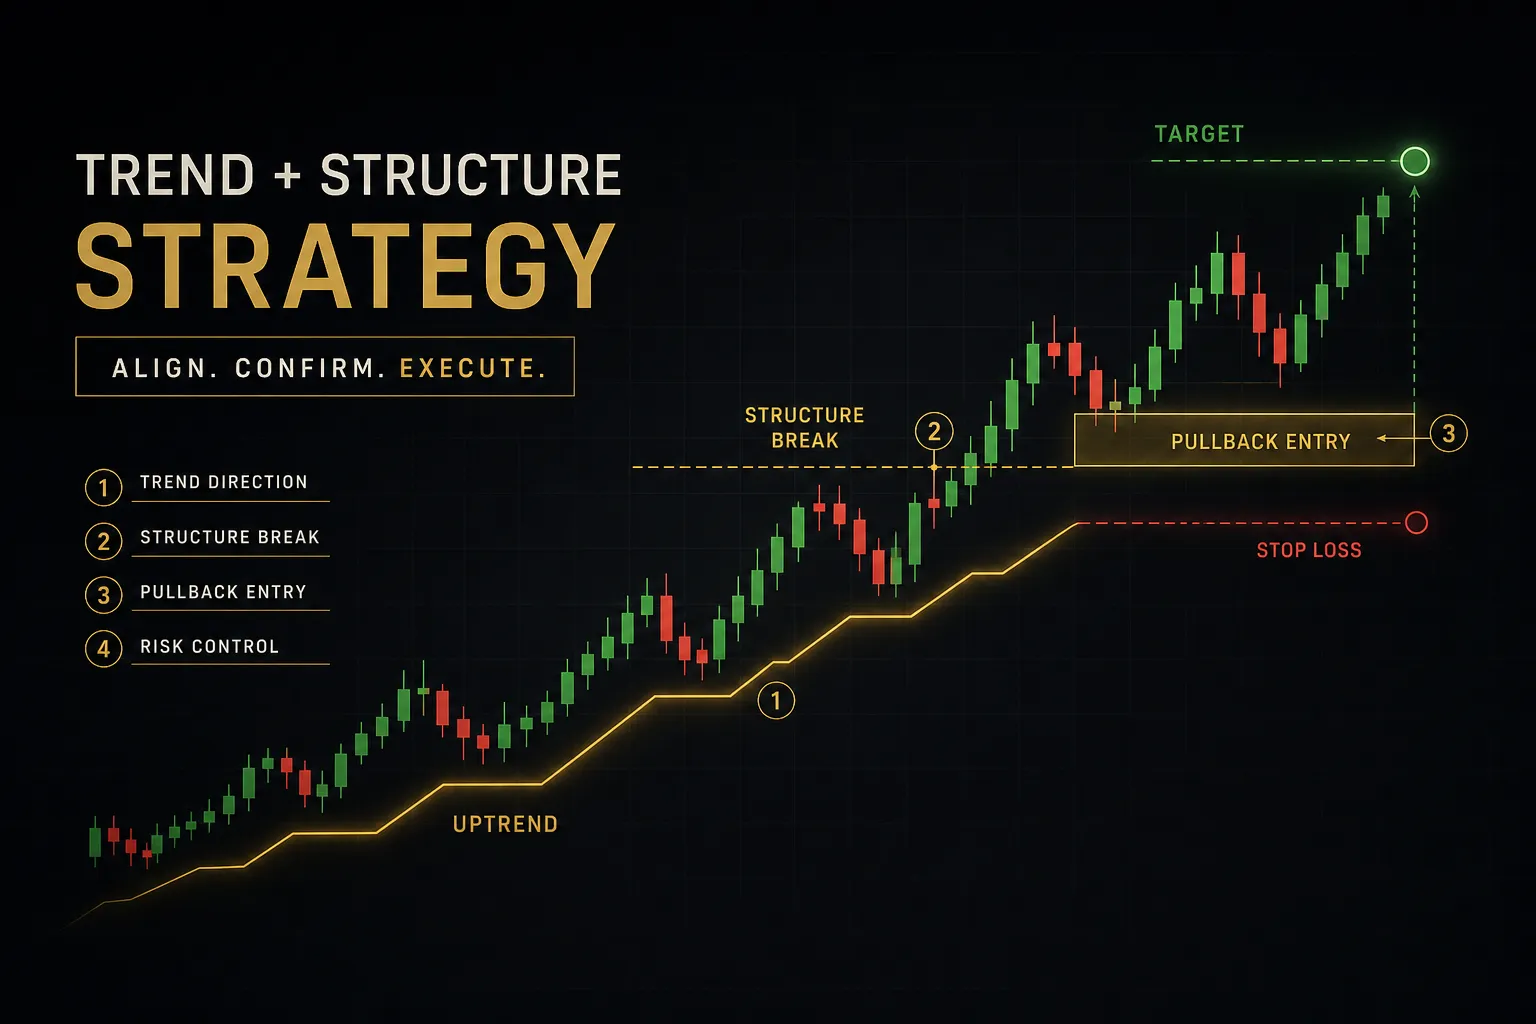
- Set your higher-timeframe context. If you’re a swing trader working off the 4-hour chart, the daily and weekly define the environment. Are we trending, ranging, or expanding in volatility? This single question filters out a large share of low-quality trades.
- Define directional bias with an explicit rule. “Long only when price is above the 200-day moving average and the 20-day is sloping up” is testable. “The market looks bullish” is not. Write the rule so a stranger could apply it.
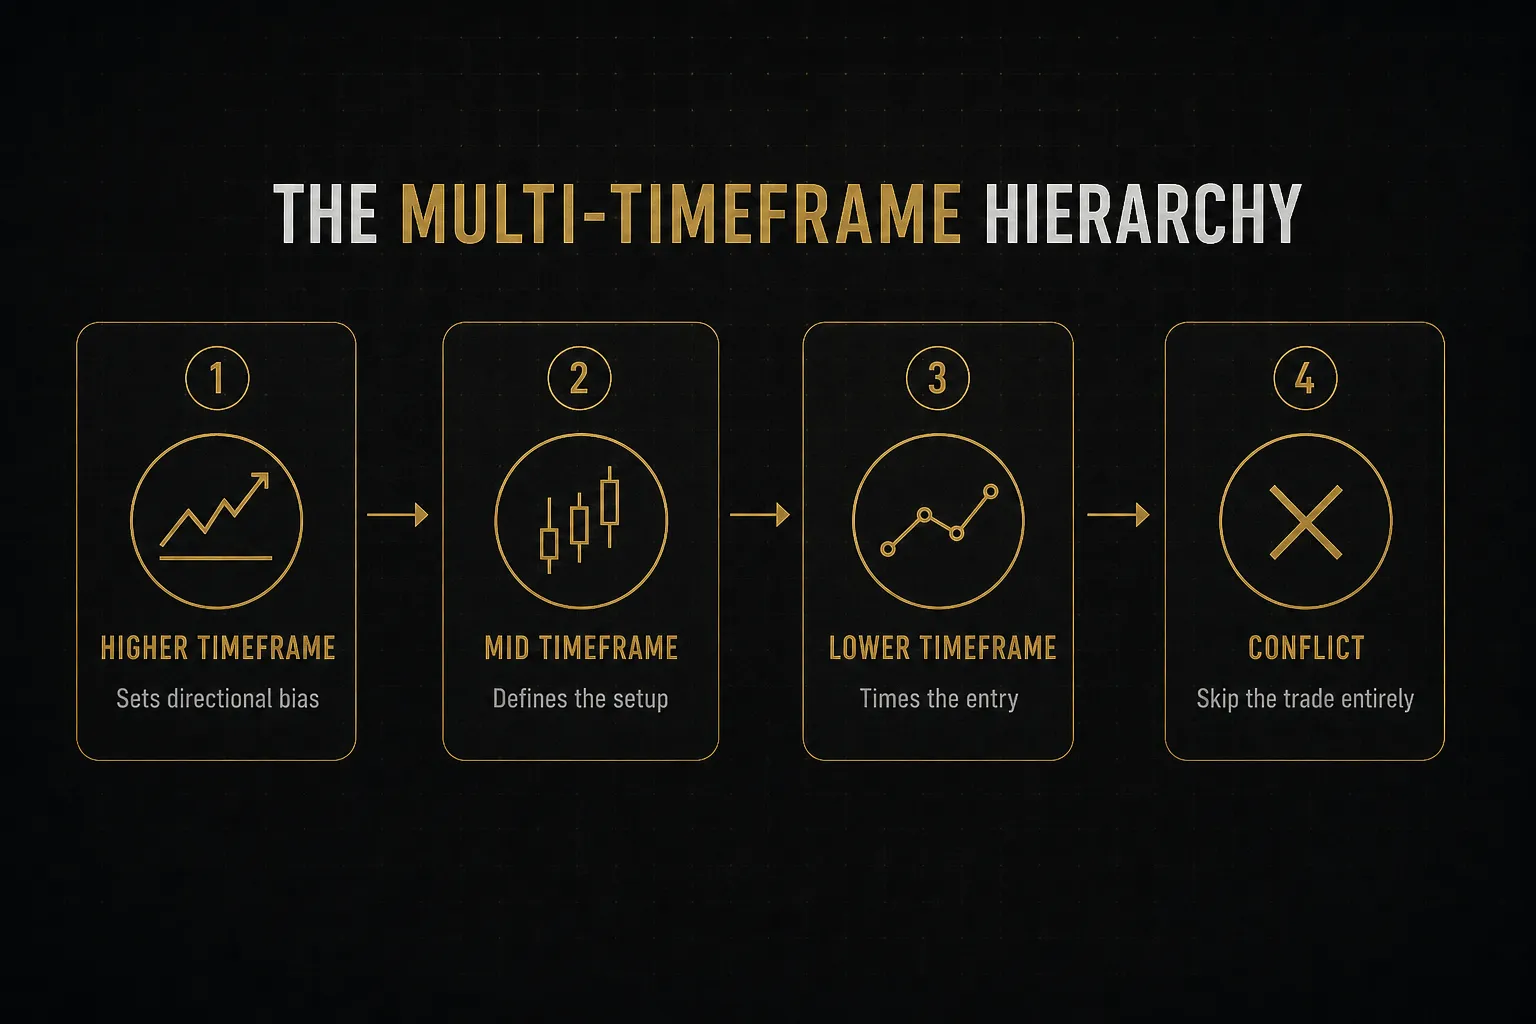
- Apply multi-timeframe analysis as a hierarchy. Higher timeframe sets bias, mid timeframe defines the setup, lower timeframe times execution. When two of the three disagree, you skip the trade rather than pick a favourite.
Entry, Stop, and Exit Rules
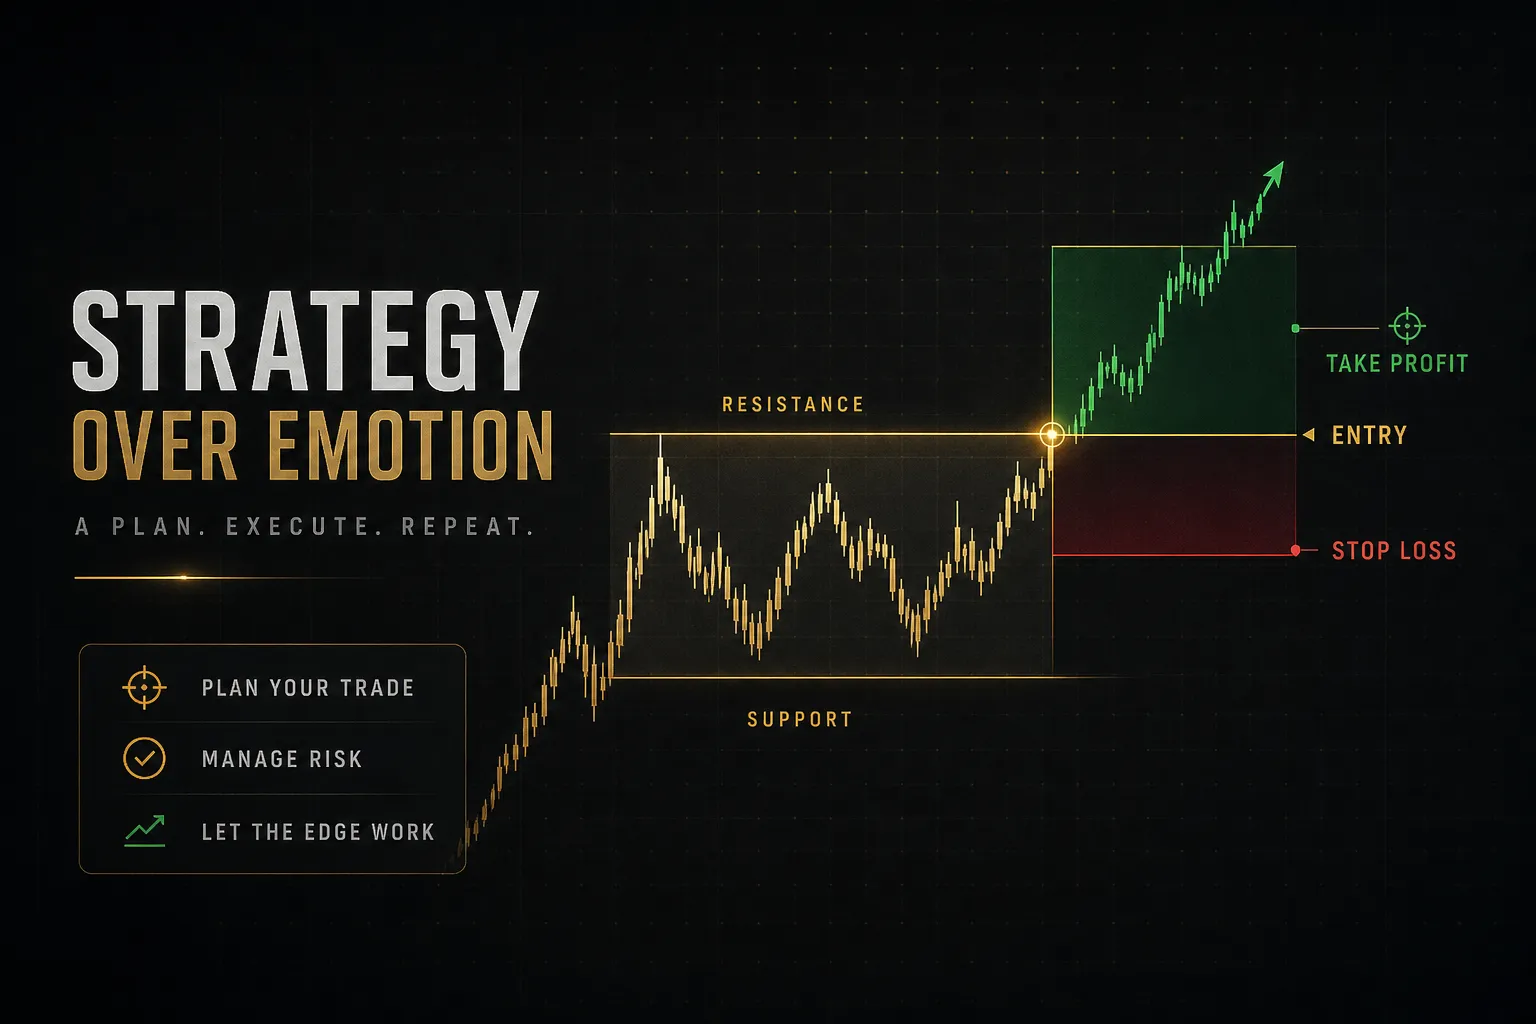
- Specify the entry trigger to the candle. Not “when it looks strong.” Something like: enter on the close of a bullish engulfing candle at a prior support and resistance level, with the order placed one tick above the high. Confirmation on close prevents you from acting on a signal that disappears.
- Place the stop where your thesis dies, then size around it. A stop-loss order belongs below the structural low or beyond an ATR-based buffer, not at a round dollar amount you’re comfortable losing. Distance comes from the chart; risk comes from your position size.
- Define the take-profit target before entry. A take-profit order at the next resistance level, a measured move projection, or a fixed multiple of your stop distance. Deciding this after you’re in the trade guarantees emotion makes the call.
- Write down the invalidation condition separately from the stop. Sometimes the thesis breaks before price hits your stop: the breakout fails to follow through within three candles, volume dries up, or the higher timeframe flips. Exiting early on invalidation is a rule, not a panic.
Trade Management Rules
This is where most written strategies go silent, and it’s the part that determines whether your average win is 1.2R or 2.4R.
- Breakeven stop: define the trigger precisely. Moving to breakeven at +1R is a common rule. Understand the trade-off: it cuts drawdown per trade but increases the number of scratched trades that would have run, sometimes by 15 to 20% of your sample.
- Scaling out: half off at target one, runner to target two. This lowers variance and makes losing streaks psychologically survivable, but it also caps expectancy in trend systems where the outlier winners pay for everything.
- Trailing: use structure or ATR, not intuition. Trail below each successive swing low, or at 2x ATR from the high. The rule must be mechanical enough that you’d apply it identically at 3pm on a Friday.
- Build a no-trade checklist and honour it. Skip the setup if the spread is more than double its normal level, liquidity is thin (holiday sessions, the last hour before a long weekend), a tier-one news release lands within 30 minutes, timeframes conflict, or volatility is more than 2x its 20-day average. The trades you don’t take are part of the strategy.
Position Sizing and Risk Math
Two traders take the identical setup. One finishes the year up 18%, the other down 40%.
Same entries, same exits.
The only difference was size.
Position sizing is the single highest-leverage decision in trading, and it’s arithmetic, not opinion.
- Start with the formula. Position size = (account equity × risk %) ÷ (stop distance × point value). Everything else follows from it.
- Work a real example. Account equity is $25,000. Risk is 1%, so $250. You’re buying a stock at $48.20 with a stop at $46.70, a stop distance of $1.50. Position size = $250 ÷ $1.50 = 166 shares. That’s a $8,001 position controlling exactly $250 of risk.
- Adjust for the instrument’s point value. On a forex pair where a mini lot is $1 per pip and your stop is 25 pips away, $250 ÷ (25 × $1) = 10 mini lots. On an instrument with a $50 point value and a 4-point stop, $250 ÷ (4 × $50) = 1.25 contracts, which you round down to 1.
- Round down, always. Fractional contracts don’t exist, and rounding up quietly turns your 1% rule into a 1.3% rule across hundreds of trades.
- Recalculate as equity changes. Fixed-fractional sizing means the dollar risk shrinks in drawdown and grows in profit. That asymmetry is what keeps a losing streak from becoming an account closure.
Risk-to-Reward and Expectancy
A 70% win rate sounds excellent until you see the loser sizes.
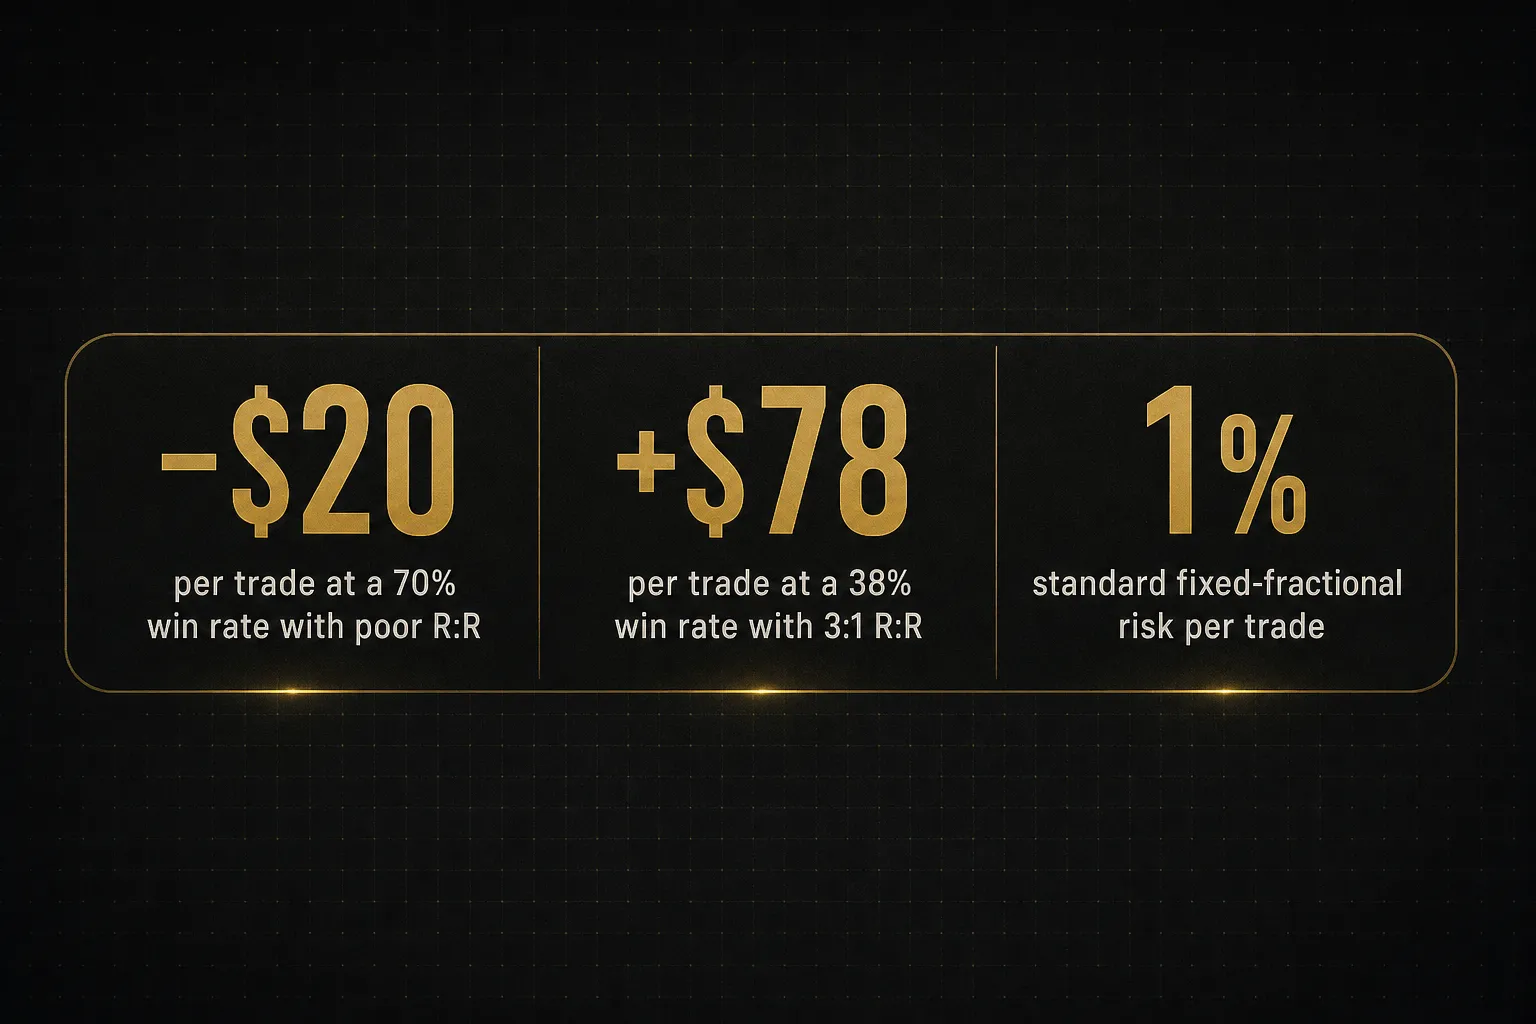
Trade expectancy is the only number that matters: expectancy = (win rate × average win) − (loss rate × average loss) − trading costs. Run it on a system that wins 70% of the time with a $100 average win and a $300 average loss: (0.70 × $100) − (0.30 × $300) = $70 − $90 = −$20 per trade.
Before costs.
That system bleeds out over 200 trades while feeling like it’s working.
Now flip it.
A 38% win rate with a $450 average win and a $150 average loss: (0.38 × $450) − (0.62 × $150) = $171 − $93 = $78 per trade.
Two thirds of your trades lose and the account still climbs.
The risk-to-reward ratio and win rate are two dials on the same machine.
You cannot evaluate either one alone.
The Break-Even Win Rate
For any R:R, there’s a minimum win rate below which you lose money. The formula: break-even win rate = 1 ÷ (1 + R), where R is your reward-to-risk multiple.
| Risk-to-Reward | Break-Even Win Rate (no costs) | Adjusted for 0.15R Costs | Practical Read |
|---|---|---|---|
| 1:1 | 50.0% | 57.5% | Costs are punishing; scalpers live here |
| 1:1.5 | 40.0% | 44.6% | Common day trading target |
| 1:2 | 33.3% | 36.4% | Typical swing trading zone |
| 1:3 | 25.0% | 26.9% | Trend following; expect long losing runs |
| 1:5 | 16.7% | 17.6% | Breakout systems with rare large winners |
Look at the 1:1 row.
Spread, slippage, and commission add roughly 7.5 percentage points to the required win rate, which is why high-frequency approaches fail so often even when the entry logic is sound. At 1:3, the same costs add under 2 points.
On the 1% rule: risking no more than 1% of equity per trade means a ten-trade losing streak costs about 9.6% of the account, recoverable. At 5% per trade, that same streak costs 40%, and you now need a 67% gain to get back to flat.
One caveat worth holding onto.
A fixed reward ratio isn’t right for every market or every volatility condition. Demanding 1:3 in a low-volatility range means your target sits outside the range and never fills.
Let ATR inform the target, and let the target inform whether the trade is worth taking at all.
Testing Before You Risk Real Money
A backtest that shows a smooth equity curve is more likely to be broken than brilliant.
Real strategies look ugly in places.
Minimum requirements before you trust a result: at least 100 trades as a rough baseline sample, ideally 200+ for anything with a win rate under 40%.
Below that, you’re measuring luck.
You also need out-of-sample validation, meaning you develop the rules on one date range and test them, untouched, on a range you never looked at during development.
Then model costs honestly.
Add the real spread for your session, assume slippage of at least half a tick on stops (more on gaps), and subtract commission per side.
Plenty of strategies that look profitable at zero cost are underwater at realistic ones.
Common Backtesting Pitfalls
Look-ahead bias is the most common killer: your test uses information that wasn’t available at decision time, such as the day’s closing price to make an entry decision at 10am. It inflates results dramatically and is easy to introduce accidentally.
Survivorship bias hits equity backtests hardest.
Testing a strategy on the current S&P 500 constituents ignores every company that was delisted or went to zero along the way, which systematically overstates returns.
Data snooping is the slow one.
Test 200 parameter combinations and a few will look spectacular through pure chance.
That’s curve fitting, and it dies the moment it meets live data.
Then there’s the repainting problem.
A signal that appears on a historical chart but recalculates after the fact never existed in real time.
A confirmed, non-repainting signal is locked on candle close and cannot change afterward. If you can’t tell which kind you’re looking at, replay the chart bar by bar and watch whether past markers move.
When Indicators Support, Not Replace, a Strategy
Good tooling makes objective rules easier to follow.
It doesn’t supply the rules.
PipTrend is a useful illustration of that separation, because its design splits the three decisions rather than blending them into one arrow.
Direction comes from the signal itself. Entry comes from marked price levels such as VWAP or supply and demand zones, so the trader has a defined location rather than a vague “buy now.”
Holding period comes from a multi-timeframe table showing whether the shorter and longer horizons agree.
Three separate outputs, three separate decisions, all of which still require you to attach your own stop, size, and management rules. The platform also publishes a verified results page, which is the kind of transparency worth demanding from any signal source before you build rules around it.
An indicator’s job is to make one decision more objective. If it claims to make all of them, treat that as a warning rather than a feature.
Finally, know how to detect decay.
Three signals that a strategy has stopped working: drawdown exceeding your backtested maximum by a meaningful margin, expectancy turning negative over a rolling 50-trade window, or a visible regime shift such as volatility compressing to half its historical norm.
Any one of those means reduce size and re-examine. All three at once means stop trading it.
Frequently Asked Questions
What is the most successful trading strategy?
There isn’t one, and any source claiming otherwise is selling something.
Success depends on matching the strategy to the market regime, your available screen time, and your account size, which is why trend following and mean reversion both produce excellent long-term records in different environments.
The most successful strategy is the one you can execute consistently through a drawdown.
What is the best trading strategy for beginners?
Swing trading a single liquid instrument with a simple trend filter is the most forgiving starting point.
Longer holding periods reduce the impact of spread and slippage, give you time to think before acting, and don’t require watching screens all day, unlike scalping where costs alone can sink a technically sound approach.
Start with one setup, one instrument, and the 1% risk rule.
How do you develop a trading strategy?
Work in the order laid out in section three: market selection, then directional bias, then entry trigger, then stop placement, then trade management, then exit.
Write every rule so specifically that another person could apply it without asking you a question.
Then backtest across 100+ trades with realistic costs, validate out of sample, and forward test on a demo or minimum size before scaling up.
What are the 4 types of trading strategies?
By style, the four categories are scalping, day trading, swing trading, and position or long-term investing, with holding periods running from seconds to years.
By logic, strategies group differently: trend following, momentum trading, mean reversion, and breakout trading.
The style choice determines your cost structure; the logic choice determines which market regime you need.
Can you make money with a trading strategy?
Yes, but profitability comes from positive expectancy sustained over hundreds of trades, not from winning the next one.
The maths in section four is the whole story: (win rate × average win) − (loss rate × average loss) − costs must be positive, and your position sizing must keep you solvent long enough for that edge to show up.
No strategy guarantees profit, and most retail accounts lose money.
What is the 1% rule in trading?
The 1% rule means risking no more than 1% of account equity on any single trade, calculated from your stop distance rather than your position value.
On a $25,000 account, that’s $250 of risk per trade regardless of whether the position is worth $3,000 or $12,000.
It exists because a ten-trade losing streak at 1% costs under 10% of the account, while the same streak at 5% costs 40%.
One jurisdiction note for 2026: verify your broker’s current margin requirements, pattern day trading thresholds, and tax treatment for the current year.
These rules change, and assuming last year’s version still applies is an expensive habit.
Your Strategy Is a Process, Not a Prediction
A trading strategy doesn’t work because it predicts the market correctly.
It works because repeatable rules plus disciplined risk control produce positive expectancy across a large sample, even when a majority of individual trades fail.
Here’s the actionable step for today.
Open a document and write down your current entry and exit rules as explicit, testable conditions, the kind a stranger could follow without calling you.
Most traders discover in that exercise that two or three of the five components were never actually defined.
Then test those rules on 30 to 50 historical trades before risking capital.
It’s tedious.
It’s also the cheapest tuition available.
And when the losing streak comes, and it will, remember that drawdowns are built into the arithmetic.
A system with a 40% win rate produces a five-trade losing run roughly every 13 trades.
That’s not failure.
That’s the system working exactly as designed.
Risk Disclaimer: Trading involves risk. Past performance doesn't guarantee future results. Only trade with money you can afford to lose. PipTrend is a tool to assist your trading decisions, not financial advice.