Momentum Trading Explained: A Beginner's Guide
On this page
What Momentum Trading Really Is
Price that is already moving fast tends to keep moving fast, at least for a while.
That single observation is the entire foundation of momentum trading.
The mechanics are simple to state: you buy assets showing strong recent price strength and sell or short those showing weakness, betting the existing move continues over the next few hours, days, or weeks.
You are not trying to buy cheap. You are trying to buy strong.
That distinction trips up almost every beginner who arrives from a value-investing background.
There’s also a naming problem worth clearing up early.
Momentum investing is an academic factor, documented across decades of market data, where portfolios of the top-performing stocks over the prior 6 to 12 months are held for several months at a time. Momentum trading, the chart-based version most retail traders mean, operates on a horizon of minutes to a few weeks and leans heavily on price action, volume confirmation, and support and resistance.
Same underlying effect.
Wildly different execution, holding period, and cost profile.
This guide covers the full picture: how momentum differs from trend following and reversal trading, what the common indicators actually measure (and where they lag), a repeatable entry-to-exit workflow, the position sizing math with worked numbers, the transaction costs that quietly eat returns, the psychological traps specific to fast markets, and a real backtesting checklist.
An indicator system supports decisions. It does not predict outcomes. Any tool, framework, or setup described here changes the quality of your process, not the certainty of your result.
Keep that framing and everything else in this guide makes more sense.
Momentum Trading vs Trend Following vs Reversal
Three traders can look at the same chart and take three completely different, entirely valid trades.
The difference isn’t the chart. It’s the strategy family they belong to.
Momentum vs Trend Following vs Reversal
Trend following rides trends that are already established, often for weeks or months. Stops sit wide, win rates are low (frequently 30 to 40 percent), and profitability depends on a handful of large winners paying for many small losses.
Momentum trading enters earlier and tighter. You’re targeting the sharp part of a recent move, sometimes before a full trend has formed, and you accept a shorter holding period in exchange for a tighter stop and a faster read on whether you were right.
Reversal trading does the opposite of both. It fades exhaustion, selling into a decelerating rally or buying into a capitulation flush, and it requires the most precise timing of the three.
A momentum trader and a reversal trader can be looking at the exact same extended rally.
One sees continuation. The other sees a top.
Both can be right on different timeframes.
Time Horizons Across Markets
Holding period drives everything else: position sizing, cost sensitivity, and how much noise you have to tolerate.
- Intraday momentum runs minutes to hours. Common in index futures, large-cap stocks around news, and major forex pairs during the London and New York session overlap. Spread and slippage matter enormously here.
- Swing momentum runs two days to two weeks. This is where most retail stock and crypto momentum trading lives, using daily charts with 4-hour or 1-hour entries.
- Momentum investing runs three to twelve months, rebalanced periodically, based on relative strength rankings rather than individual chart setups.
Crypto compresses these horizons.
A move that takes three weeks in equities can complete in three days in a mid-cap token, with volatility expansion that punishes standard stop placement.
Forex sits in the middle, with momentum often tied to session opens and scheduled macro releases.
Momentum vs Acceleration
Here’s the concept that separates competent momentum traders from beginners: momentum measures the speed of price change, acceleration measures whether that speed is increasing or decreasing.
Think of a car.
Momentum is the speedometer reading. Acceleration is whether your foot is still on the gas.
A stock can rally 4 percent on Monday, 3 percent on Tuesday, 1.5 percent on Wednesday, and 0.5 percent on Thursday. On a price chart, that looks like four green days and a beautiful uptrend.
The rate of change is still positive.
But acceleration has been negative all week, and the MACD histogram would be shrinking even as price makes new highs.
That’s a decelerating rally.
Strong on price alone.
Exhausted underneath.
Entering a decelerating, overextended move because it “looks strong” is the single most common beginner error in momentum trading.
The move already happened.
You’re buying the last 10 percent of it while accepting the risk of the full retracement.
The practical fix: check whether each successive push is larger or smaller than the last, and whether pullbacks are getting shallower or deeper.
Shortening pullbacks with expanding pushes means acceleration is intact.
The reverse means you’re late.
How to Spot Real Momentum
Most traders don’t have an indicator problem.
They have a redundancy problem, and it feels like confirmation.
What Indicators Actually Measure
Every popular momentum tool answers a specific question. Knowing which question keeps you from asking the same one four times.
- Relative strength index (RSI) measures the speed and magnitude of recent price changes on a 0 to 100 scale. It answers “how fast has this moved relative to its own recent range?” In a strong trend, RSI can sit above 70 for weeks, which is why “overbought” is a terrible sell signal in momentum contexts.
- MACD compares two exponential moving averages to flag shifts in trend and momentum. The MACD histogram is the acceleration read: shrinking bars mean the move is losing steam even if the line is still positive.
- Moving averages measure direction and slope. Moving average alignment (say, 20 above 50 above 200, all sloping up) is a clean regime filter, but it lags by design because it averages the past.
- Average directional index (ADX) measures trend strength without direction. Readings above 25 typically indicate a trending market; below 20 suggests chop where breakout trading fails more often.
- Volume measures participation, and it’s the only one on this list that isn’t derived from price. That independence is exactly what makes it useful.
- Average true range (ATR) measures volatility, which you need for stop placement, not signal generation.
When Signals Conflict or Repeat
Stacking RSI with a stochastic oscillator feels like getting two opinions.
It isn’t.
Both are computed from the same closing prices over similar lookbacks, so they agree most of the time by construction.
That false agreement is dangerous.
It converts a single data point into what feels like a consensus, and it reliably feeds confirmation bias.
You end up with more conviction and no more information.
When signals genuinely conflict, resolve them with a hierarchy rather than a vote:
- Higher-timeframe direction wins. If the daily is trending up and the 15-minute oscillator says overbought, the 15-minute is describing noise inside a larger move.
- Use an independent tiebreaker. Volume, market structure, or volume-weighted average price (VWAP) position tell you something price-derived oscillators cannot.
- Never add a fourth oscillator to break a tie. Ambiguity is information. It usually means stand aside.
Turning Signals Into a Process
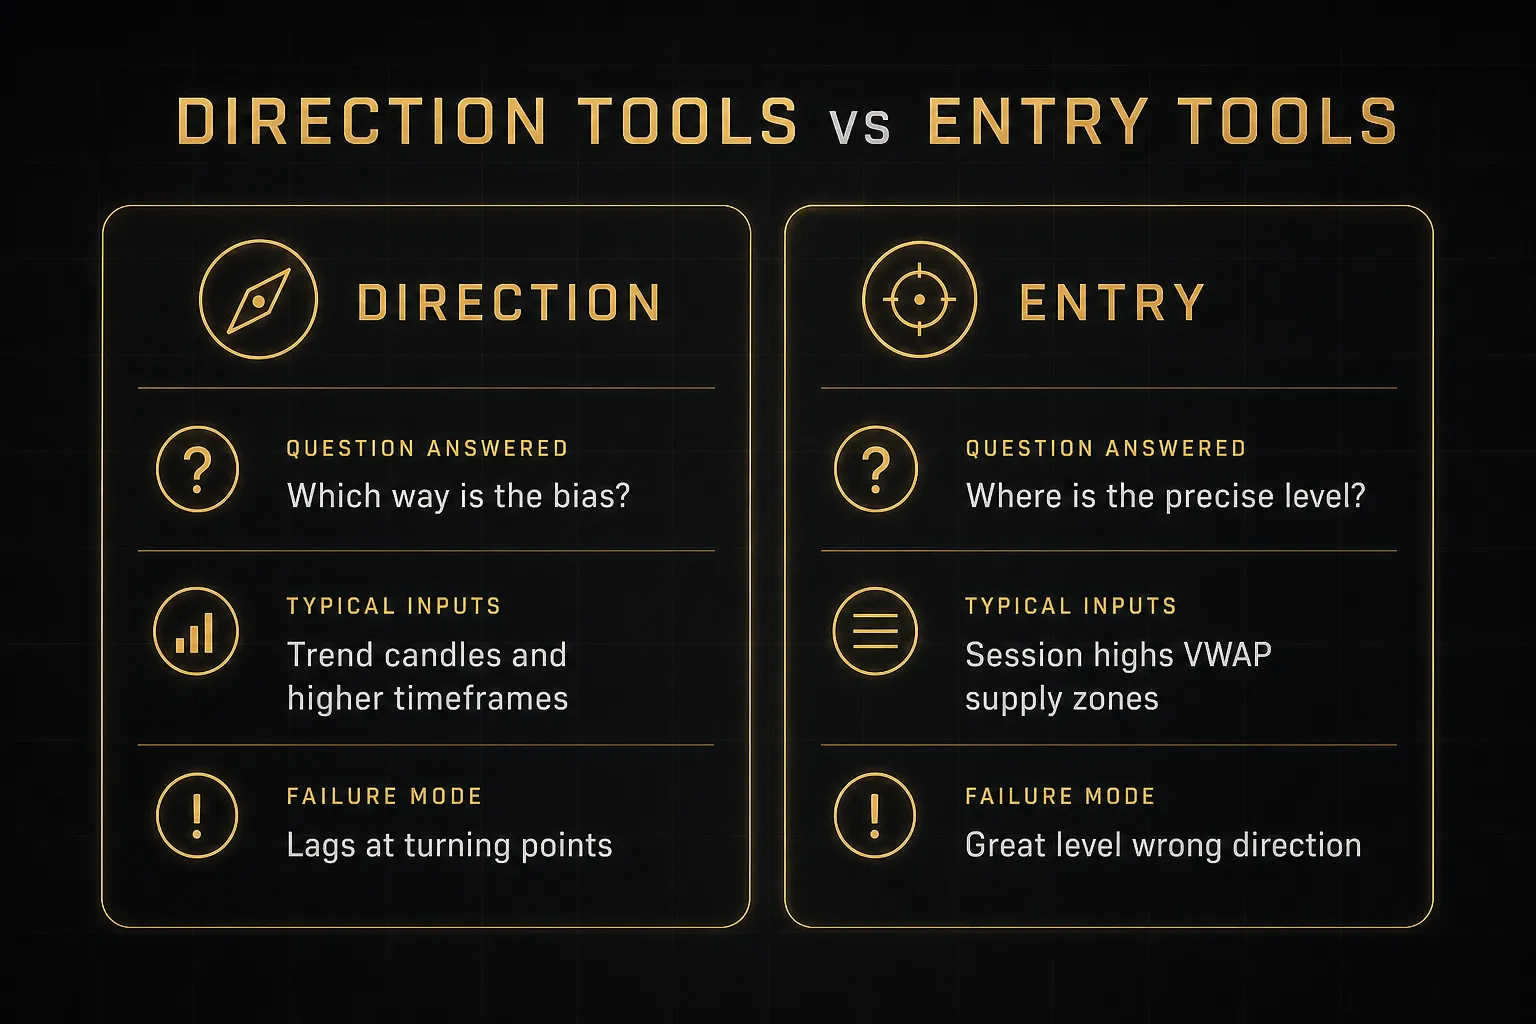
A useful decision-support framework separates two questions that beginners tend to merge: which direction and where exactly do I enter.
PipTrend’s design illustrates the separation.
Direction is handled by color-coded trend candles with a whipsaw filter that suppresses signals in choppy conditions. Entry is handled independently through session highs and lows, VWAP, and supply and demand zones.
Confirmation comes from a 12-timeframe alignment table that shows at a glance whether the 1-minute through monthly views agree.
The value isn’t prediction. It’s noise reduction and consistency: the same questions, asked in the same order, on every trade.
Strong Momentum Isn’t a Guaranteed Setup
A stock up 18 percent in four sessions on triple average volume has undeniable momentum. It may still be a terrible trade.
Why? Because if the nearest logical stop sits 9 percent below your entry and the next resistance sits 3 percent above, your risk-reward ratio is roughly 1:0.33.
No win rate saves that math over a large sample.
Momentum tells you what to watch. Structure tells you whether to trade it.
The best momentum setups pair strong relative strength with an entry that sits close to a defensible level, so the stop is tight and the runway is long.
A Repeatable Momentum Workflow
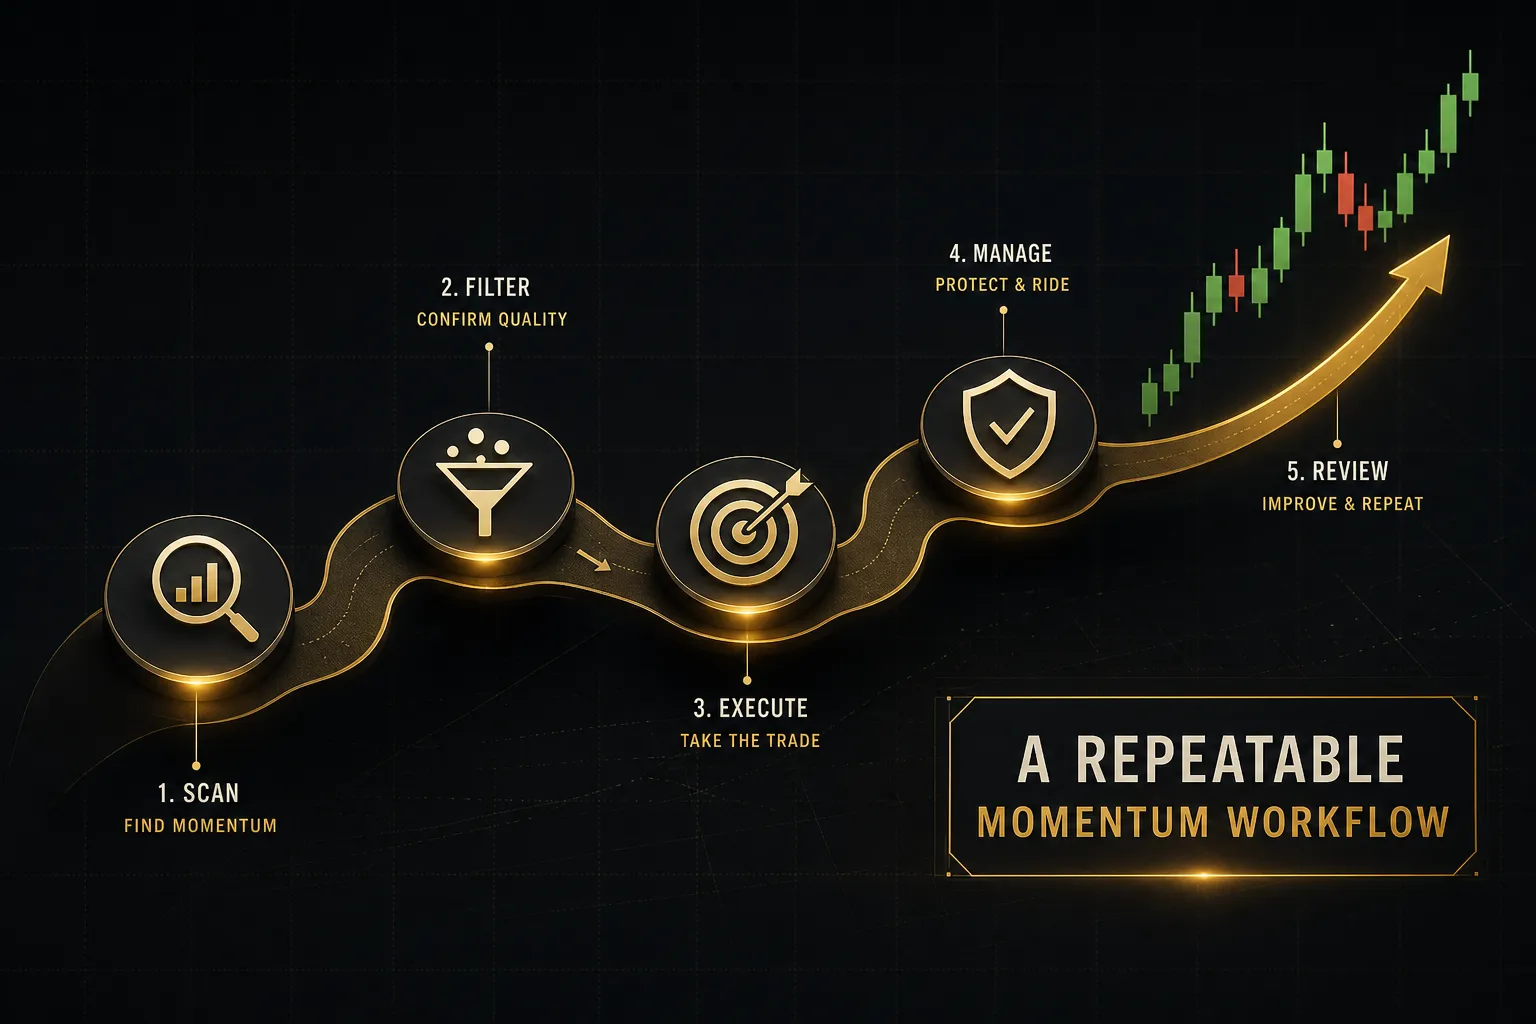
Discretionary momentum trading fails not from bad ideas but from inconsistent execution.
A fixed sequence fixes that.
Run these three steps, in order, on every candidate.
Confirm Market Regime and Bias
- Classify the market regime first. Before looking at any single chart, decide whether the broader market is trending, range-bound, news-driven, or in a low or high volatility state. Momentum setups have a materially higher failure rate in range-bound, low-volatility conditions where breakouts revert to the mean.
- Check volatility explicitly. Compare current ATR to its 20-period average. Rising ATR with directional price supports momentum entries; compressed ATR with directionless price is a warning that any breakout may be liquidity-driven noise.
- Set higher-timeframe bias before entries. On a daily chart, note moving average alignment and whether the last three swings made higher highs and higher lows. Write the bias down (long, short, or none) and refuse to take counter-bias trades that session.
- Screen for relative strength, not absolute moves. Rank candidates against a relevant index or sector. An asset up 3 percent while its sector is flat is showing genuine relative strength; up 3 percent while the sector is up 4 percent is a laggard dressed as a winner.
Choose Breakout, Pullback, or Stand Aside
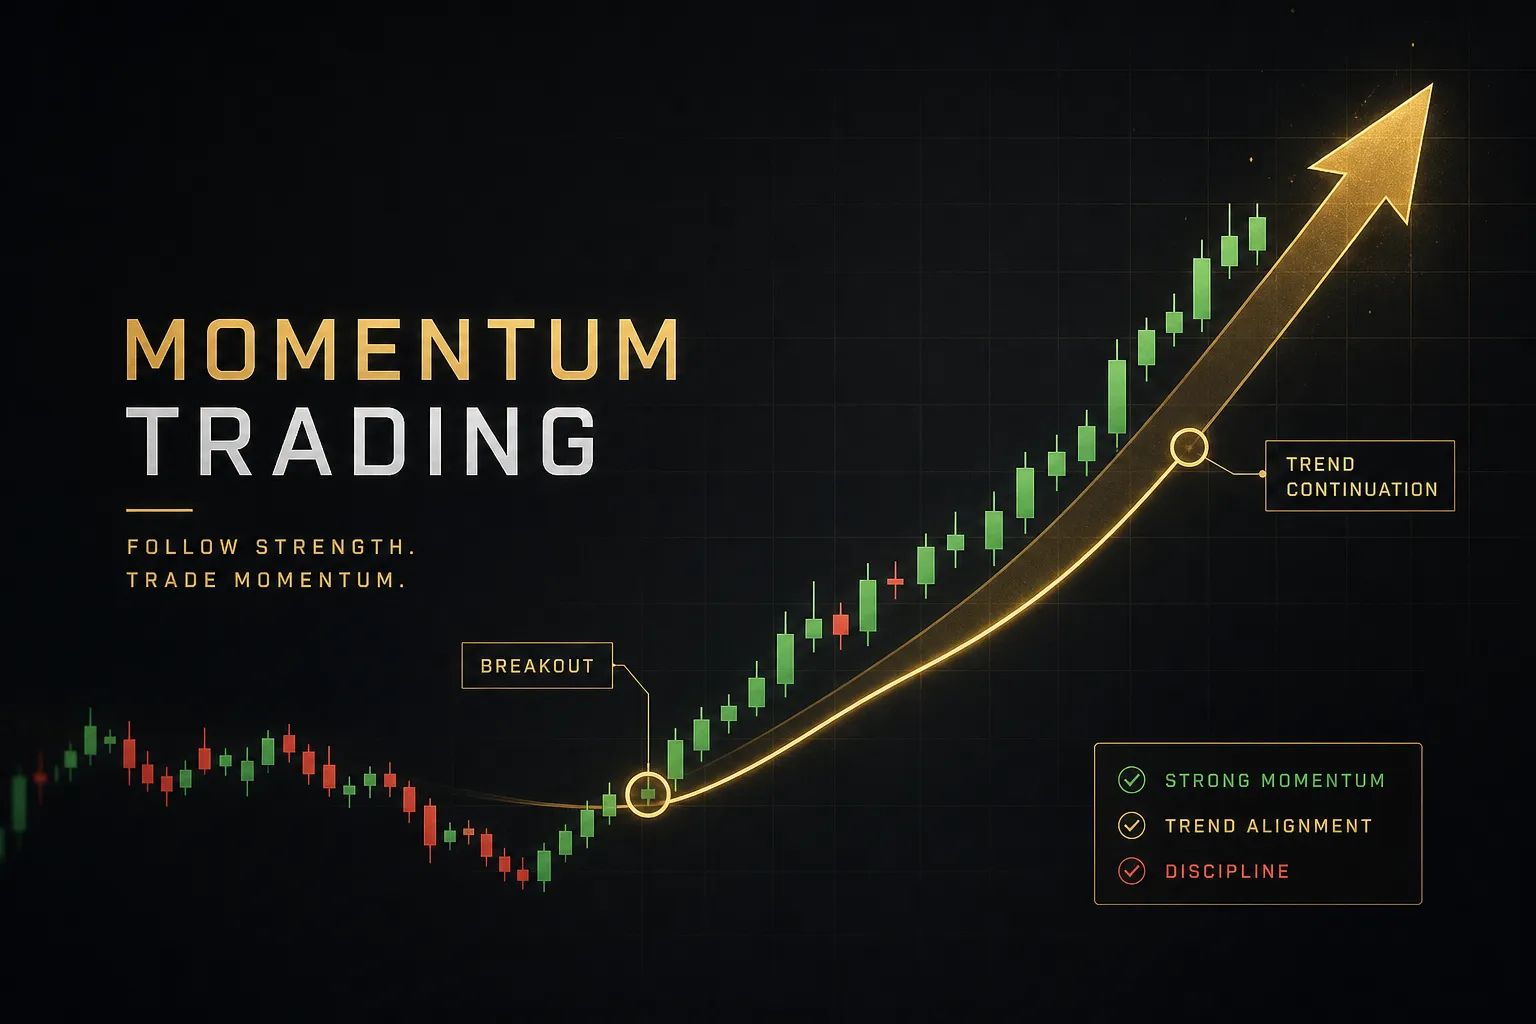
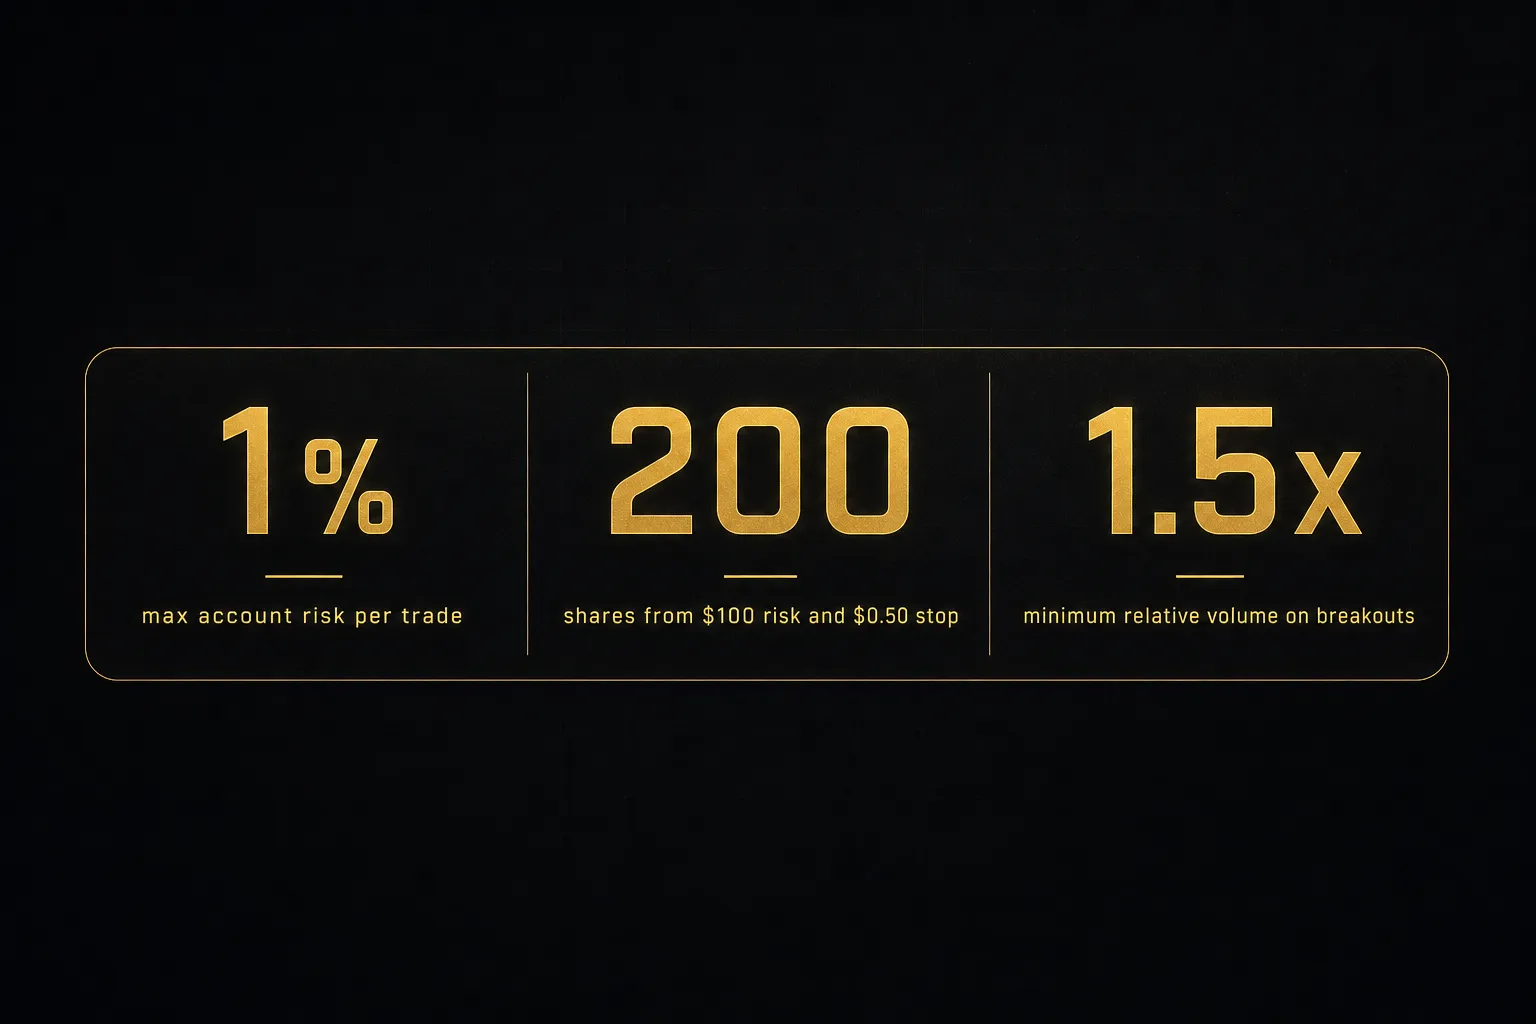
- Trade the breakout only with confirmation. Require both a volatility contraction preceding the move (narrowing range, declining ATR) and a volume expansion on the break itself, typically relative volume above 1.5x the recent average. Contraction then expansion is the pattern; expansion without prior contraction is often a false breakout.
- Take a pullback entry when price is extended. If the asset has already moved three or more ATRs from its base, do not chase. Wait for a retest of the breakout level, a prior swing high, or VWAP, and enter on evidence that sellers failed there.
- Favor continuation patterns over first candles. A flag, a tight consolidation, or a shallow pullback after the initial thrust typically offers a tighter stop and better risk-reward than buying the breakout candle at its high. You give up a small amount of move to gain a large amount of clarity.
- Stand aside when structure is unclear. If the level is messy, the prior range had multiple failed breaks, or news is pending within the holding period, take no trade. Standing aside is a position, and it costs nothing.
Set Stops and Size the Position
- Place the stop where the idea is wrong, not where the loss feels tolerable. Use the recent swing point beyond market structure or a multiple of ATR (commonly 1.0 to 2.0x). An arbitrary “2 percent stop” ignores the instrument’s actual volatility and gets hit by noise.
- Define account risk per trade as a fixed percentage. Most disciplined traders use 0.5 to 1 percent of equity. This is the number that controls maximum drawdown, not your win rate.
- Calculate size from risk, never from conviction. Position size equals dollar risk divided by per-unit risk. The formula is identical across every asset class; only the unit changes.
- Work the example. A $10,000 account risking 1 percent has $100 of risk. Entry at $50.20, stop at $49.70, gives $0.50 of risk per share. $100 divided by $0.50 equals 200 shares, a $10,040 notional position that risks exactly $100.
- Translate to forex. Same $100 risk on EUR/USD with a 25-pip stop: on a standard lot, one pip is roughly $10, so 25 pips risks $250. Too big. Scale to 0.4 lots, where one pip is $4, and 25 pips risks $100.
- Translate to crypto. Same $100 risk with entry at $2,400 and stop at $2,280 gives $120 of risk per coin. $100 divided by $120 equals 0.83 coins, a roughly $2,000 notional position. Note that leverage never changes the risk math; it only changes the margin required.
- Check risk-reward before committing. Measure the distance to the next logical resistance or target. If the ratio is below 1.5:1, the setup is not worth the transaction costs and the emotional load.
Costs, Psychology, and Testing Your Edge
A strategy that looks profitable on a clean chart can be a losing business once you add the bill. Momentum trading is unusually exposed here because it trades often and enters during fast markets.
What Spreads, Slippage, and Gaps Cost You
Every friction point below compounds with trade frequency. A strategy taking 200 trades a year feels these ten times harder than one taking 20.
- Spread is paid on entry and exit. A 2-pip spread on a 25-pip target consumes 8 percent of the gross move before anything else. In thinly traded stocks or exotic pairs, spreads can widen three to five times during the exact volatility expansion momentum traders are hunting.
- Commission is often the smallest cost per trade and the largest cost per year. At $5 round-trip on a $100 risk budget, you’re surrendering 5 percent of your risk unit to fees on every single position.
- Slippage and transaction costs hit hardest on stop orders and breakout entries. Market orders placed into a fast break routinely fill 0.2 to 0.5 percent worse than the trigger price, and stop-loss fills in gapping markets can be far worse than the level you set.
- Leverage doesn’t increase your edge. It multiplies both outcomes and shrinks the drawdown you can survive before a margin call forces the decision for you.
- Overnight gaps break stop-loss assumptions entirely. A swing momentum position in a stock reporting earnings can open 12 percent below your stop, turning a planned 1 percent loss into 4 percent.
- Liquidity is the multiplier on all of the above. In fast markets, order books thin out precisely when you most want to exit, so trade instruments with genuine depth rather than the biggest percentage gainer on the screener.
FOMO, Revenge Trades, and Moved Stops
Momentum trading attacks a specific set of psychological weaknesses, because the strategy requires you to buy things that are already up and hold them while they’re volatile.
- FOMO entries after the move has run. The setup you were watching breaks out while you hesitate, so you buy 3 percent higher with a stop that no longer makes structural sense. Same idea, half the reward, double the risk.
- Revenge trading after a stopped-out breakout. A false breakout takes your stop, price then reverses in your original direction, and you re-enter at worse levels in double size to “get it back.” This is where single-trade losses become account-level events.
- Widening stops mid-trade. Moving a stop away from price is the only mistake on this list that has no upside case. It converts a defined 1 percent loss into an undefined one and it invalidates every backtest you ran.
- Cutting winners too early. Momentum strategies depend on the right tail. Exiting at 0.8R because unrealized gains feel fragile mathematically guarantees your average win can never pay for your average loss.
- Overtrading a dead regime. When the market shifts to range-bound conditions, momentum setups keep appearing and keep failing. The discipline is to reduce size or stop, not to try harder.
A Real Backtesting Checklist
Backtesting isn’t about finding a curve that goes up. It’s about trying to prove your idea wrong and failing to.
- Split your data and keep out-of-sample untouched. Develop rules on 70 percent of the history, then test once on the remaining 30 percent. If you optimize on out-of-sample data, it becomes in-sample and tells you nothing.
- Run walk-forward validation. Test in rolling windows (optimize on 12 months, trade the next 3, roll forward) so you see how the strategy handles regime change rather than one lucky decade.
- Eliminate survivorship bias. Testing momentum on today’s index constituents excludes every company that got delisted or acquired. Use point-in-time universes or accept that your results are inflated.
- Eliminate look-ahead bias. Never use the day’s close to trigger an entry at the day’s open, and be careful with indicators that repaint. This is the most common silent bug in retail backtests.
- Model realistic spreads and slippage. Apply the wider spread you actually see during volatility expansion, not the average quiet-market spread, and add explicit slippage to every breakout entry.
- Demand adequate sample size. Fewer than 100 trades tells you almost nothing about a momentum system. Aim for 200 or more across at least two distinct market regimes.
- Measure drawdown, not just return. Record maximum drawdown, longest losing streak, and time to recovery. These determine whether you can actually execute the system when it’s underwater.
- Follow with forward testing and a trade journal. Paper trade or trade small, log every entry reason, deviation, and emotional state. Forward results below half your backtest results usually mean an execution or cost assumption was wrong.
Compliance note, current as of 2026: pattern day trader thresholds, margin requirements, and retail leverage limits differ by instrument and jurisdiction, and they change. Confirm the rules that apply to your account with your specific broker and regulator before sizing anything, particularly for CFDs, crypto derivatives, and margin equity accounts.
Momentum Trading FAQ
What is an example of momentum trading?
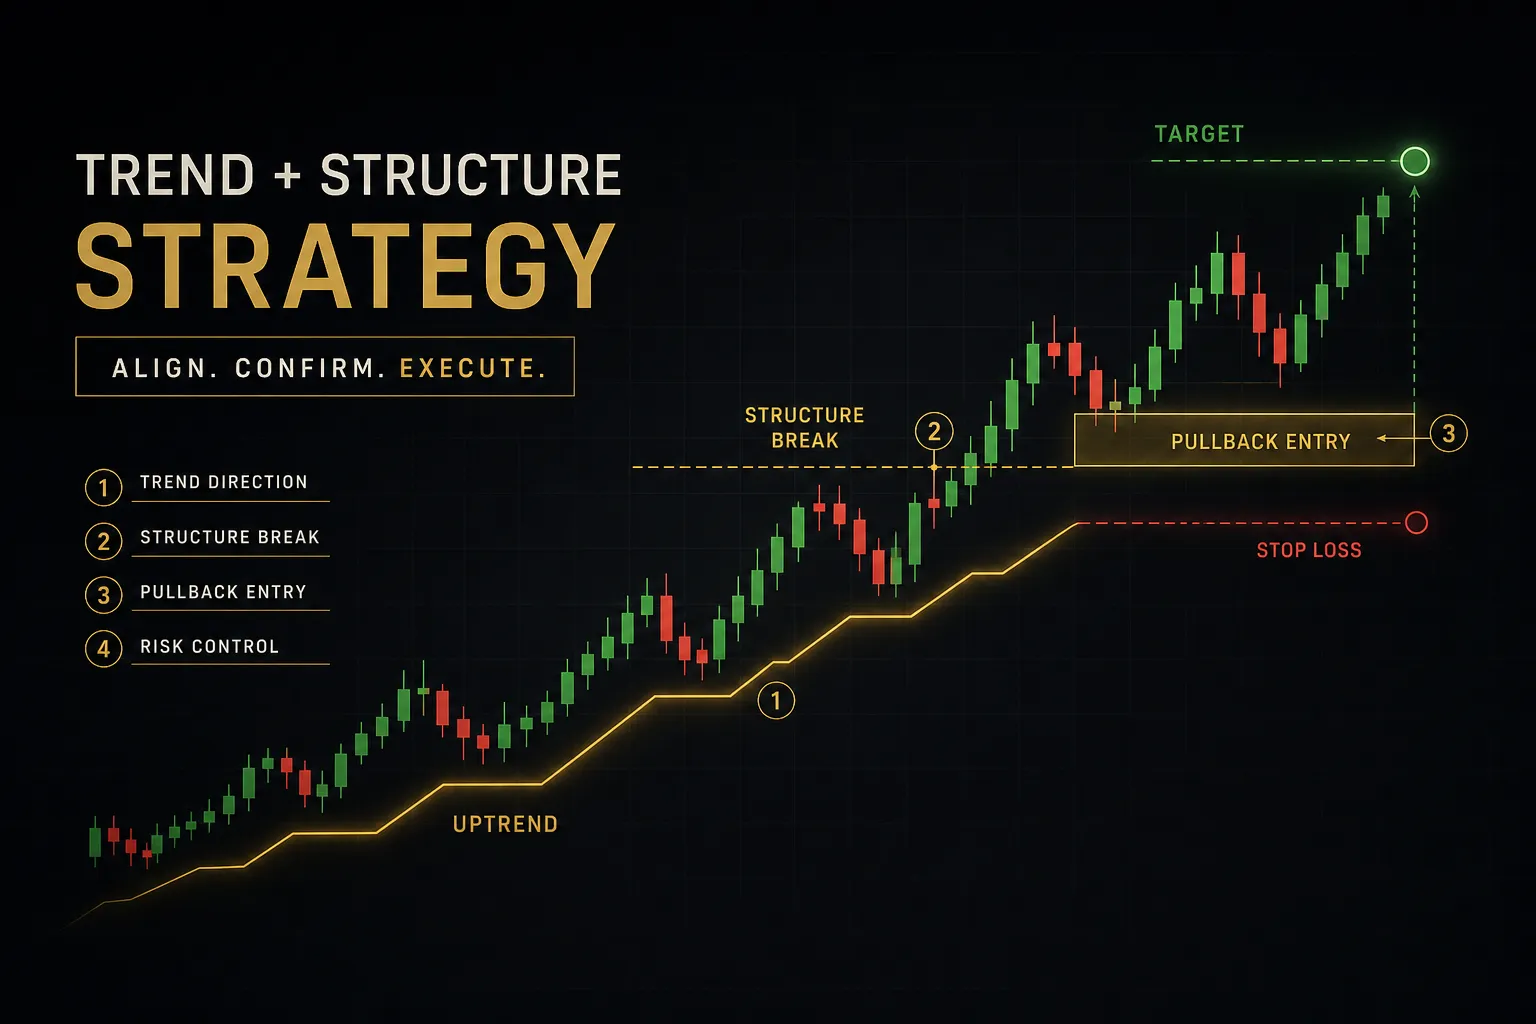
A textbook example: a stock closes above a six-week high on relative volume of 2.3x its average, after three weeks of tightening range. Rather than buying that breakout candle at its high, the trader waits two sessions for a pullback to the breakout level near $50.20, enters there, and places a stop at $49.70, just below the swing low that formed during the retest.
With a $10,000 account risking 1 percent, that’s 200 shares.
The target sits at the next resistance zone around $52.00, giving roughly 3.6:1 risk-reward.
The trade is invalidated the moment price closes back inside the old range.
What is the best momentum indicator?
There is no single best momentum indicator, and any source claiming otherwise is selling something. Effectiveness comes from pairing one direction tool with one independent confirmation, not from finding a superior oscillator.
A practical combination is moving average alignment or trend candles for direction, plus volume confirmation or multi-timeframe agreement as the check. What fails is stacking RSI, stochastics, and rate of change together, since all three are derived from the same price series and will mostly agree by construction.
How do you know if a stock has momentum?
Three signs, in order of reliability. First, rising relative volume, meaning current volume meaningfully exceeds the 20-day average, because volume confirms real participation rather than a thin drift.
Second, a structure of higher highs and higher lows with shortening pullbacks, which indicates acceleration is intact rather than fading. Third, outperformance versus a relevant index or sector over the same window, which is what relative strength actually measures.
If price is rising but volume is falling and pullbacks are deepening, you’re looking at a decelerating move, not momentum.
Is momentum trading a good strategy?
Momentum trading can be profitable, but only with disciplined risk management, honest cost accounting, and a large enough sample to distinguish edge from luck. The momentum effect is one of the most extensively documented anomalies in financial research, so the underlying premise is sound.
Execution is where it breaks.
Frequent trading amplifies spread and slippage, momentum strategies suffer sharp crashes when regimes flip, and the psychological demands of buying strength are genuinely difficult.
Judge your results over 100-plus trades, not 10.
What is the 5-minute momentum trading strategy?
The 5-minute momentum strategy is a short-term intraday approach that trades directional bursts on a 5-minute chart, typically using the session open range, VWAP as a directional reference, and volume spikes as the trigger. A common structure is to wait for the first 15 to 30 minutes to establish a range, then trade breaks of that range in the direction of VWAP with a stop beyond the opposing side.
It is extremely sensitive to spread and slippage. With targets of only 10 to 20 basis points, transaction costs can consume 30 to 50 percent of gross profit, so it only works in highly liquid instruments with tight, stable spreads.
What are the risks of momentum trading?
The dominant risks are false breakouts, rapid reversals, overleveraging, emotional decision-making, and regime shifts. False breakouts are the most frequent, which is why volume and volatility contraction confirmation matters before entry.
Rapid reversals are the most expensive, since momentum names retrace violently and gaps can jump your stop.
Overleveraging turns a normal losing streak into an account-ending one.
And regime shift is the quietest risk of all: a setup that worked for eight months can stop working entirely when volatility conditions change, which is why tracking rolling performance in a trade journal matters as much as finding the setup did.
Making Momentum Trading Work for You
Strip everything above down and the decision logic fits in three lines.
Trade breakouts only when volume expansion and prior volatility contraction both confirm.
Wait for a pullback entry or continuation pattern when price is already extended.
Stand aside when the market regime or the structure at your level is unclear.
Everything else, the indicators, the timeframes, the platforms, is in service of those three decisions.
Your concrete next step: pick one well-defined setup, write its rules down including entry trigger, stop placement, and target, then paper trade or trade minimum size for at least 20 to 30 trades before you scale risk.
Log each one.
Twenty trades won’t prove an edge, but they will expose whether you can actually follow your own rules under pressure, which is the real question at this stage.
Tools help structure the work.
PipTrend’s separation of directional signal from entry level, plus its multi-timeframe alignment table, gives you a consistent order of operations instead of a fresh improvisation on every chart.
That consistency is genuinely valuable.
But no indicator determines your results.
Position sizing, cost discipline, and the willingness to stand aside do that.
Momentum gets you into the right assets; risk control is what keeps you trading them next year.
Risk Disclaimer: Trading involves risk. Past performance doesn't guarantee future results. Only trade with money you can afford to lose. PipTrend is a tool to assist your trading decisions, not financial advice.