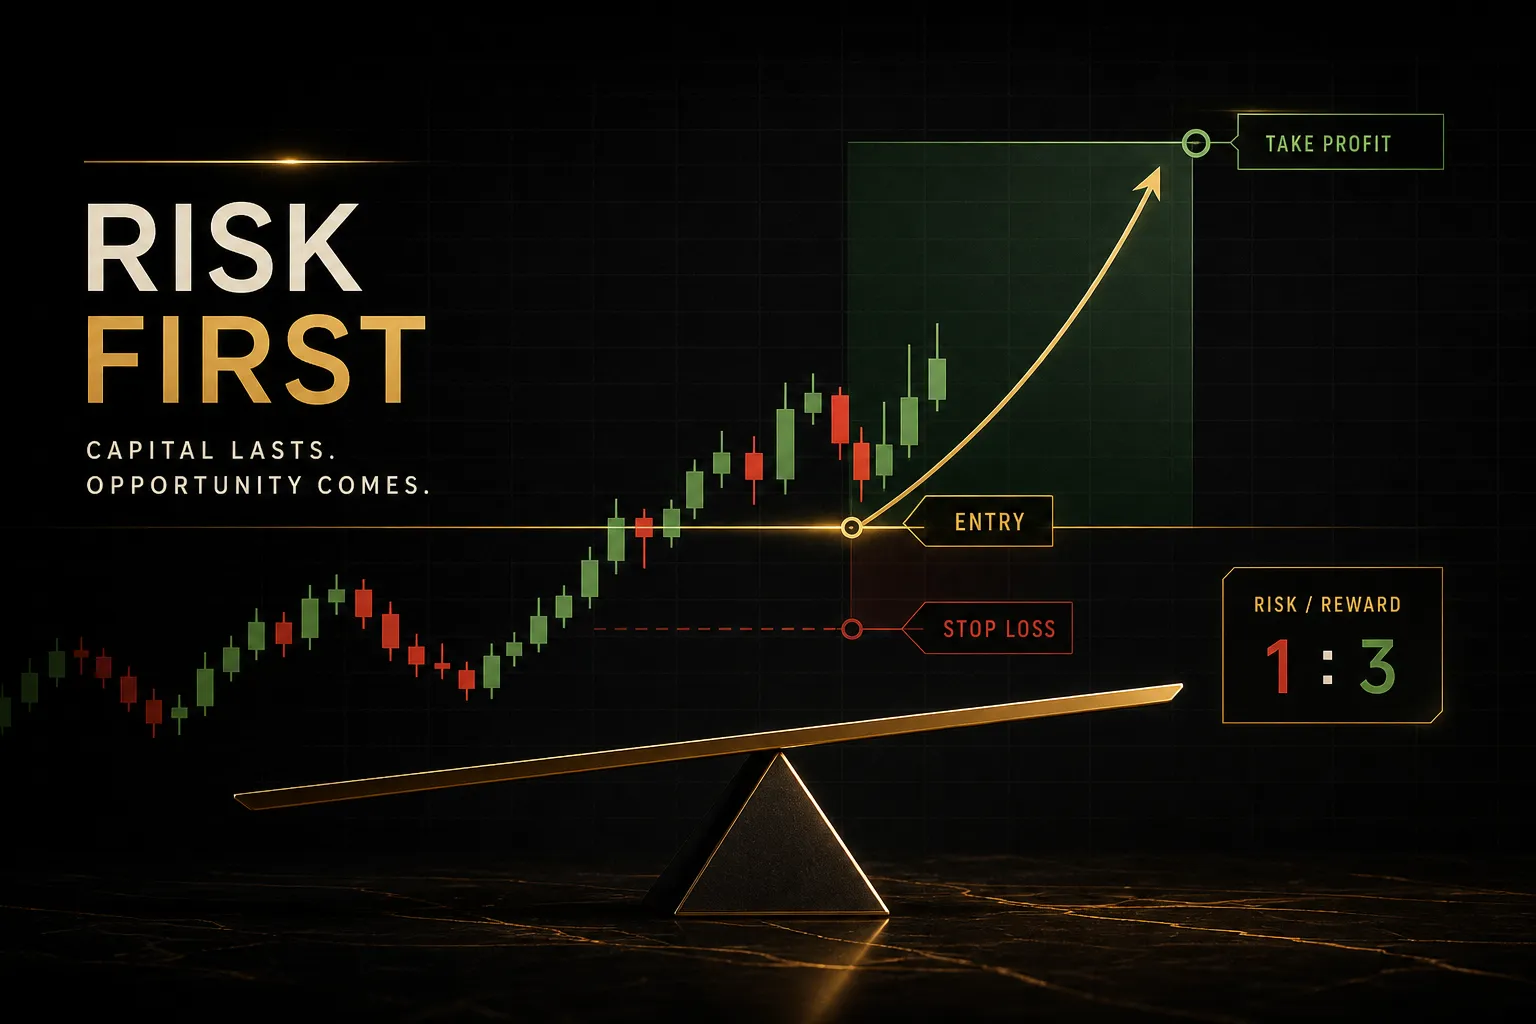
A Beginner's Guide to Trading Without Losing Your Shirt
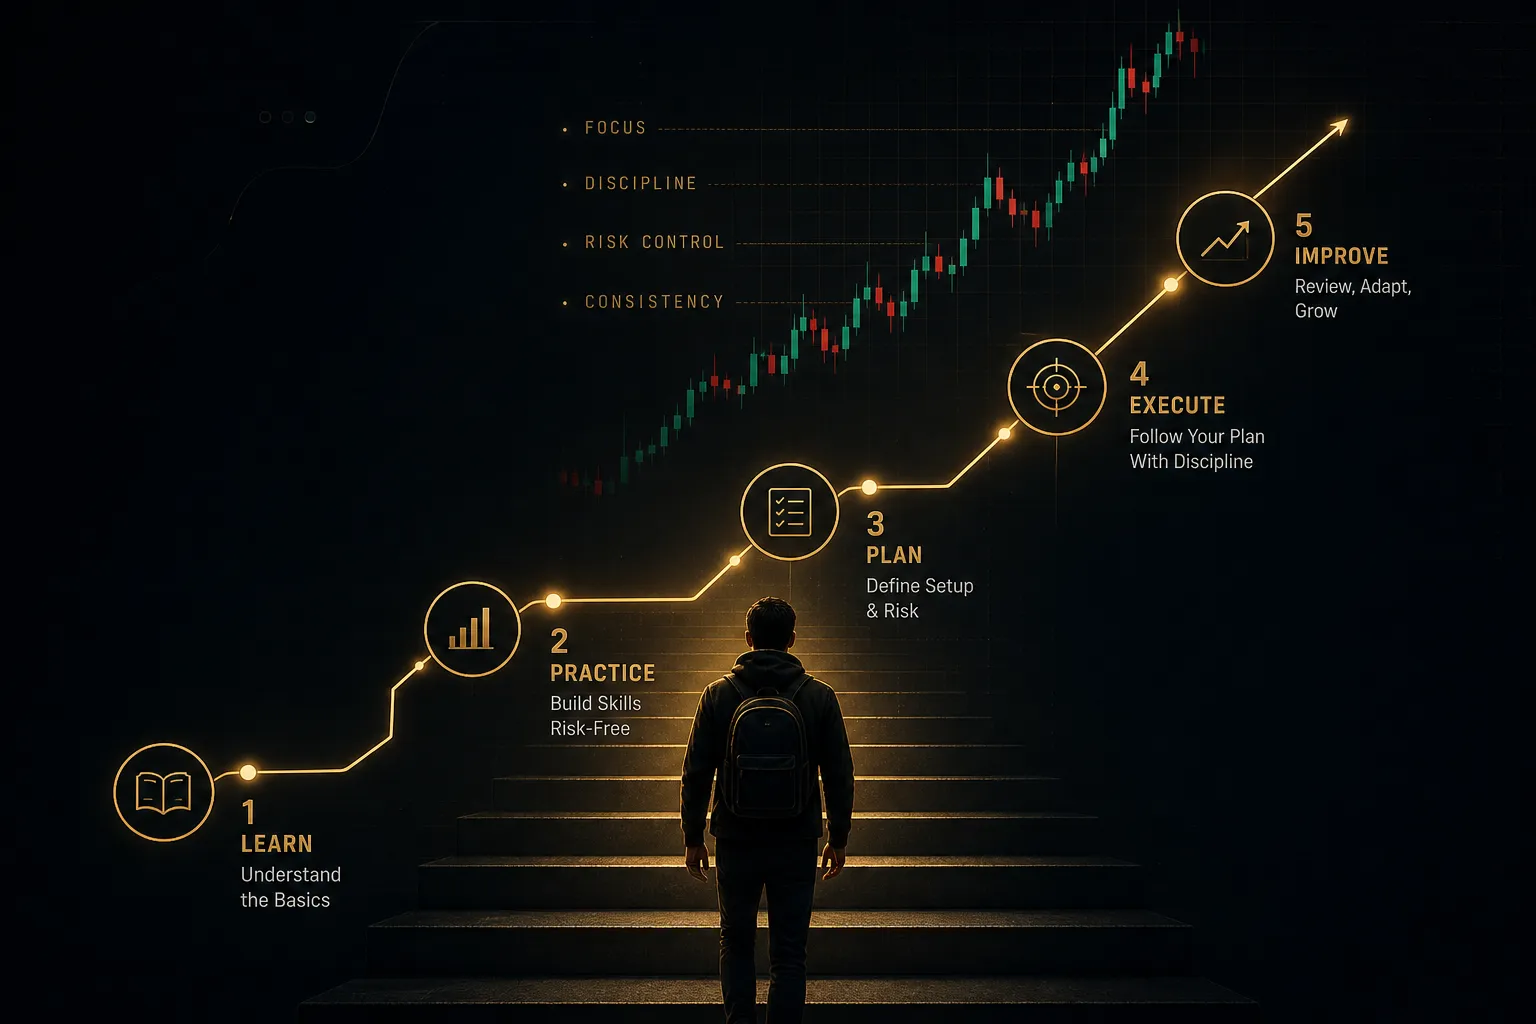
On this page
Why Most Beginners Start Backwards
Ask a new trader what they’re learning and you’ll usually hear about indicators. RSI settings. Which moving average crossover works best. Whether the MACD beats the stochastic.
Almost nobody says “position sizing.”
And that’s the problem.
Most beginner guides sprint from vocabulary straight to strategies, skipping the two things that actually determine whether you survive your first year: risk control and a repeatable process.
FINRA has warned explicitly that day trading may be unsuitable for people with limited capital, limited investment experience, or a low risk tolerance. Academic studies of individual day traders across multiple markets have found consistent profitability to be rare, with the majority of active retail traders losing money over time.
That isn’t a reason to quit before you start.
It’s a reason to build differently.
This guide flips the usual order. You’ll pick a market and a style that fits your actual schedule, learn how orders and position sizing work before you touch a chart, treat indicators as confirmation tools rather than crystal balls, and test everything on paper before a single dollar is at risk.
Think of what follows as an operating manual, not a list of guaranteed-profit setups.
Nobody can hand you those.
What you can build is a process that keeps losses small enough that you’re still in the game when your edge finally shows up.
Choosing a Market and a Style
Beginners tend to choose a market for the wrong reason: whatever their favourite YouTube channel trades. Crypto because it moves. Forex because the leverage is generous. Options because someone posted a screenshot of a 400% gain.
Better question: which market has the fewest ways to hurt you while you’re still learning?
Which Market Fits a Beginner
The financial markets differ enormously in complexity, leverage, and regulatory oversight. Here’s how the main five compare on the factors that matter to someone in their first year.
| Market | Complexity | Typical Retail Leverage | Trading Hours | Liquidity | Regulatory Oversight |
|---|---|---|---|---|---|
| Stocks (US equities) | Low. One price, one direction, no expiry. | Up to 2:1 (4:1 intraday with margin) | 9:30am to 4:00pm ET, plus extended sessions | Very high in large caps, thin in micro caps | Strong (SEC, FINRA) |
| Forex | Moderate. Currency pairs, macro drivers, rollover costs. | 50:1 majors in the US, up to 500:1 offshore | 24 hours, Sunday evening to Friday evening | Extremely high in majors | Varies widely by broker jurisdiction |
| Crypto | Moderate. Simple mechanics, brutal volatility, custody risk. | 2:1 to 100:1 depending on venue | 24/7/365 | High in BTC and ETH, poor in small tokens | Patchy and still evolving |
| Futures | High. Contract specs, tick values, expiry and rollover. | Effectively 10:1 to 50:1 via margin | Nearly 24 hours, five days a week | Very high in index and energy contracts | Strong (CFTC, NFA) |
| Options | Very high. Strikes, expiry, implied volatility, time decay. | Embedded, non-linear | Follows the underlying market | Good in liquid underlyings, poor elsewhere | Strong (SEC, OCC clearing) |
Notice what’s missing from that table: cost per trade. Beginners obsess over commissions and spreads, then blow up an account with 100:1 leverage on an offshore platform they found through an Instagram ad.
Prioritise low complexity and a regulated venue over the cheapest execution. Saving $2 per trade means nothing if the platform has no meaningful oversight or if the instrument has four moving parts you don’t understand yet.
For most people starting out, liquid large-cap stocks, major index futures once you’ve built some experience, or major forex pairs at conservative leverage are the sane entry points. Options and thinly traded altcoins can wait.
Day, Swing, Position, or Scalping
Style matters more than market.
It determines how much screen time you need, how fast your mistakes compound, and whether trading fits around a job.
- Scalping: dozens of trades per session, holding seconds to minutes. Requires constant screen presence, fast execution, and tight spreads. Costs and slippage eat scalpers alive. Not a beginner style.
- Day trading: a handful of trades per session, all closed before the bell. Realistically 3 to 6 focused hours per day, five days a week. High decision volume means high mistake volume.
- Swing trading: holding days to a few weeks. You can plan trades in the evening, place your orders, and check charts once or twice a day. Roughly 30 to 60 minutes of daily work.
- Position trading: holding weeks to months, driven by market structure and fundamental analysis as much as technical analysis. A weekly chart review and a monthly plan is often enough.
Given FINRA’s suitability warning, swing or position trading is the better starting point for almost every beginner in trading.
Fewer decisions per week means fewer chances for emotion to override your rules, and it works with a full-time job. You get a wider stop-loss, more time to think, and lower cumulative transaction costs.
The fastest style is the one that punishes inexperience hardest. Slow down and your learning curve gets cheaper.
Orders, Risk, and Position Size
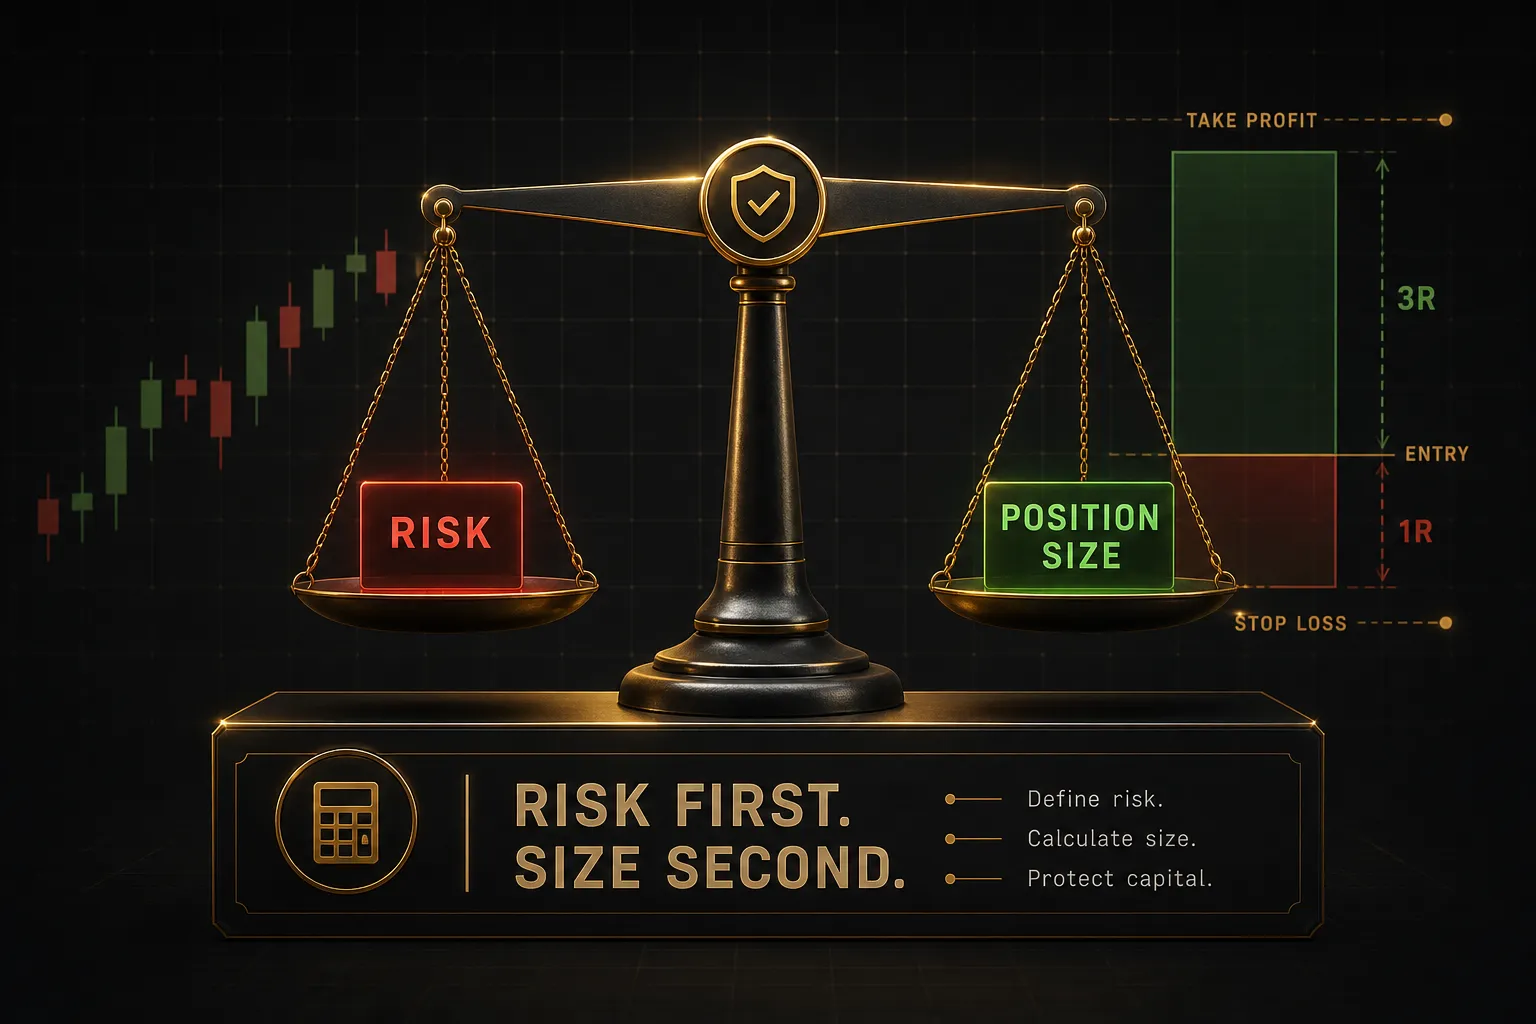
This is the section most beginners skim.
It’s also the one that decides whether your account survives your first losing streak.
Market, Limit, and Stop Orders
Three order types cover 95% of what you need.
- Market order. Fills immediately at the best available price. Certain execution, uncertain price. In fast or thin markets, expect slippage between the price you saw and the price you got.
- Limit order. Fills at your specified price or better, or not at all. Certain price, uncertain execution. Ideal for entering at a support and resistance level you’ve marked in advance.
- Stop-loss order. Triggers an exit once price hits a set level, capping your loss automatically. A stop-market fills at whatever is available once triggered; a stop-limit protects your price but may not fill at all in a gap.
- Take-profit order. A limit order on the other side, closing the position at your target. Placing both a stop-loss and take-profit at entry removes the two decisions you’re worst at making mid-trade.
The Position-Sizing Formula
Position size isn’t a gut feeling.
It’s arithmetic.
- Decide your dollar risk. Multiply your account risk percentage by account size. On a $2,000 account at 1% risk, that’s $20 per trade. Full stop. That number is your maximum acceptable loss.
- Measure your stop-loss distance. Find the invalidation level on the chart, the price where your trade idea is objectively wrong. If you’re buying a stock at $50 and the setup breaks below $48, your stop distance is $2.00 per share. Many traders size this using average true range so the stop respects normal volatility.
- Divide. The formula is (Account Risk % × Account Size) ÷ Stop-Loss Distance = Position Size. Here: $20 ÷ $2.00 = 10 shares.
- Sanity-check the cost. Ten shares at $50 is $500 of capital, 25% of the account, but only $20 of risk. Capital deployed and risk taken are different numbers. Beginners confuse them constantly.
- Adjust for a wider stop. If the real invalidation level is $46, your stop distance is $4.00, so $20 ÷ $4.00 = 5 shares. Wider stop, smaller position, identical dollar risk.
- Never widen the stop to fit the position. Do it the other way round. The chart sets the stop; the maths sets the size.
That last point is the whole discipline in one line.
When a trade feels too small to be exciting, that’s usually a sign you’re sizing correctly.
How Much to Risk Per Trade
The standard guideline is 1% to 2% of account equity per trade. It sounds absurdly conservative until you run the numbers on a losing streak.
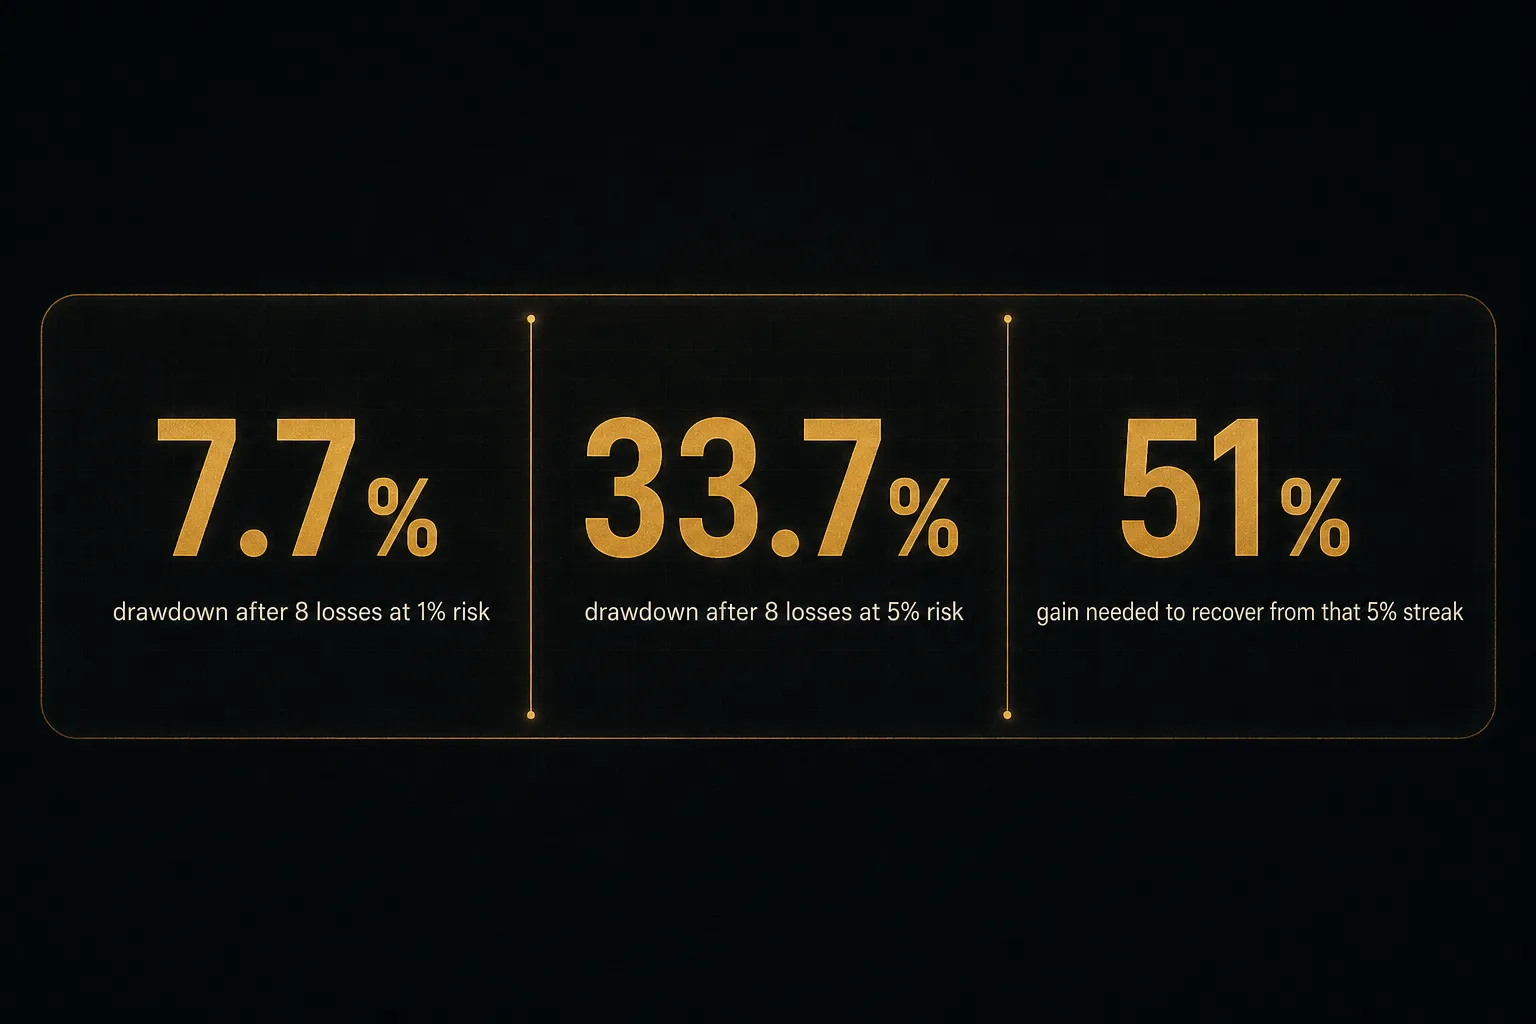
Eight consecutive losses is uncomfortable but entirely normal, even for a strategy with a 50% win rate. At 1% risk, an eight-loss streak takes a $2,000 account to roughly $1,845, a 7.7% drawdown.
Annoying.
Recoverable.
At 5% risk, the same eight losses take you to about $1,326, a 33.7% drawdown.
Now you need a 51% gain just to get back to even, and you’ll be tempted to take bad trades to do it.
That gap is why professional risk limits exist.
Maximum drawdown, not win rate, is what ends trading careers.
Leverage and margin make it worse: they don’t change your dollar risk if you size properly, but they make it trivially easy not to.
Charts, Indicators, and Trade Setups
Here’s a question worth sitting with: if an indicator could predict price, why would the person who built it publish it?
Indicators aren’t predictive.
They’re descriptive.
They compress price history into a single readable line, and every compression throws information away.
What an Indicator Actually Signals
Moving averages measure average price over a lookback window. They smooth noise and make trend direction visible, which makes them useful trend-following tools.
They also lag by design.
In a choppy range, a 20-period moving average will whipsaw you across the middle of the range, generating false signals in both directions.
The relative strength index measures the ratio of recent gains to recent losses on a 0 to 100 scale. It’s a momentum indicator, and its classic failure is the “overbought” reading in a strong uptrend.
RSI can sit above 70 for weeks while price keeps climbing.
Selling because RSI hit 70 is one of the most reliable ways to short a bull market.
VWAP (volume-weighted average price) shows the average price paid across the session weighted by volume.
Institutions use it as an execution benchmark, which is why it often acts as intraday support and resistance.
It’s near-useless on a gap-and-run day when price never revisits it, and it resets every session, so it says nothing about multi-day market structure.
Average true range measures typical price movement per period.
It doesn’t signal direction at all.
It tells you how far price normally travels, which is exactly what you need for placing a stop that isn’t inside the noise.
Now the trap.
Beginners stack a 9-EMA crossover, a MACD, and a momentum oscillator on one chart and feel confirmed when all three turn green. But all three are derived from the same closing prices, calculated slightly differently.
That’s not three votes.
It’s one vote, shouted three times.
Genuine confirmation comes from independent information: price action, volume, higher-timeframe structure, and time of day. Not from three flavours of the same moving average.
A Signal Is Not a Trade Setup
“Buy EURUSD” is a signal.
It’s also nearly useless on its own, because it tells you nothing about where you’re wrong, how much to buy, or when to get out.
A complete trade setup has five components:
- Market context: is this a trending or ranging market regime, and what does the higher timeframe say?
- Entry trigger: the specific price behaviour that starts the trade, such as a break of a session high or a rejection candle at a supply zone.
- Invalidation level: the price at which the idea is proven wrong. This is where the stop-loss order goes, before you enter.
- Position size: calculated from that stop distance and your risk percentage.
- Exit plan: a take-profit target, a trailing rule, or a time-based exit, defining your risk-to-reward ratio in advance.
Miss any one of those and you’re gambling with extra steps.
Confirmation, Not Prediction
The practical skill is converting a directional idea into a structured setup. Some signal services are built around this distinction rather than obscuring it.
PipTrend, as one example of the approach, issues direction-only signals rather than pretending to know exact fill prices, then publishes separate marked entry levels: session highs and lows, VWAP, and supply and demand zones. The direction is the thesis; the levels are where you actually engage. It also runs a 12-timeframe confirmation table, so you can see whether short-term momentum agrees with higher-timeframe market structure or contradicts it.
That contradiction is genuinely useful information.
When the 5-minute and the daily disagree, the trade is a coin flip dressed up as a signal.
The other detail worth copying from any credible source: a public results page showing wins, losses, and break-evens. Transparent break-even counts are a tell. Cherry-picked services never publish them, because break-evens make the numbers look boring, and boring is what real trading records look like.
Use any signal, indicator, or newsletter the same way: as one input into a setup you built, with a stop you chose and a size you calculated.
Confirmation, not prediction.
Testing Before You Trade Real Money
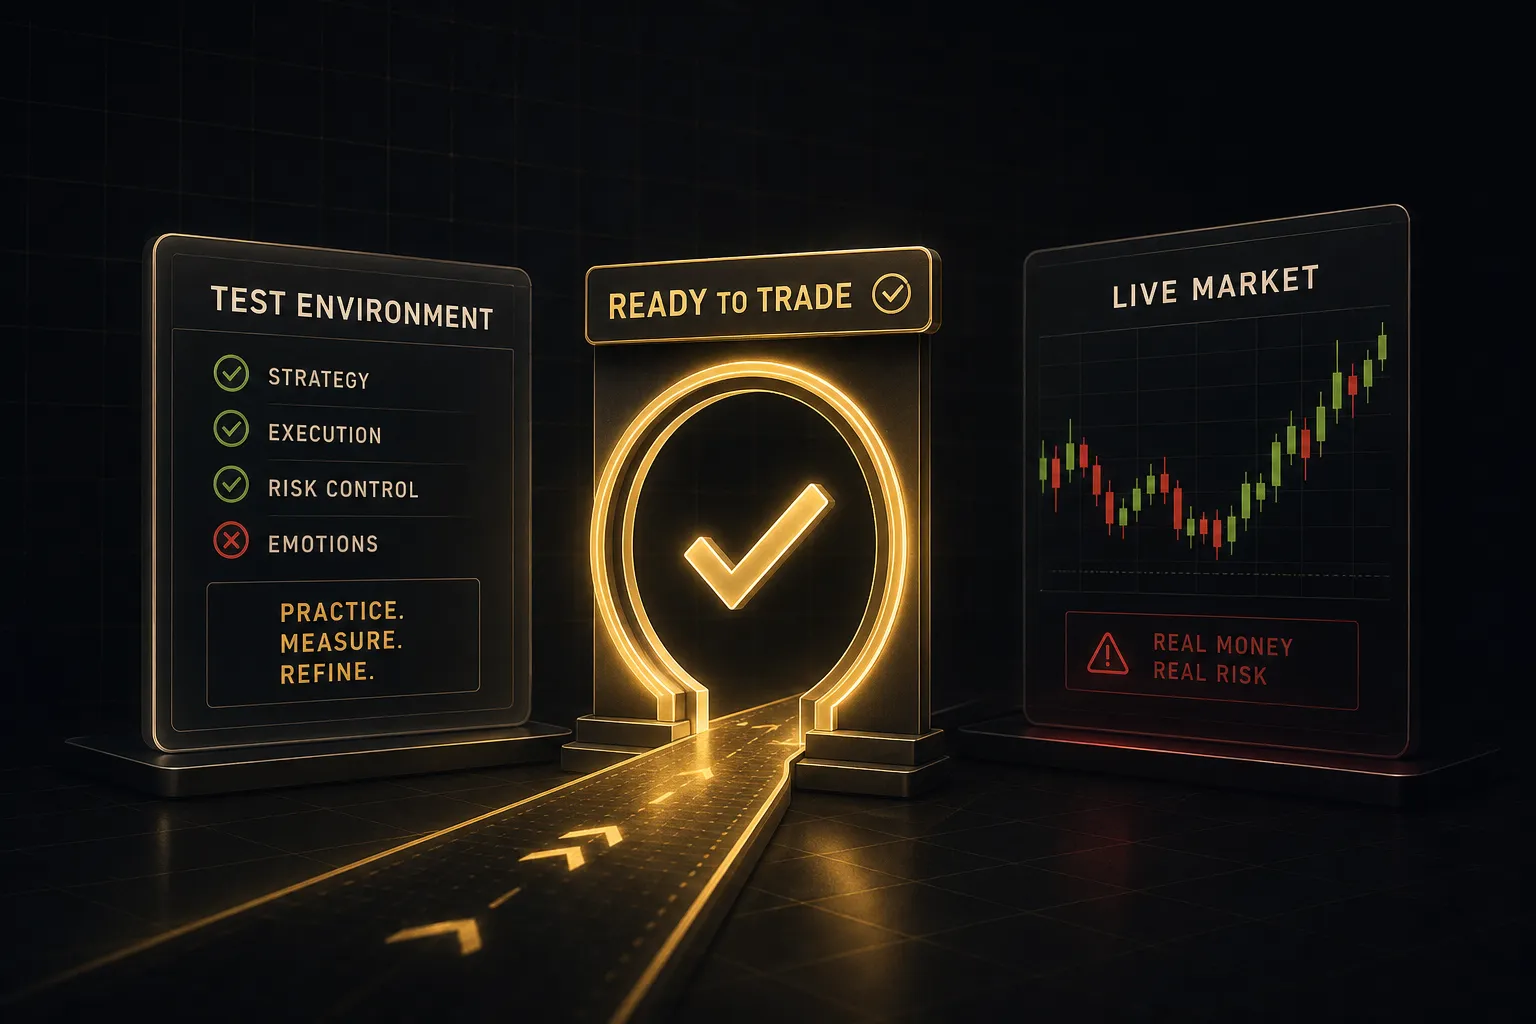
Would you fly a plane you’d never seen in a simulator? Traders do the equivalent constantly, then blame the market.
Testing isn’t optional homework.
It’s how you find out whether your idea has any edge at all before it costs you money.
Paper Trading vs Live Trading
Backtesting and paper trading answer different questions, and both have limits worth understanding before you trust either one.
- Get a real sample size. Thirty to fifty trades is the practical minimum before your results mean anything. Ten winning trades tells you nothing except that you got lucky in one market regime.
- Include every cost. Subtract spread, commission, and realistic slippage from each trade. A strategy averaging 8 pips of profit dies instantly against a 2-pip spread plus slippage. Costs are where most paper-profitable systems go to be buried.
- Avoid curve-fitting. If you tuned the parameters until the backtest looked beautiful, you’ve memorised history rather than found an edge. Test the final rules on a period you never optimised on.
- Respect the emotional gap. Paper trading has no fear and no greed. Real money brings hesitation on entries, panic exits, and the urge to double down. Execution quality typically degrades the moment capital is at risk.
- Account for real fills. Demo platforms often fill limit orders that a live market would have skipped, and ignore liquidity constraints in fast conditions.
- Give it 4 to 8 weeks. Or 20 to 30 paper trades, whichever comes later, before funding a live account. Then start live at the smallest size your broker allows, not your full calculated position.
Your Trading Journal
A trading journal is where trading psychology stops being an abstraction and becomes data you can act on.
Screenshots alone aren’t a journal.
Log these fields for every trade:
- Setup type: the named pattern you traded, so you can eventually rank your setups by profitability.
- Market regime: trending, ranging, or high-volatility news environment. Most strategies only work in one or two.
- Entry reason: written in one sentence, before entry. If you can’t articulate it, don’t take the trade.
- Dollar risk and planned risk-to-reward ratio: the actual numbers, not “about 1%”.
- Execution quality: intended entry versus actual fill, slippage, and whether you got the stop placed where you planned.
- Mistake classification: tag each error. Entered early, moved stop, oversized, revenge trade, ignored the plan. Patterns appear within 20 trades.
- Post-trade review notes: what you’d repeat and what you wouldn’t, written the same day while the decision is fresh.
A losing trade taken correctly is a good trade.
A winning trade taken by breaking your rules is a problem you’ll pay for later.
Your journal is the only place that distinction gets recorded.
Expectancy, Win Rate, and Scams
Win rate is the most overrated number in trading.
Trade expectancy is the one that matters.
The formula: (average win × win rate) − (average loss × loss rate). Suppose you win 70% of the time, averaging $50 per win, and lose 30% of the time, averaging $150 per loss.
That’s ($50 × 0.70) − ($150 × 0.30) = $35 − $45 = negative $10 per trade.
A 70% win rate that bleeds money.
Flip it.
Win 40% of the time at $200, lose 60% at $80: ($200 × 0.40) − ($80 × 0.60) = $80 − $48 = positive $32 per trade.
Losing most of your trades and making money.
Track maximum drawdown alongside it.
Expectancy tells you if the strategy makes money; maximum drawdown tells you whether you’ll still be trading it when it does.
A system with positive expectancy and a 45% drawdown is a system almost nobody actually holds through.
Which brings us to the people who will try to sell you certainty. Warning signs, every one of them a reason to walk:
- Guaranteed returns. No legitimate market participant guarantees profit. None.
- Unregistered signal sellers and “fund managers.” FINRA has repeatedly warned about unregistered entities soliciting retail traders. Check registration before money moves.
- Social media solicitation. Unsolicited DMs, WhatsApp groups, and comment-section invitations are the standard funnel for trading fraud.
- Cherry-picked screenshots. Wins only, no losses, no break-evens, no dates, no account statements.
- Unverifiable track records. If performance can’t be audited or independently reviewed, treat it as marketing copy, not data.
- Pressure and urgency. “Spots closing tonight” is a sales tactic, never a risk-management one.
Common Beginner Questions
How can I start trading with no experience?
Start with a demo account, a single market, and one strategy. Pick a liquid market with strong regulatory oversight, choose swing trading so you’re not making dozens of decisions a day, and define one setup with written entry and exit rules.
Then paper trade it for 4 to 8 weeks while journaling every trade. Only fund a live account after you have 20 to 30 logged trades and know your expectancy.
What is the best trading strategy for beginners?
A simple trend-following swing strategy on daily candlestick charts is the most forgiving starting point. You identify direction using market structure and a moving average, enter on a pullback to support, place a stop-loss below the invalidation level, and target at least twice your risk.
The strategy matters less than the fact that it’s written down, sized correctly, and traded the same way every time.
Consistency beats cleverness at this stage.
How much money should a beginner trader start with?
Most beginners should start with $500 to $2,000 of genuinely risk-capital money, and never funds needed for rent, debt, or emergencies. Position sizing is the constraint: on a $1,000 account at 1% risk, you have $10 per trade, which makes intraday stops of a few dollars per share impractical after costs.
Smaller accounts strongly favour swing or position trading, where wider stops and fewer trades keep transaction costs from dominating results. In the US, pattern day trading rules also require $25,000 in margin equity, which settles the question for most new traders.
Is trading hard for beginners?
Yes, and the difficulty is behavioural rather than intellectual.
The mechanics of orders, technical analysis, and position sizing can be learned in a few weeks.
Executing the same plan on trade 40 after six consecutive losses is the hard part.
Research on retail traders consistently shows most lose money, largely through oversizing, overtrading, and abandoning rules under pressure.
Every one of those is a discipline failure, not a knowledge gap.
Can I teach myself how to trade?
Yes, self-teaching works, but only with structure. Random YouTube consumption is not a curriculum. Build a sequence: market mechanics and order types, then risk and position sizing, then one strategy with defined entry and exit rules, then backtesting, then paper trading with a journal.
Give each stage a deadline and a deliverable. The traders who succeed at self-teaching are the ones who treat it like a syllabus and refuse to skip the testing phase.
Is day trading good for beginners?
Generally no.
FINRA has warned that day trading may be unsuitable for people with limited capital, limited experience, or low risk tolerance, and academic research finds consistent profitability among individual day traders to be rare.
Day trading compresses dozens of decisions into a few hours, which multiplies both transaction costs and emotional errors. If you’re drawn to intraday markets, learn on higher timeframes first and move down only once you have documented positive expectancy.
Your Next Move as a New Trader
Three quick decisions, based on where you actually are right now.
If your capital is under $1,000, start with swing trading on a demo account. Your position-sizing maths simply doesn’t support intraday stops at that size.
If your available time is limited to evenings, rule out day trading entirely rather than trying to squeeze it into a lunch break.
And if you’re not sure your strategy works, that uncertainty is the answer: keep testing before funding anything live.
One concrete action for this week: open a demo account, define a single setup with a written stop and target, and log your first 10 trades in a journal.
Setup type, market regime, dollar risk, execution quality, mistake tag.
Ten trades.
That’s it.
Most people who quit trading within their first year don’t quit because their indicators were inaccurate.
They quit because a handful of oversized trades erased months of progress.
Risk control and consistency are the difference.
Everything else is detail.
Sources
Risk Disclaimer: Trading involves risk. Past performance doesn't guarantee future results. Only trade with money you can afford to lose. PipTrend is a tool to assist your trading decisions, not financial advice.