TradingView XAUUSD: The Complete Chart Setup Guide
On this page
Why XAUUSD on TradingView Confuses So Many Traders
Type “XAUUSD” into TradingView’s search bar and you won’t get one result.
You’ll get a dozen. OANDA, FOREXCOM, PEPPERSTONE, ICMARKETS, CAPITALCOM, and more, each showing a slightly different price for what should be the same metal.
That’s the first stumbling block.
The second one hits when a trader draws a beautiful support level on an OANDA chart, then opens their broker’s platform and finds price already broke through it by $1.80.
Neither chart is wrong.
They’re just different data feeds, sourced from different liquidity providers, with different spreads and different session boundaries. Most guides skip past this entirely and tell you to “search for XAUUSD” as if that settles it.
It doesn’t.
And on gold, where a $3 discrepancy can be the difference between a stop-out and a runner, it matters more than on almost any other instrument.
This guide covers the whole chain: how to pick the right symbol and feed, how spot gold differs from a gold CFD and from COMEX gold futures, how to build a multi-timeframe workflow that survives a CPI print, how to set alerts that fire when you actually want them to, and how to size positions around gold’s genuine volatility instead of a fixed pip stop that made sense on EURUSD.
One framing point before we start. Gold moves on real yields, dollar strength, central bank policy, and geopolitical risk, often all at once.
That macro sensitivity means no single oscillator will save you.
Confluence beats conviction. On XAUUSD, the traders who last are the ones stacking evidence across timeframes, not the ones hunting a magic indicator setting.
Understanding XAUUSD Symbols and Feeds
Why You See Multiple XAUUSD Symbols
XAUUSD is not a centrally listed instrument.
Unlike a stock that trades on one exchange with one consolidated tape, gold traded as a currency pair is an over-the-counter product, priced independently by each broker and liquidity provider.
So when a broker connects its feed to TradingView, it publishes its own XAUUSD: its own bid, its own ask, its own spread, its own historical candles. TradingView’s symbol search documentation makes this explicit, results vary by data source and exchange prefix, which is why every symbol carries a prefix like OANDA:XAUUSD or FOREXCOM:XAUUSD.
Those prefixes are not cosmetic.
They tell you which server generated every candle on your screen.
Differences show up in four practical ways.
Spread width varies by broker, which changes where wicks terminate. Session start and end times differ, so the daily candle open can shift by an hour or more. Historical depth varies, some feeds go back to 2004, others to 2015. And rollover handling around the daily close creates different gap behaviour.
The result: two traders analysing “the same” gold chart can see a swing high at 2,412.60 and 2,414.10 respectively.
Both are correct on their own feed.
Choosing and Troubleshooting Your Feed
The decision framework is simpler than the problem sounds.
Rule one: match your analysis feed to your execution broker whenever possible.
If you trade with Pepperstone, chart PEPPERSTONE:XAUUSD.
Your levels, your stop distances, and your alert triggers then correspond to prices you can actually get filled at.
Rule two: check the symbol description before trusting a chart.
Click the symbol name at the top left of the chart. TradingView shows the source, the description, and the session hours.
Ten seconds of verification saves an afternoon of confusion.
Rule three: never switch feeds mid-setup.
If you built a trade idea on OANDA and then flip to ICMARKETS to “double check,” you’re comparing two different price series.
Your levels will drift and your confidence will evaporate for no good reason.
Now the troubleshooting.
Four issues account for most complaints.
“Symbol not found.”
Almost always a prefix problem.
Searching plain “XAUUSD” works, but typing a broker prefix your account doesn’t have access to returns nothing.
Use the search panel and filter by the Forex or CFD category rather than typing prefixes manually.
Delayed or frozen data. Some broker feeds require you to connect a broker account or hold a paid TradingView plan for real-time streaming.
If your chart lags by 10 to 15 minutes, check the clock icon near the symbol, TradingView labels delayed feeds explicitly.
“Market closed” during the day. Gold has a daily rollover break, typically around 22:00 to 23:00 UTC depending on the broker, plus the weekend close from Friday evening to Sunday evening.
Seeing that message at 22:15 UTC is normal, not a fault.
Your broker quote differs from the chart.
Expected.
TradingView charts usually plot the bid price while your platform may show mid or ask, and spread differences of $0.20 to $0.50 on gold are routine.
A gap of more than a couple of dollars, though, usually means you’re on a different broker’s feed than you think.
Spot Gold, CFDs, and Gold Futures Compared
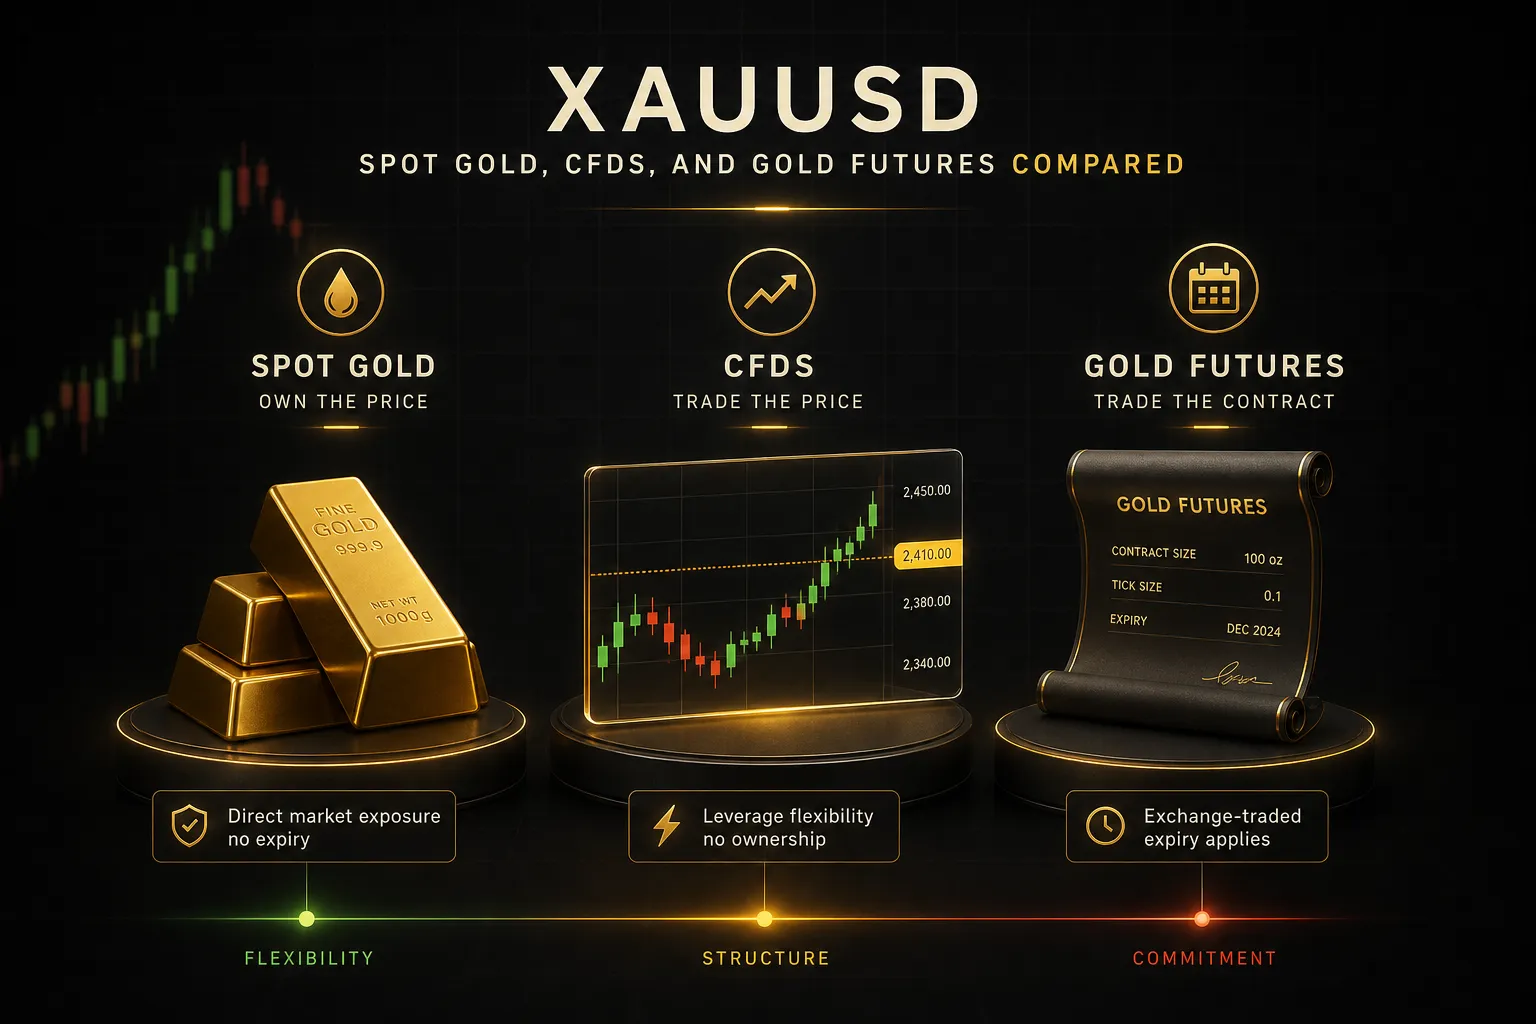
Here’s a distinction that trips up traders moving between platforms: XAUUSD and GC1! are not the same product, even though they track the same metal and usually move within a few dollars of each other.
XAUUSD as offered by retail brokers is a contract for difference.
No expiry, no standardised size, no central exchange.
GC1! is the continuous front-month COMEX gold futures contract, with specifications set by CME Group: 100 troy ounces per contract, a minimum tick of $0.10 per ounce worth $10 per contract, and a defined expiration and settlement cycle.
That difference cascades into everything from margin to volume reliability.
| Feature | XAUUSD (Spot / CFD) | GC1! (COMEX Futures) |
|---|---|---|
| Contract size | Broker-defined; commonly 100 oz per standard lot, micro lots available from 0.01 | Fixed at 100 troy ounces per contract; micro gold (MGC) at 10 oz |
| Tick value | Varies by lot size; roughly $1 per $0.01 move on a standard 100 oz lot | $10 per $0.10 move, standardised by CME Group |
| Expiration | None; positions roll indefinitely | Defined expiry and settlement cycle; GC1! auto-rolls to front month |
| Volume data | Broker tick volume only, not true market volume | Centralised exchange volume, reliable for volume analysis |
| Holding cost | Overnight financing/swap charged daily, can be significant on long holds | No daily swap; cost embedded in the futures roll and contango |
| Typical leverage | High retail leverage, often 1:20 to 1:500 depending on jurisdiction | Exchange margin, roughly 4 to 8 percent of notional, subject to change |
| Trading hours | Sunday evening to Friday evening with daily rollover break | CME Globex, near 23 hours a day Sunday through Friday |
The volume point deserves emphasis.
If you use volume-based tools, volume profile, OBV, volume-weighted levels, applying them to a CFD feed gives you your broker’s tick count, not the market’s true participation.
Many experienced gold traders solve this by charting GC1! for volume and market structure context, then executing on their broker’s XAUUSD.
Different tools, same metal.
Cost structure is the other practical divide.
A CFD position held for three weeks accrues daily swap that can quietly eat a meaningful slice of a winning trade, while a futures position pays no nightly financing but requires substantially more capital per contract.
Building a Gold Chart Analysis Workflow
Best Timeframes for Gold
Gold can travel $40 in an afternoon and then chop sideways for three days.
That behaviour destroys single-timeframe traders.
The fix is a top-down structure.
Use the Daily chart to establish directional bias and mark the levels that actually matter, prior swing highs and lows, weekly opens, round numbers like 2,400 and 2,500 that attract order flow.
Drop to the 4-hour to refine that bias into a tradable zone. This is where market structure becomes readable: higher highs and higher lows, or the break that ends them.
Then use 15-minute and 5-minute charts purely for entry timing.
Not for direction.
The moment you start forming opinions on the 5-minute, you’ve lost the plot, because gold’s intraday noise will hand you a convincing signal in both directions within the same hour.
A working ratio: 70 percent of your analysis time on Daily and 4H, 30 percent on execution timeframes.
Multi-timeframe analysis isn’t about watching more charts.
It’s about giving each chart one job.
Weekly charts earn a place too, particularly for swing traders. Gold trends can run for months, and a weekly close above a multi-year range often marks the start of a move that daily traders keep fading and losing on.
Macro Events That Move Gold
Gold is a macro asset wearing a technical costume.
You can have flawless support and resistance mapping and still get run over by a hot inflation print.
The scheduled catalysts worth guarding against:
- US CPI, released monthly, usually 13:30 UTC. Inflation surprises reprice rate expectations, and gold reacts within seconds. Moves of $20 to $40 are common.
- Nonfarm payrolls, first Friday of the month. Labour strength pushes yields up and gold down, though the relationship inverts when the market shifts to recession pricing.
- FOMC rate decisions and press conferences. The statement moves gold; the press conference often moves it further, and in the opposite direction.
- Treasury yield moves, particularly 10-year real yields. Gold pays no coupon, so rising real yields raise the opportunity cost of holding it. This is the single most reliable macro driver.
- U.S. dollar index direction. DXY and XAUUSD generally trade inversely. When the correlation breaks down, something structural is happening, often central bank buying or a risk event.
Practical rule: check an economic calendar before every entry.
If a tier-one release lands within 60 minutes, either skip the trade or halve your size.
Federal Reserve speakers count too, unscheduled hawkish comments have produced $25 candles.
Confluence Indicators Without Repainting
Here’s a problem most traders discover the expensive way.
An indicator looks flawless on historical data, then behaves completely differently live.
That’s indicator repainting.
TradingView’s own documentation explains the mechanism: indicators recalculate on every incoming tick within an unclosed bar. A signal that appears mid-candle can vanish before the candle closes, and historical bars may display a version of the signal that never actually existed in real time.
Higher-timeframe data requested without proper offset handling makes it worse, showing future information on past bars.
The backtest looks spectacular.
The live account does not.
Bar close confirmation is the defence.
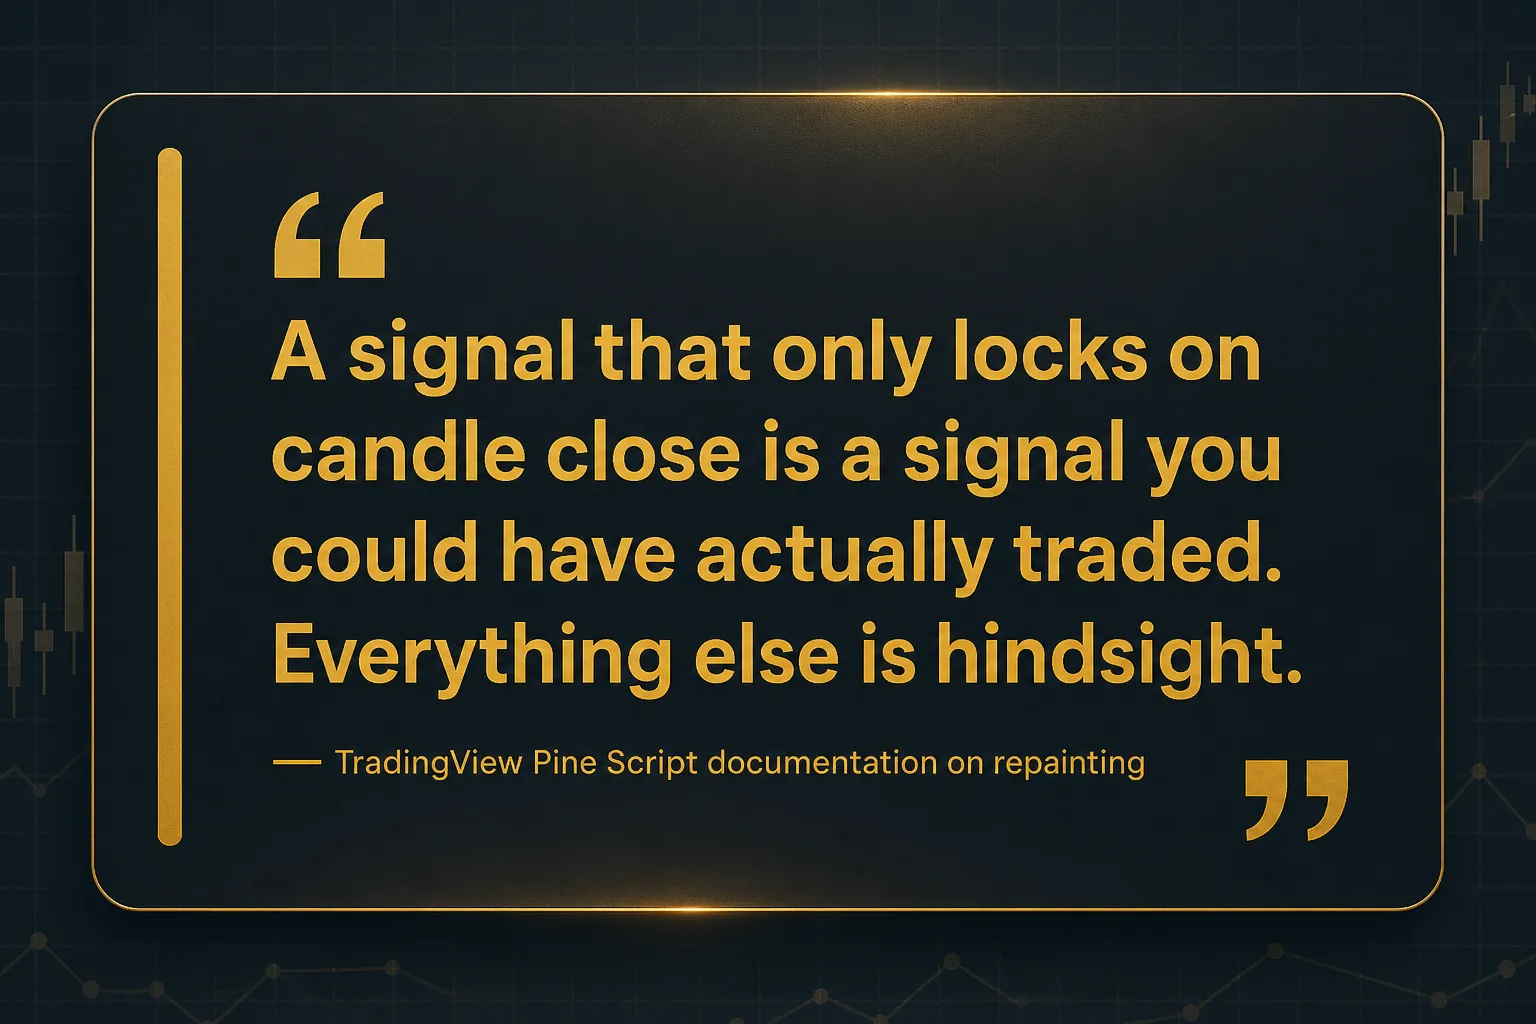
A signal that only prints and locks when the candle closes is a signal you could have acted on.
Slower, yes.
Honest, absolutely.
This is where systematic confluence tools earn their place. PipTrend, for example, runs a non-repainting signal engine that locks each signal on candle close rather than shifting historical results, paired with a 12-timeframe multi-timeframe confirmation table that shows at a glance whether the 1-minute through monthly reads agree or conflict.
The value isn’t the signal itself.
It’s seeing that your 5-minute long idea is fighting a bearish Daily and 4H, which on gold is usually a reason to stand down.
Alerts and Risk Controls for XAUUSD
Setting Alerts That Actually Fire
Most alert failures aren’t platform bugs.
They’re configuration mistakes, and they follow a predictable pattern.
- Confirm the symbol before you create the alert. TradingView binds every alert to the exact symbol you had open. An alert set on OANDA:XAUUSD will not fire at your Pepperstone level, and the drift can easily exceed a dollar. Check the prefix in the alert dialog itself.
- Choose the right alert type. TradingView offers price alerts (crossing a fixed level), technical alerts based on indicator conditions, strategy alerts tied to backtested entries and exits, and drawing alerts attached to trendlines or channels. Trendline alerts are underused and excellent for gold’s diagonal breaks.
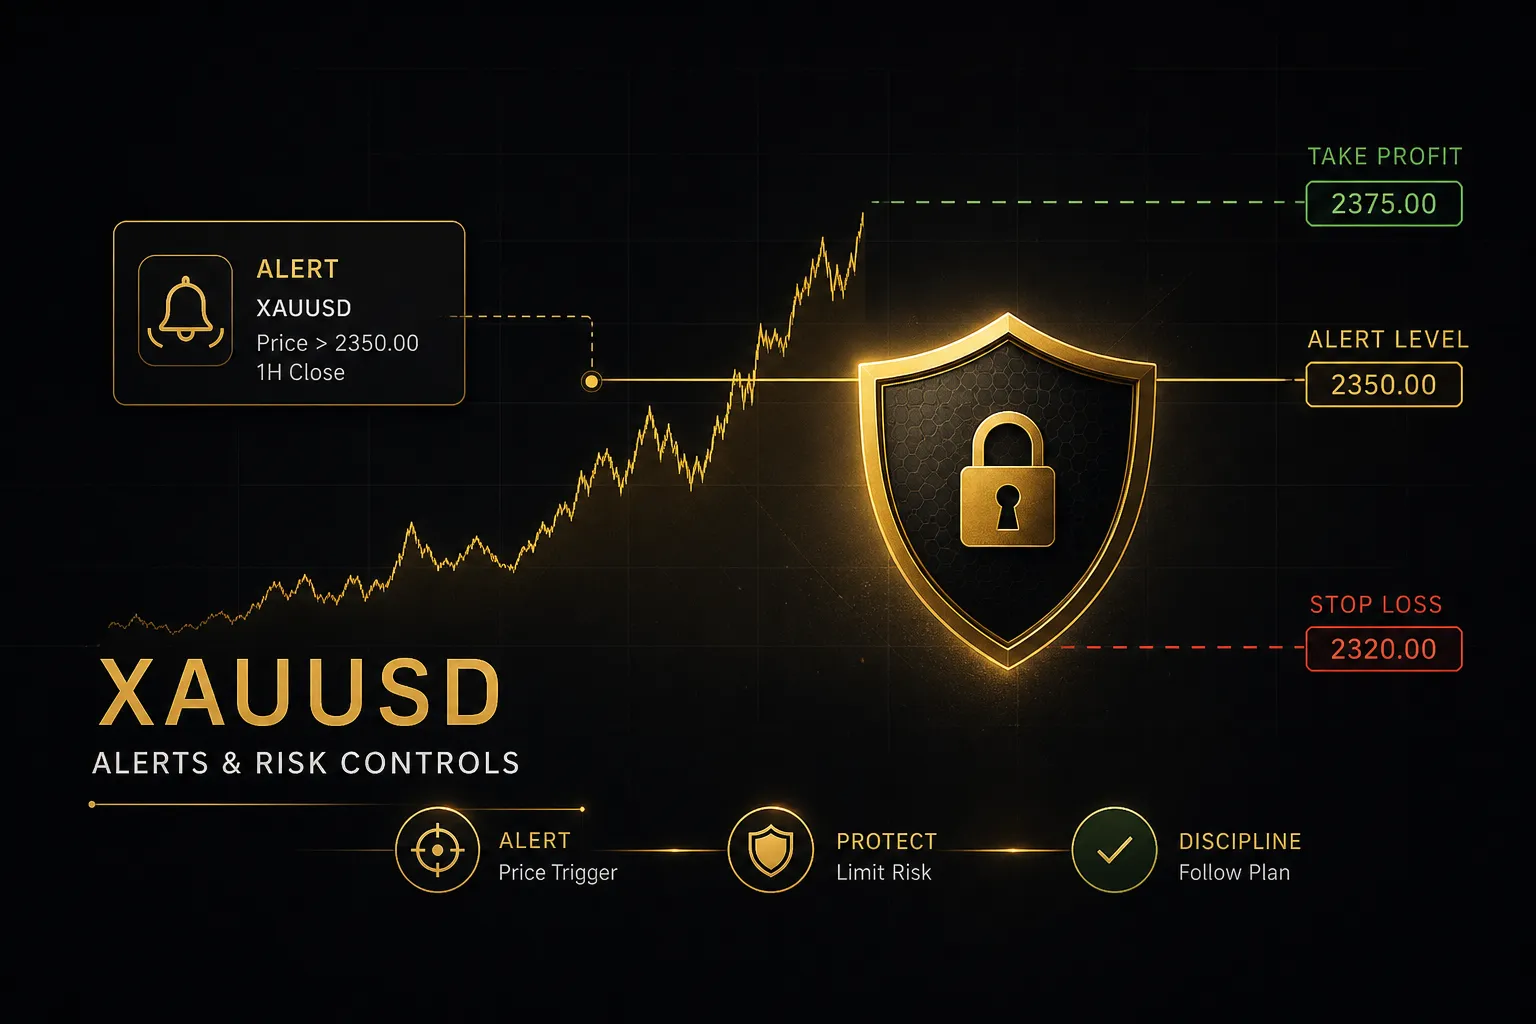
- Set the trigger to “Once Per Bar Close.” This is the single most valuable setting. The default “Only Once” on a crossing condition can fire on an intrabar wick that reverses immediately, giving you a false trigger at 3am. Bar close means the candle actually finished on the other side of your level.
- Verify the timeframe. An indicator alert inherits the chart’s timeframe. Build the alert on the 5-minute when you meant the 4H, and you’ll receive roughly 48 times more notifications than you wanted.
- Set an expiration deliberately. Open-ended alerts accumulate. Three months later you’re getting pinged about a level that stopped mattering in January. Give swing alerts a two to four week horizon and review them weekly.
- Write the message to be actionable. Use dynamic placeholders for symbol, price, and timeframe so a phone notification tells you everything without opening the app. “XAUUSD 4H closed above 2,455” beats “Alert.”
ATR Stops and Spread-Aware Sizing
A 20-pip stop on EURUSD is reasonable.
The equivalent on gold gets hit by ordinary noise before your idea has a chance.
- Measure gold’s actual volatility with ATR. Add the average true range indicator, default period 14, to your entry timeframe. Gold’s Daily ATR has frequently run between $25 and $45 in recent years. That number, not a habit borrowed from forex, defines a realistic stop.
- Set an ATR stop loss with a multiplier. A common approach is 1.5 to 2 times ATR beyond your invalidation level. On a 4H chart with ATR of $12, that means a stop 18 to 24 dollars away, placed past structure rather than at an arbitrary round figure where stops cluster.
- Size the position from the stop, not the other way round. Decide your risk in currency first, say 1 percent of account. Divide that by the stop distance in dollars per ounce to get your ounce exposure. This is position sizing done correctly, and it means a wide stop simply produces a smaller position, not a bigger loss.
- Add spread to your calculations. Gold spreads commonly sit at $0.15 to $0.40 in liquid hours and can blow out to $2 or more at the rollover and during news. Entering at 22:00 UTC on a tight scalp is paying a tax for nothing.
- Require a defined risk-to-reward ratio before entry. If the nearest logical target sits closer than 1.5 times your stop distance, the setup isn’t worth taking regardless of how clean it looks. Gold offers enough opportunities that you can afford to be selective.
Testing Safely Before Going Live
Opinions about a strategy are cheap.
Sample sizes are not.
- Use Bar Replay to rehearse without hindsight. TradingView’s Bar Replay lets you rewind XAUUSD to any date and step forward candle by candle. Critically, it prevents you from seeing what happens next, which is the flaw that makes eyeballing historical charts so misleading.
- Replay through a stress period. Run your setup through March 2020, the 2022 rate-hiking cycle, and any month with a major geopolitical shock. A strategy that only works in a smooth uptrend isn’t a strategy.
- Move to paper trading for live conditions. TradingView’s paper trading account executes against real-time prices, exposing timing issues, hesitation, and slippage assumptions that replay hides.
- Log at least 50 to 100 trades before judging. Anything below 30 is noise. Record entry, exit, stop distance in ATR terms, timeframe, macro context, and whether you followed your own rules.
- Review the journal monthly, not daily. Look for patterns in the losses. Most traders find their damage concentrated in a specific session, a specific day of the week, or trades taken within an hour of a data release.
Frequently Asked Questions
How do I add XAUUSD to my TradingView watchlist?
Open the symbol search box, type XAUUSD, then click the star icon next to the result you want. The symbol is added to your active watchlist immediately.
The key detail is choosing the right result.
Each entry shows an exchange prefix such as OANDA, FOREXCOM, or PEPPERSTONE. Pick the one matching your broker, and if you compare feeds regularly, add two or three variants to the same watchlist so the price differences are visible at a glance.
Why can’t I find XAUUSD on TradingView?
The symbol exists on TradingView; failed searches are almost always a prefix or filter issue. Typing a broker prefix your plan doesn’t include returns an empty result.
Clear any active category filter in the search panel, search the plain term XAUUSD without a prefix, and check the Forex and CFD tabs. If you specifically need one broker’s feed and it isn’t appearing, that data source may require connecting a broker account or a paid plan.
What is the best XAUUSD symbol on TradingView?
The best symbol is the one published by the broker you execute through. Matching the analysis feed to the execution feed keeps your levels, stops, and alerts aligned with the prices you can actually trade.
If you don’t have a broker yet, OANDA:XAUUSD is a widely used reference with deep history and reliable data. For volume analysis specifically, chart GC1! COMEX futures instead, since spot and CFD feeds only report broker tick volume rather than true market participation.
Is XAUUSD forex or gold?
Both, technically.
XAUUSD quotes the price of one troy ounce of gold in U.S. dollars, structured exactly like a currency pair, with XAU being the ISO code for gold.
Brokers list it under forex or metals because it trades on the same OTC infrastructure with the same lot conventions and swap mechanics.
But it behaves like a commodity and a macro hedge, driven by real yields, dollar strength, and central bank policy rather than the interest rate differentials that drive true currency pairs.
What is the best indicator for XAUUSD trading?
No single indicator produces reliable results on gold, and any tool promising otherwise should be treated with suspicion.
What works is confluence: multiple independent signals agreeing at the same price level.
A practical stack combines market structure and support/resistance for context, ATR for volatility-adjusted stops, and a trend or momentum tool for timing, all confirmed on bar close. Multi-timeframe confirmation tools like PipTrend’s 12-timeframe table serve the same purpose, showing whether your entry timeframe agrees with the higher ones.
Risk management still outweighs any indicator choice.
Can I use TradingView to trade gold?
Yes, but only through a connected broker.
TradingView is a charting and analysis platform, not a broker, and it does not hold funds or execute trades natively.
Its brokerage integrations let you connect a supported account and place orders directly from the chart, with the broker handling execution, margin, and settlement. Availability varies by region and by broker, so check which integrations are supported for your jurisdiction before assuming one-click execution will work.
Your Next Chart Session
The decision tree is short.
If you already have a broker, verify the feed source first and chart that exact symbol, because everything downstream, your levels, your stops, your alerts, depends on it.
If you’re doing volume-based work, keep GC1! open alongside for genuine COMEX volume.
And if you want systematic confluence with signals that lock on candle close rather than reshaping themselves after the fact, test a tool like PipTrend through Bar Replay across a few hundred candles before it touches live capital.
Everything else, the ATR sizing, the economic calendar check, the trade journal, is discipline you build one session at a time.
So here’s the concrete step.
Open your XAUUSD chart tonight.
Click the symbol name and confirm the source matches your broker.
Mark one level on the Daily that genuinely matters, a prior swing high, a weekly open, a round number.
Then set a single alert on it.
Once per bar close.
Two-week expiration.
And close the chart.
The alert will find you when the market is ready, which is a far better use of your attention than watching a $2,400 metal breathe.
Risk Disclaimer: Trading involves risk. Past performance doesn't guarantee future results. Only trade with money you can afford to lose. PipTrend is a tool to assist your trading decisions, not financial advice.