The Complete VIX Index Guide for Traders
On this page
Why the VIX Isn’t Just a Fear Gauge
Call it the “fear index” one more time and a volatility trader will wince.
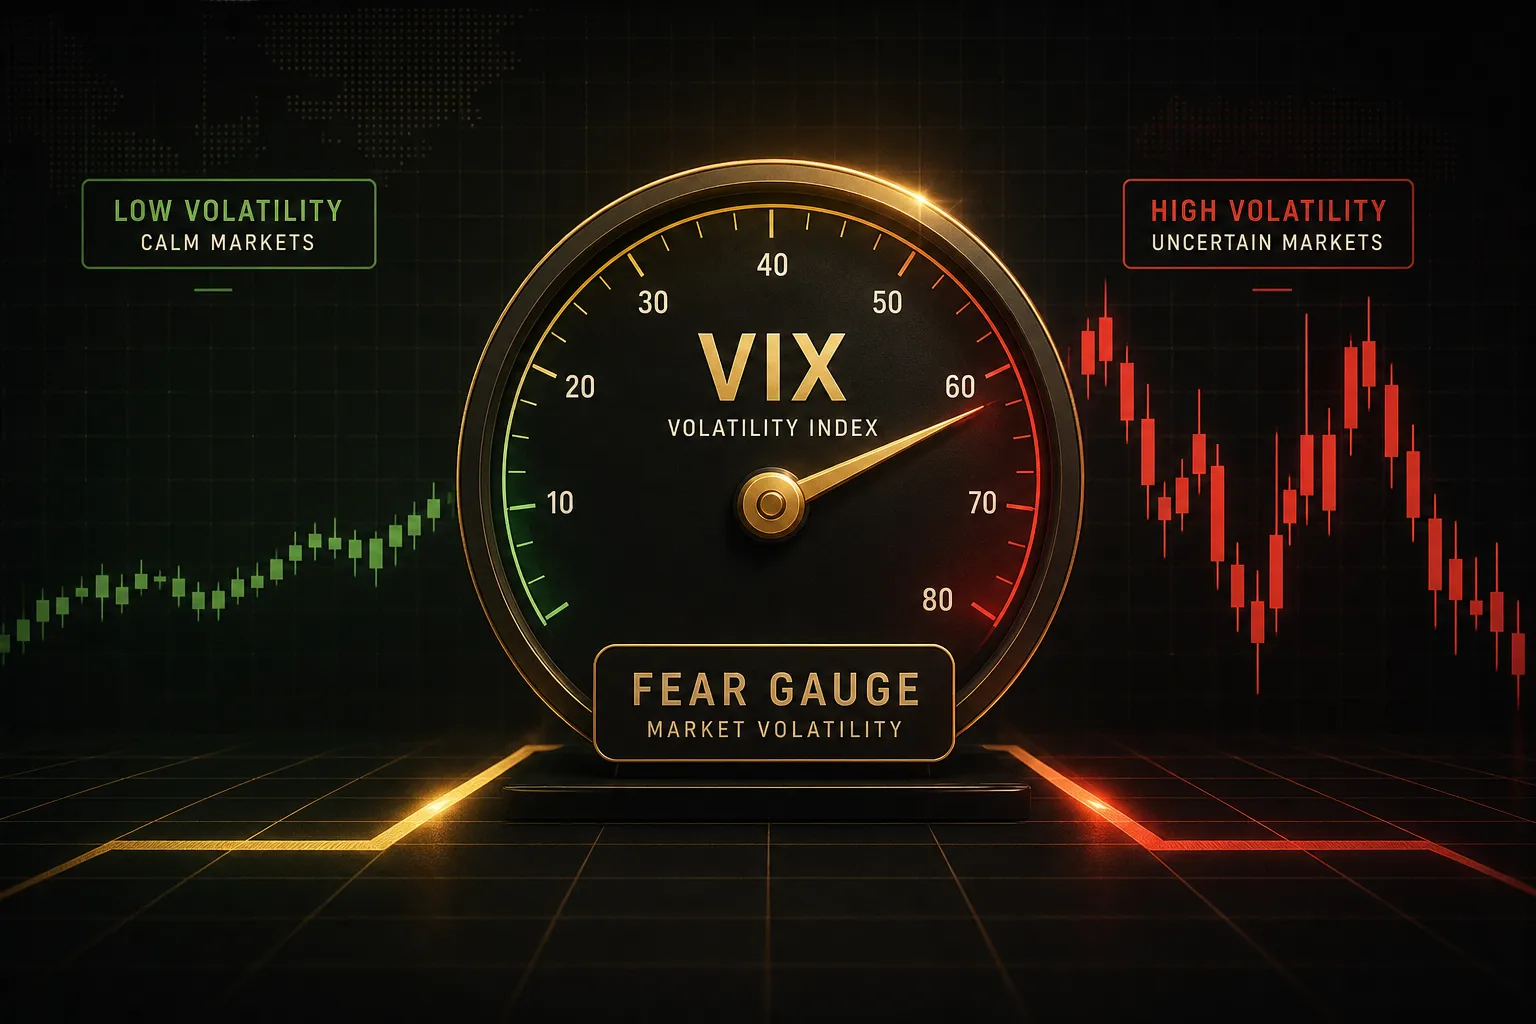
The VIX doesn’t measure fear, panic, or pessimism. It measures the annualized, risk-neutral expectation of S&P 500 volatility over the next 30 calendar days, derived from live option prices.
That distinction matters more than it sounds. A rising VIX tells you the options market expects bigger swings, not that stocks are going down. Direction is not part of the calculation.
At all.
And the VIX is only one member of a much larger family.
This guide covers the full lineup: VIX1D for same-day event risk, VIX9D for the next two weeks, the headline 30-day VIX, then VIX3M, VIX6M and VIX1Y stretching out to a full year. Add VVIX, the volatility of volatility, plus asset-specific gauges like OVX for crude oil and GVZ for gold.
The practical goal here is narrow and honest.
Volatility data works as confirmation, a read on market regime that sits alongside your trend analysis and price structure. It is not a buy or sell trigger on its own, and traders who treat it that way tend to get chopped up in exactly the conditions the index was flagging.
What follows: how the number is actually built, how to read the volatility term structure, how to convert a VIX print into an expected trading range, and a repeatable workflow you can run before every session.
How the VIX Index Actually Works
What the VIX Measures
The VIX is calculated from a wide strip of S&P 500 index options (SPX options), not from stock prices. Cboe pulls live bid-ask quotes across dozens of strikes, weighting out-of-the-money puts and calls that expire in a window bracketing 30 days.
Why out-of-the-money contracts? Because they carry the market’s pricing of tail risk. When institutions bid up downside puts to hedge exposure, those richer prices flow straight into the index.
Heavy put-call demand on the downside is the main engine behind most VIX spikes.
The result is expressed as an annualized standard deviation. A VIX of 18 means the market is pricing roughly an 18% annualized move in the S&P 500 over the coming month, with about a 68% probability of staying inside that one-standard-deviation band.
The Calculation Behind the Number
Under the hood, the VIX is a variance swap replication. Cboe aggregates the prices of that entire option strip into a single measure of risk-neutral variance, weighting each strike by the inverse square of its price so that far out-of-the-money contracts still contribute meaningfully.
Two near-term expirations get blended so the result always sits at exactly 30 days. Then the variance figure gets annualized and the square root is taken.
Variance becomes volatility, and volatility gets quoted as a percentage.
The VIX is not an opinion poll. It is the arithmetic consequence of what thousands of traders are willing to pay for S&P 500 optionality right now.
One quirk worth knowing: option quotes with zero bids drop out of the calculation. In very thin conditions, the strip narrows and the index can behave differently than the smooth curve you might expect.
Implied vs Realized Volatility
Implied volatility is forward-looking, extracted from what options cost today. Realized volatility (also called historical volatility) is backward-looking, calculated from how much the index actually moved over a past window.
The two rarely match.
Implied volatility runs above realized volatility roughly 80% to 85% of the time across long study periods, a persistent spread known as the volatility risk premium. Option sellers earn it as compensation for absorbing crash risk.
That gap is also why buy-and-hold positions in volatility products bleed.
You are paying the premium continuously.
Last detail on data timing.
The intraday VIX you see quoted uses real-time SPX quotes, but monthly settlement uses a separate auction-based methodology producing the VRO print. VRO can diverge noticeably from where the index traded moments before, and that divergence has burned traders holding VIX options into expiration.
The Full VIX Family Explained
Term Structure: VIX1D to VIX1Y
The 30-day VIX gets all the headlines, but the real information lives in the comparison between horizons. Cboe publishes a full volatility term structure, and the shape of that curve tells you whether the market is worried about tomorrow or worried about the next twelve months.
| Index | Time Horizon | Primary Use Case | Typical Behavior |
|---|---|---|---|
| VIX1D | 1 trading day | Same-day event risk: CPI prints, FOMC decisions, jobs reports | Extremely spiky; can jump from 10 to 40 and collapse within hours |
| VIX9D | 9 calendar days | Near-term catalyst window, earnings clusters, weekly positioning | Leads the 30-day VIX at turning points; fast to react, fast to decay |
| VIX | 30 calendar days | Benchmark regime read and the reference for most volatility products | Long-run average near 19 to 20; median closer to 17 |
| VIX3M | 3 months | Quarter-ahead risk pricing; the standard comparison against spot VIX | Usually 2 to 5 points above spot VIX in calm markets |
| VIX6M | 6 months | Medium-term macro read: policy cycles, election risk, recession pricing | Smoother; rarely spikes on single-day headlines |
| VIX1Y | 12 months | Structural regime assessment and long-dated hedging cost | Most stable of the family; moves on regime change only |
Here is where it gets useful.
When VIX1D jumps to 32 ahead of an inflation release while VIX3M sits quietly at 19, the market is pricing an isolated event, not a regime shift. Traders should expect a violent single-session move followed by rapid volatility decay.
Flip that.
When VIX3M and VIX6M grind higher alongside spot, the market is repricing risk across the whole calendar. That is a regime change, and it usually demands smaller positions rather than a clever short-volatility trade.
VIX Spot vs VIX Futures
You cannot buy the VIX.
It is a calculated index, a number derived from option prices, with no underlying basket to hold. Every tradable volatility instrument references VIX futures instead.
VIX futures price where the market expects the VIX to settle on a specific future expiration date. That is a fundamentally different question from “what is 30-day implied volatility right now,” which is why spot and futures routinely diverge by several points.
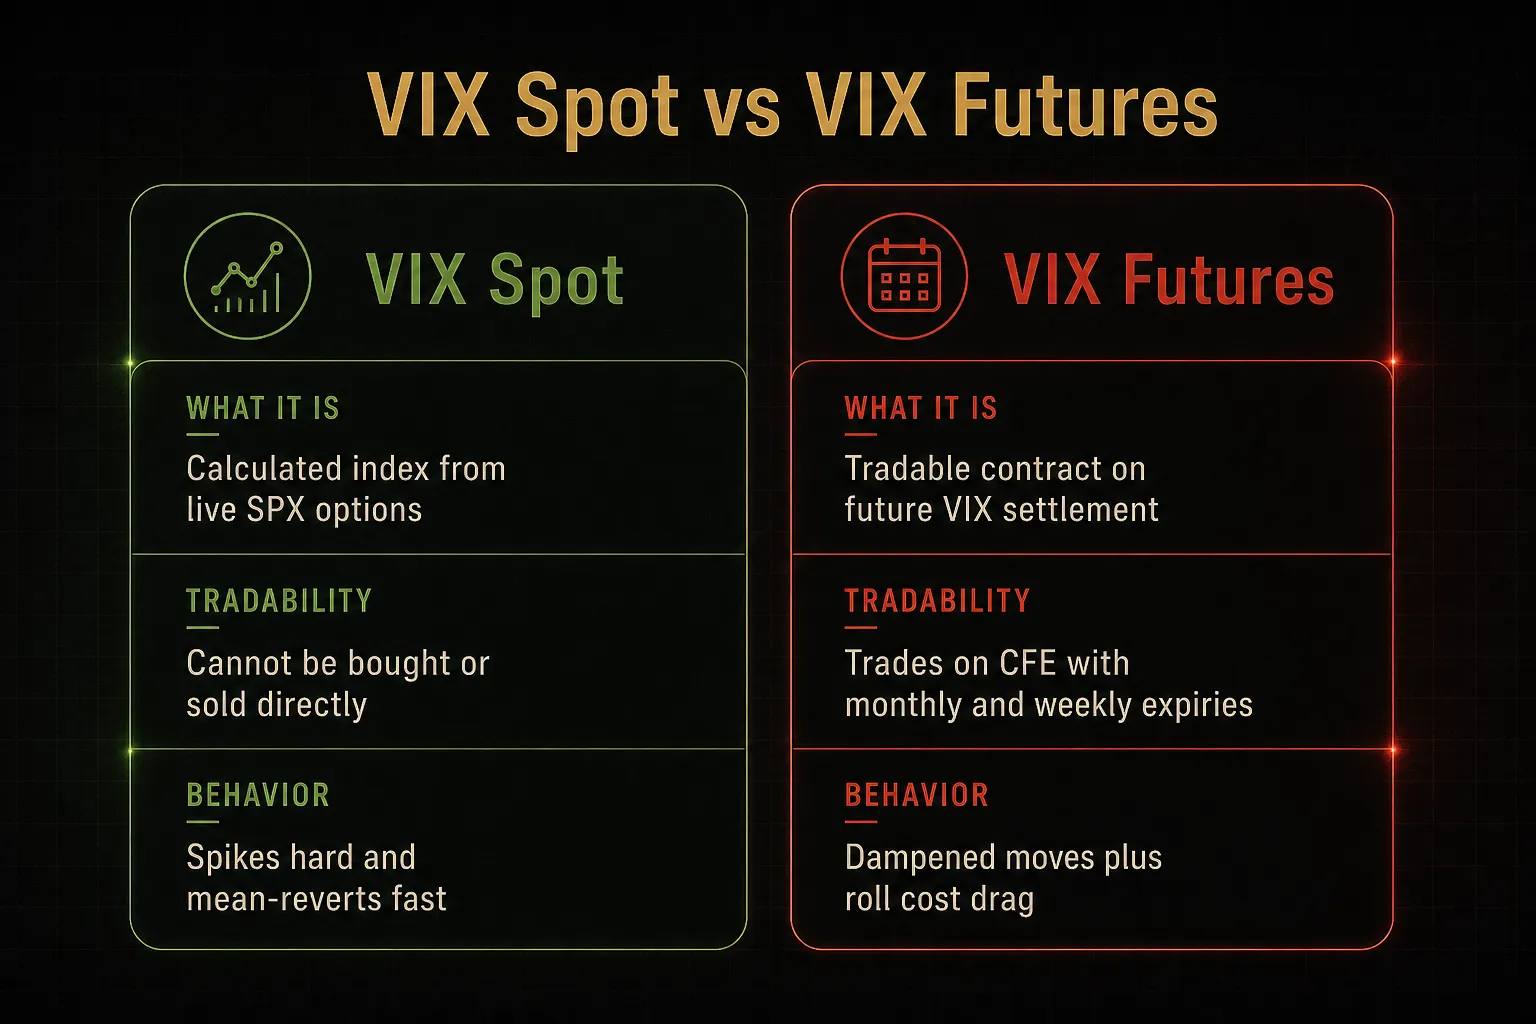
The gap between them is the VIX futures basis. In calm markets futures trade above spot, so anyone holding a long volatility product pays a roll cost every single day as contracts converge downward toward the index.
That structural drag is why volatility ETPs lose value over time even when the VIX itself goes nowhere. It is not a flaw in the products.
It is the design.
VVIX and Beyond
VVIX measures the implied volatility of VIX options.
Volatility of volatility.
It sounds abstract until you watch it in a stress event.
When VVIX pushes above 120 while the VIX itself is still modest, it signals that traders are aggressively bidding for convexity, buying protection on their protection. That often precedes a larger dislocation, making VVIX one of the better early-warning gauges for stress inside the options market itself.
The concept extends well past equities.
OVX applies the same methodology to United States Oil Fund options for crude volatility, and GVZ does it for gold. Cboe also publishes volatility indexes on Nasdaq-100 (VXN), Russell 2000 (RVX), and major currency pairs.
Commodity traders use OVX exactly like equity traders use VIX: as a regime read, not a directional call.
Reading VIX Levels the Right Way
High and Low Thresholds in Context
A VIX of 20 is meaningless without context.
Twenty after three months at 12 is a warning. Twenty after two weeks at 38 is relief.
The useful frame is historical volatility percentile.
Compare the current print against its own distribution over the trailing one to three years and ask where it sits. A reading in the 10th percentile means complacency is priced in and hedges are cheap. Above the 90th percentile means protection is expensive and mean reversion odds favor sellers.
Speed matters as much as level.
A VIX that climbs from 14 to 22 over four weeks reflects gradual repricing. The same move in a single session reflects a shock, and shocks behave differently: they overshoot, then collapse.
Rough working bands, with the caveat that regime beats threshold every time: below 13 signals compressed volatility and complacency risk, 13 to 20 is a normal functioning market, 20 to 30 marks elevated stress, and above 30 indicates crisis pricing where correlations converge toward one.
Why VIX and Stocks Can Rise Together
The VIX and the S&P 500 move in opposite directions roughly 75% to 80% of the time. Which means the other 20% happens far more often than most traders assume, and it confuses people every time.
Four common causes:
- Hedging demand ahead of a known catalyst. Institutions buy protection into an FOMC meeting or election while continuing to hold equity exposure, lifting implied volatility and price simultaneously.
- Sector dispersion. A handful of mega-caps drag the index higher while the rest of the market churns, raising the option-implied uncertainty embedded in SPX options despite a green headline number.
- Positioning and option skew shifts. Heavy call buying in a melt-up bids implied volatility on the upside, flattening option skew and pushing the VIX up alongside price.
- Index rebalancing and expiration flows. Quarterly rolls and large delta-hedging requirements can distort the option strip for a few sessions regardless of trend.
A rising VIX in a rising market is often the most valuable signal available. It says the smart money is paying up for insurance while the tape looks fine.
Contango and Backwardation Signals
Contango describes a futures curve sloping upward: front-month VIX futures priced above spot, later months priced above the front. This is the default state roughly 80% of trading days, and it signals a calm, functioning market.
Backwardation inverts the curve.
Front-month futures trade below spot, and the market is saying near-term stress exceeds anything expected further out. Backwardation appears during roughly 15% to 20% of sessions and clusters tightly around corrections.
Practically: contango punishes long volatility holders through roll decay and rewards systematic short-volatility strategies until it doesn’t. Backwardation flips the math, rewarding long volatility while making short-volatility positions genuinely dangerous.
Many traders track the VIX to VIX3M ratio as a single-number proxy.
Below 0.90 means steep contango and calm conditions. Above 1.00 means inversion and active stress.
Turning VIX Data into a Trading Edge
Estimating Expected Price Range
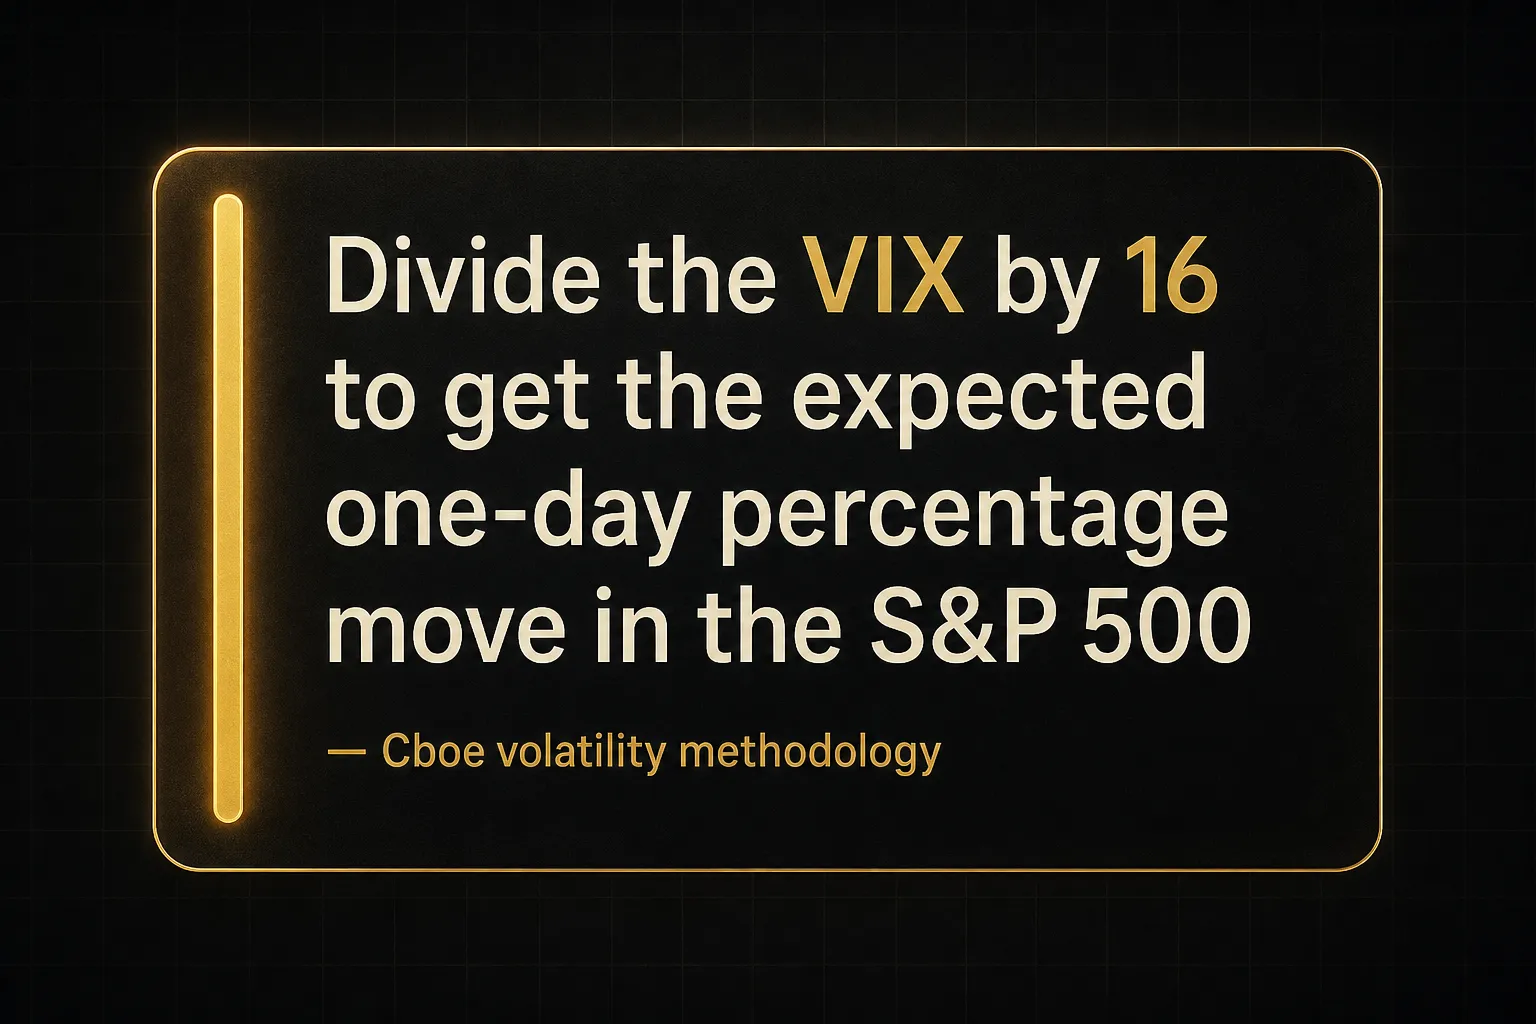
The single most practical use of the VIX takes about ten seconds of arithmetic. Because the index is annualized and there are roughly 252 trading days in a year, dividing by the square root of 252 (about 16) converts it into an expected one-day move.
- Take the current VIX print. Say the VIX reads 20 and the S&P 500 sits at 6,000.
- Divide by 16 for the daily move. 20 ÷ 16 = 1.25%, or roughly 75 index points of expected daily movement at one standard deviation.
- Scale to your holding period. Multiply the daily figure by the square root of the number of days. For a five-day swing trade: 1.25% × √5 = 2.8%, about 168 points.
- Set stops outside the noise band. A stop placed 40 points away in that environment is inside one standard deviation of ordinary daily movement. It will get hit by noise, not by a thesis failure.
- Set targets inside the plausible range. Targeting a 400-point move in five days when the market prices 168 means you are betting on a two-plus sigma event. Possible, but not a base case.
This is the fastest way to sanity-check a trade plan.
If your stop and target don’t fit inside the volatility the market is actually pricing, the plan is wrong before you click.
Position Sizing and Risk Controls
Rising volatility should change your size, not your direction.
That is the whole discipline in one sentence.
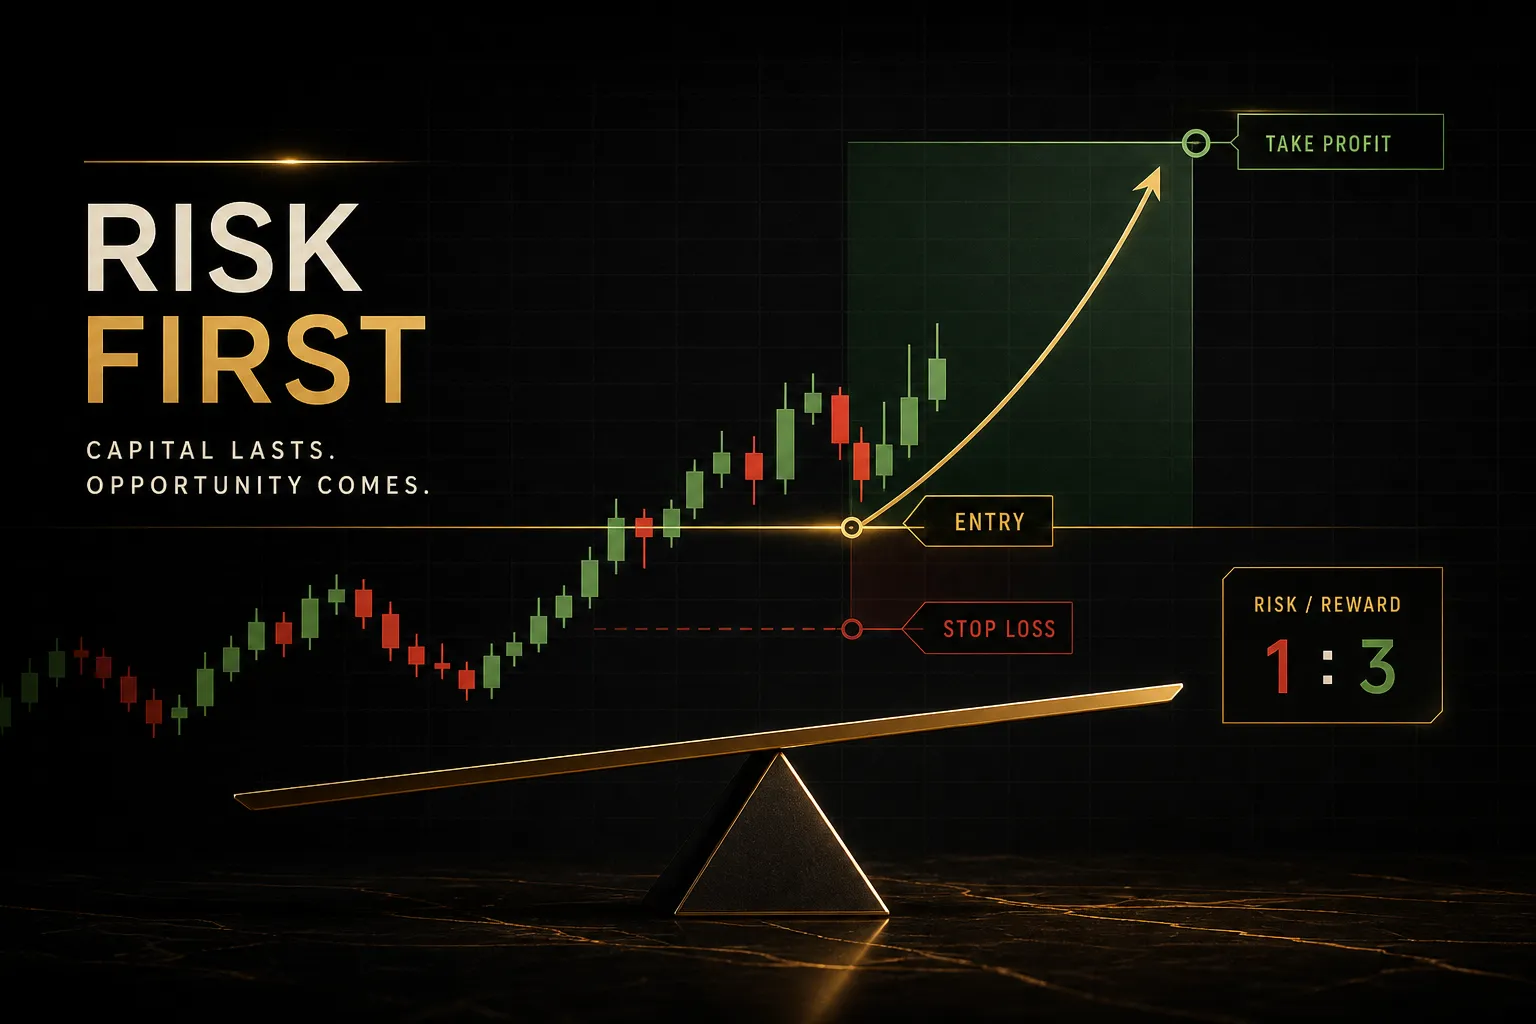
- Anchor risk to a fixed account percentage. Decide you will risk 0.5% or 1% per trade and hold that constant regardless of conviction.
- Let volatility set the stop distance. Use average true range on your trading timeframe, or the VIX-derived expected move, to place the stop where invalidation actually lives.
- Solve for share or contract count. Position size equals dollar risk divided by stop distance. When the VIX doubles, the stop widens and the position shrinks automatically.
- Cut gross exposure in backwardation. When the curve inverts, correlations rise and diversification stops working. Many desks cut total exposure by 30% to 50% in these windows.
- Reassess when VIX9D crosses VIX3M. That crossover is a clean, objective trigger for a portfolio-wide risk management review rather than a discretionary gut call.
Combining VIX with Trend Confirmation
The VIX tells you how much the market might move. It says nothing about which way.
So it belongs in the confluence stack, never at the front of it.
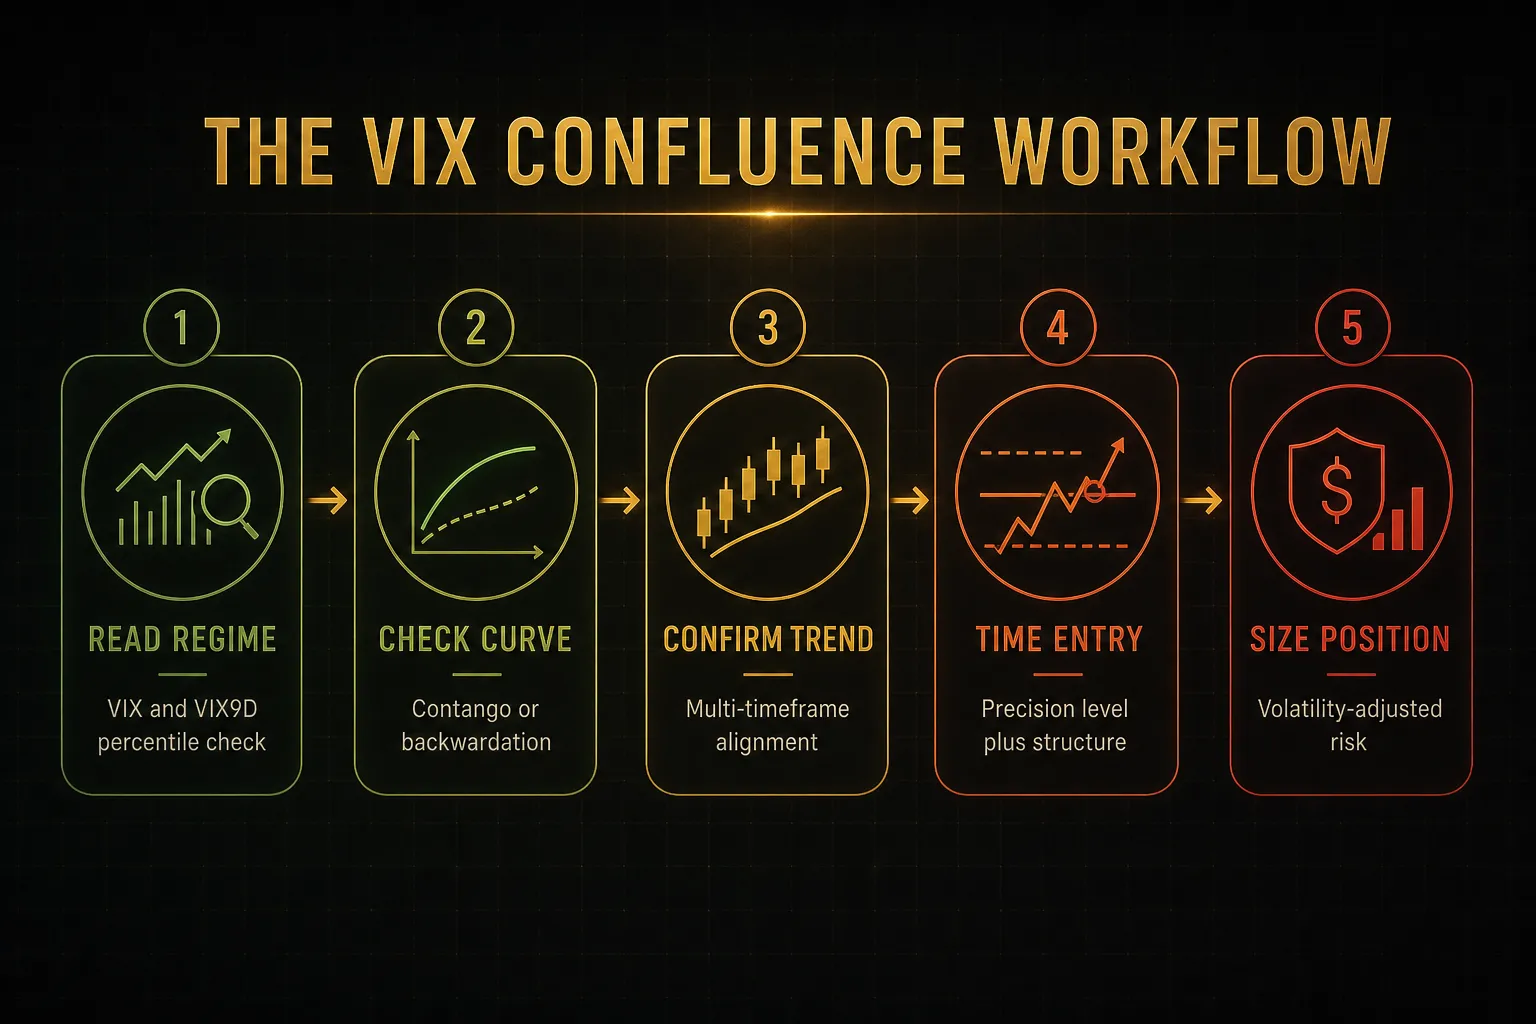
- Establish regime first. Check the VIX percentile and the VIX9D to VIX3M relationship before looking at any chart. This sets whether you are trading a trend-friendly or chop-heavy environment.
- Confirm direction with trend tools. Use a multi-timeframe trend table, such as PipTrend’s, to verify that higher timeframes agree before committing. Volatility context plus conflicting trend signals equals no trade.
- Locate the entry with structure. Precision entry levels, prior support and resistance, and clear invalidation points determine where you get in. The VIX determines how far away the stop sits.
- Apply the volatility-adjusted size. Feed the expected range into the position sizing formula from the previous step.
- Accept what the VIX cannot do. It does not call tops. It does not call bottoms. Extreme readings have historically clustered near turning points, but “clustered near” is not “predicted,” and traders who front-run VIX spikes routinely catch falling knives.
VIX Questions Traders Ask Most
What is the VIX index in simple terms?
The VIX is the market’s estimate of how much the S&P 500 will move over the next 30 days, expressed as an annualized percentage. It is calculated from live SPX option prices, so it reflects what traders are actually paying for exposure to future movement. A VIX of 16 implies roughly a 1% average daily swing.
It measures magnitude only, never direction.
What do the different VIX indexes mean?
Each VIX variant measures expected volatility over a different time horizon. VIX1D covers one trading day, VIX9D covers nine days, the standard VIX covers 30, and VIX3M, VIX6M and VIX1Y extend to three months, six months and a year.
Comparing them reveals the volatility term structure, which is where the actual signal lives. VVIX measures the volatility of the VIX itself.
What is a good VIX level to buy stocks?
There is no VIX level that reliably signals a buy.
Historically, elevated readings above the 90th percentile have coincided with better forward returns, but the VIX has also gone from 30 to 80 in a matter of days. Use percentile context and pair the reading with trend confirmation and support levels rather than treating any number as an entry trigger.
Is a high VIX bullish or bearish?
A high VIX is neither.
It indicates the options market expects large moves in either direction, and it typically appears after prices have already fallen. Extreme readings often mark capitulation zones, but they can also mark the beginning of a longer stress period.
Treat high VIX as a signal to reduce size, not as a directional bet.
What is the difference between VIX and VIX futures?
The VIX is a calculated index that cannot be traded, while VIX futures are contracts on where the VIX will settle at a specific future date. Futures usually trade above spot in calm markets (contango), which creates a persistent roll cost.
That decay makes VIX futures, VIX options and volatility-linked ETPs unsuitable as long-term buy-and-hold positions, and several such products have lost the large majority of their value over multi-year periods.
How do you use the VIX index for trading?
Use the VIX to size positions and set stop distances, not to pick direction. Convert the reading into an expected trading range by dividing by 16 for a daily estimate, then check the term structure for regime context. Confirm any actual entry with trend and price structure.
The VIX works as a filter, never as a standalone system.
The Bottom Line on Volatility Data
VIX indexes answer one question well: how much movement is the market pricing? They answer nothing about direction, and every losing trade built on a VIX print traces back to confusing those two things.
A simple decision rule covers most situations.
When VIX9D spikes while VIX3M stays flat, treat it as isolated event risk, hold your structure, and expect fast volatility decay afterward. When both rise together, the regime has changed, and the correct response is tighter risk across every open position, not a contrarian bet.
Volatility is context.
Trend and structure are the trade.
Traders who consistently pull money out of markets combine a clear read on market regime with disciplined entry tools and volatility-adjusted sizing, rather than reacting to a single index print flashing red on a screen.
Check the curve.
Confirm the trend.
Size for the range you actually have.
Sources
Risk Disclaimer: Trading involves risk. Past performance doesn't guarantee future results. Only trade with money you can afford to lose. PipTrend is a tool to assist your trading decisions, not financial advice.