Standard & Poor's 500 Index Explained for Beginners
On this page
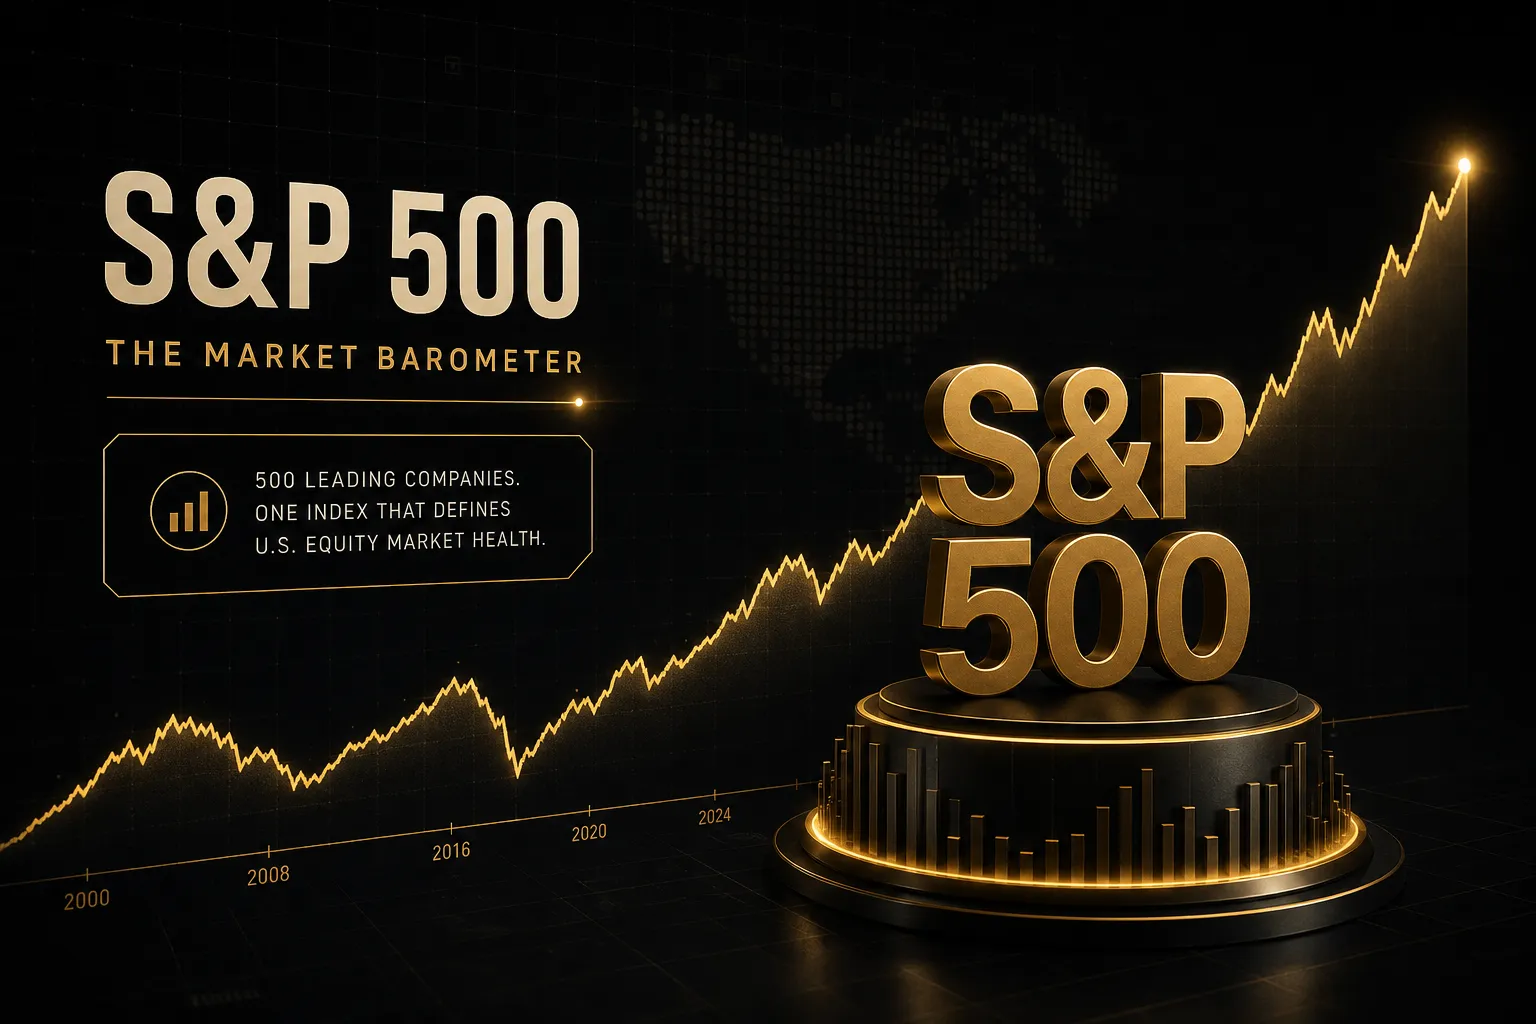
What the S&P 500 Really Is
The Standard & Poor’s 500 index tracks somewhere north of $45 trillion in combined market value. That is more than the annual economic output of the United States, China, and Japan combined.
It’s the most quoted number in finance.
It’s also one of the most poorly explained.
Most beginner guides tell you the S&P 500 is “the 500 biggest American companies” and stop there.
That description is wrong in at least three ways, and those errors matter the moment you try to actually put money behind it.
This guide separates two things that almost every article blurs together: the index itself, which is a calculation, and the products built on top of it, which are what you can actually buy.
An ETF, a futures contract, and a CFD tied to the same index behave very differently in your account.
Different costs, different hours, different leverage, different risks.
We’ll cover how companies get selected, how float-adjusted market capitalization decides whose movements matter, and why a mechanism called the index divisor keeps the number honest through stock splits and reshuffles.
Then we’ll shift from definition to practice. Later sections look at how traders read S&P 500 price action across timeframes, including how PipTrend’s multi-timeframe alignment view is used to check whether a move has support beyond a single chart.
Definitions are the foundation.
Reading the market is the point.
What the S&P 500 Actually Measures
Here’s a question that trips up most new investors: if the S&P 500 goes up 1%, did 500 companies each gain 1%?
Not remotely.
On a typical day, a handful of names drive the majority of the move while hundreds of constituents go the other direction.
Understanding why requires knowing what the index is actually measuring.
What S&P Stands For
S&P stands for Standard & Poor’s, the result of a 1941 merger between Poor’s Publishing and the Standard Statistics Company. The modern index in its 500-company form launched in 1957.
Today the index is maintained by S&P Dow Jones Indices, a joint venture that also runs the Dow Jones Industrial Average and hundreds of other benchmarks. They set the methodology, run the index committee, and publish the rules that govern additions and removals.
The index is designed to measure the performance of large-cap U.S. equities. Roughly 500 companies, selected to represent the leading edge of the American public market across all GICS sectors, from information technology to utilities.
Note the word “represent.”
The S&P 500 is a sample, not a census.
Why 500 Isn’t Exactly 500 Stocks
The index contains about 500 companies but usually more than 500 individual securities.
The reason is share classes.
Alphabet, for example, has both Class A shares (GOOGL) and Class C shares (GOOG) in the index.
Same company, two separate listings, both counted.
Fox Corporation and News Corp have carried similar dual-class structures.
So the security count typically sits around 503 to 505, depending on the month. If you’ve ever seen two different sources give two different numbers, this is usually why.
The S&P 500 tracks approximately 500 companies but often holds 503 to 505 tradable securities, because companies with multiple share classes get counted more than once.
How It Differs From the Dow and Nasdaq-100
Three indices dominate American financial headlines, and they measure completely different things using completely different math.
The Dow Jones Industrial Average holds just 30 companies and uses price weighting. A stock trading at $600 carries roughly twelve times the influence of one trading at $50, regardless of company size.
It’s an accident of history that survives because the number is famous, not because the method is sound.
The Nasdaq-100 holds 100 non-financial companies listed on the Nasdaq exchange. Heavy technology concentration by design, no banks or insurers, and a modified market-cap weighting scheme with caps on the largest names.
The S&P 500 uses float-adjusted market capitalization weighting across a much broader industry mix. Bigger companies get bigger weights, and only shares available to the public count toward that calculation.
Which brings us to the misconception worth killing outright.
The S&P 500 is not “the U.S. economy.”
It excludes nearly all small- and mid-cap companies, excludes private businesses entirely, and has grown extraordinarily concentrated at the top.
In recent years, the ten largest constituents have accounted for well over 30% of the index’s total weight. The information technology sector alone regularly exceeds 30%.
When people say “the market was up today,” they often mean seven or eight mega-cap stocks were up today.
How Companies Are Selected and Weighted
There is no algorithm that automatically admits the 500 largest U.S. companies.
There is a committee.
Actual humans, meeting behind closed doors, deciding who gets in.
That surprises people.
It shouldn’t.
Rules-based inclusion would create predictable front-running and force the index to hold companies that meet a size test but fail every quality test.
The Committee and Eligibility Rules
The S&P Index Committee selects constituents according to the published methodology from S&P Dow Jones Indices. The criteria are updated periodically, which is why quoting fixed dollar thresholds as permanent facts is a mistake.
Always check the current methodology document.
The screening framework covers several dimensions:
- Market capitalization. A company must exceed a minimum unadjusted market cap that S&P raises over time as the overall market grows. It has moved up repeatedly across the past decade.
- Profitability. The company must post positive GAAP earnings in the most recent quarter and positive cumulative earnings across the trailing four quarters. This single rule kept several famous high-growth names out for years.
- Liquidity. A minimum ratio of annual dollar volume traded relative to float-adjusted market cap, ensuring the stock can absorb index-fund flows without dislocating.
- Public float. At least 10% of shares outstanding must be available to public investors. Founder-controlled companies with tiny floats are ineligible.
- Domicile and listing. The company must be U.S.-domiciled and listed on an eligible U.S. exchange.
- Sector balance. The committee weighs how additions affect representation across GICS sectors, aiming to keep the index reflective of the broader large-cap market.
Meeting every criterion guarantees nothing.
Eligibility is necessary, not sufficient.
The committee decides.
Float-Adjusted Weighting With Numbers
Once a company is in, its influence depends entirely on float-adjusted market capitalization. That’s share price multiplied by shares outstanding, then multiplied by the percentage of shares actually available to public investors.
Compare two hypothetical constituents.
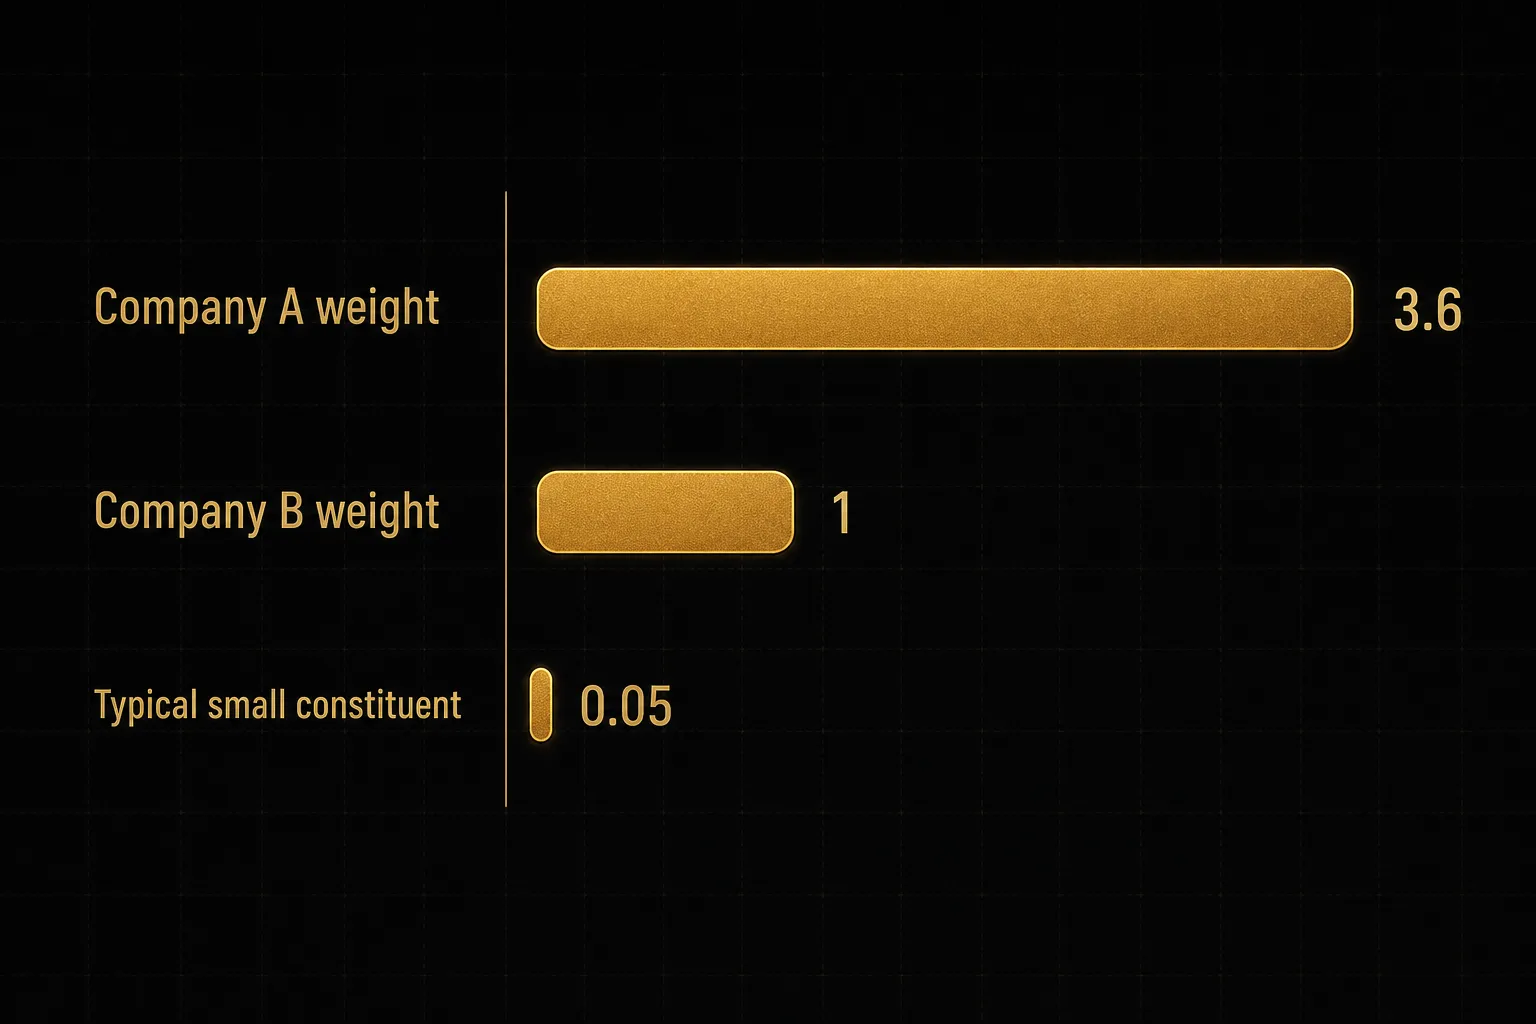
Company A has a $2 trillion total market cap with a 90% public float. Its float-adjusted cap is $1.8 trillion.
Company B has a $500 billion market cap with a 100% float. Its float-adjusted cap is $500 billion.
Company A therefore carries 3.6 times the index weight of Company B. If the index’s total float-adjusted value is $50 trillion, Company A holds a 3.6% weight and Company B holds 1%.
Now watch what happens to the index level.
Company A rises 1%. That contributes roughly 0.036% to the index.
Company B rises 5%, a far more dramatic day for its shareholders, and contributes only 0.05%.
Barely more, despite a move five times larger.
Take it further.
A constituent with a 0.05% weight, which describes the bottom hundred or so names in the index, would need to gain 72% in a single session to match what Company A does with a 1% move.
This is why market capitalization weighting produces the concentration effect discussed earlier.
The index isn’t democratic.
It’s proportional, and proportions at the top are enormous.
The Divisor Keeps It Stable
If the index simply summed the float-adjusted market caps of its constituents, the number would be a meaningless multi-trillion figure that jumped violently every time a company was swapped in or out.
The index divisor solves this.
The index level equals total float-adjusted market cap divided by the divisor, a proprietary number that S&P adjusts whenever a non-market event would otherwise distort the value.
Those events include stock splits, share issuance and buybacks, spin-offs, mergers, special dividends, and constituent changes. When a $400 billion company replaces a $80 billion company, the divisor shifts so the index level stays continuous through the swap.
The core principle: the index level should change only because prices changed, never because the composition changed.
Worth mentioning the alternative.
The equal-weight version of the S&P 500 assigns every constituent roughly 0.2% and rebalances quarterly. It reduces concentration risk substantially, tilts toward mid-sized constituents, and can perform very differently.
In years when mega-cap technology leads, the standard index typically wins. When leadership broadens, equal weight often outperforms.
Index, ETF, Futures, or CFD?
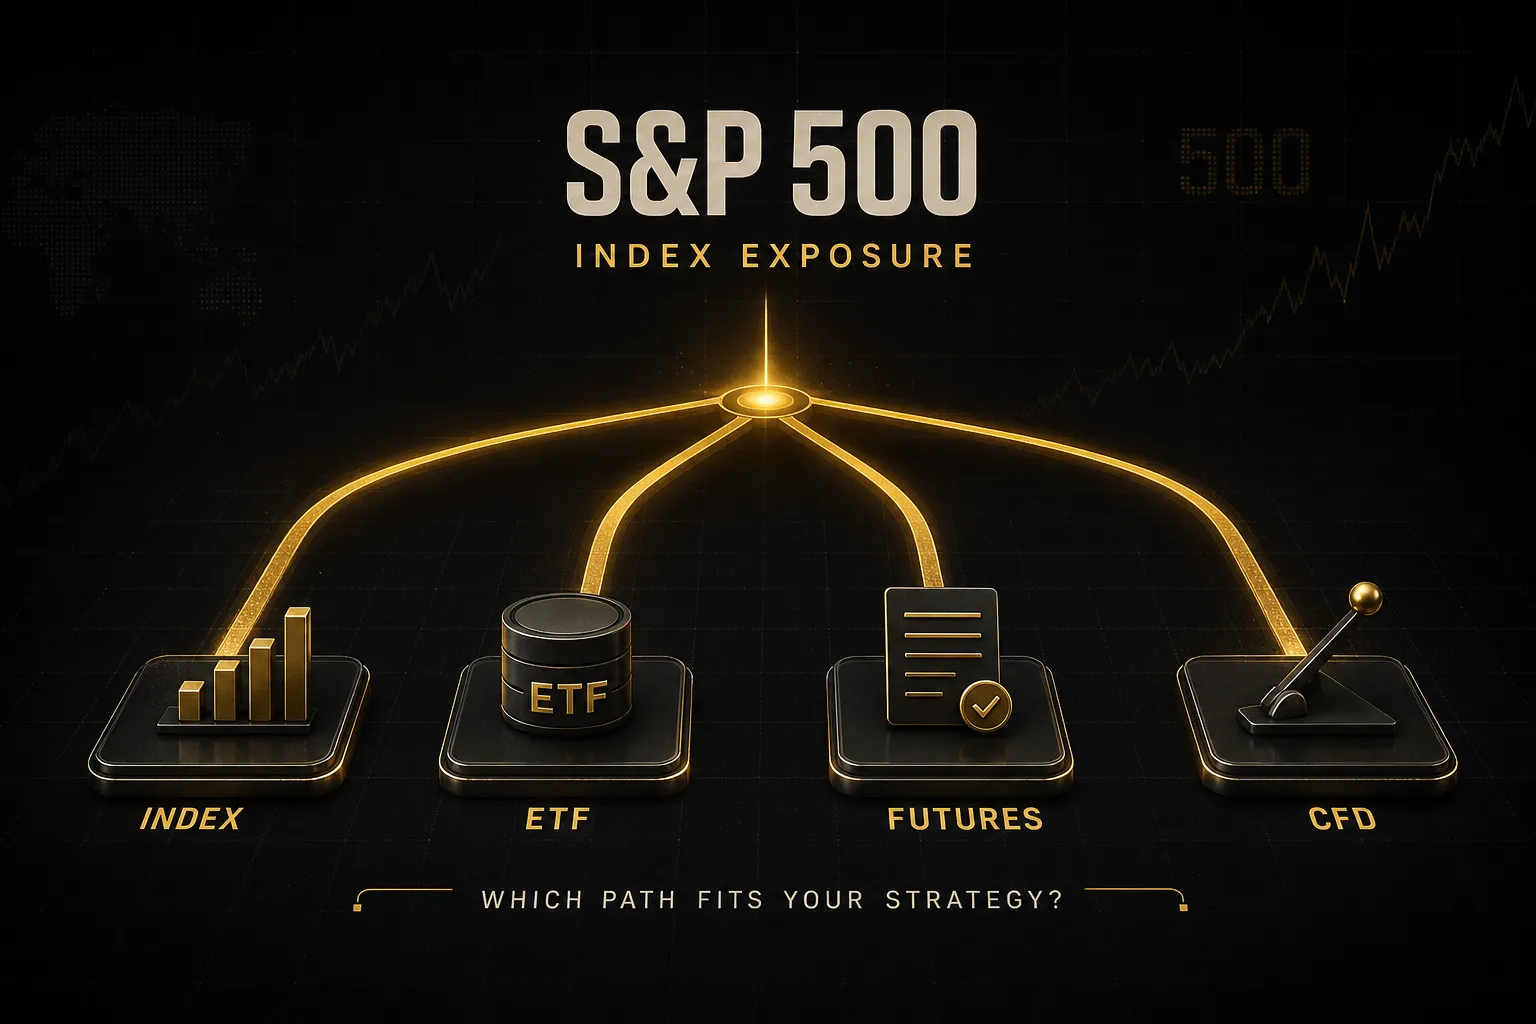
Here’s the thing nobody tells beginners clearly enough: you cannot buy the S&P 500.
Not a single share of it exists.
The index is a calculation published by S&P Dow Jones Indices.
It has no shares, no NAV, no dividend.
What you can buy are financial products that track it.
Index vs ETF vs Mutual Fund
An index fund is a pooled vehicle that holds the underlying constituent stocks in their index proportions, then issues shares in itself.
That’s the product you own.
The main routes for investors:
- SPY ETF (SPDR S&P 500 ETF Trust), launched in 1993, the oldest U.S. ETF and typically the most heavily traded. Structured as a unit investment trust, which means it cannot reinvest dividends internally.
- IVV (iShares Core S&P 500 ETF) and VOO (Vanguard S&P 500 ETF), both structured as open-end funds with lower expense ratios, generally around 0.03% annually versus roughly 0.09% for SPY.
- Index mutual funds, which price once daily at the close rather than trading continuously. Common inside 401(k) plans, often with no trading commission but no intraday flexibility.
All of them hold real stock.
Your ownership is direct, held by a custodian, and unaffected if the broker fails.
Price Return vs Total Return
This distinction causes more performance-comparison errors than any other, and it is genuinely simple.
The headline S&P 500 number you see on television is a price return index.
It reflects share price movement only.
Dividends are ignored entirely.
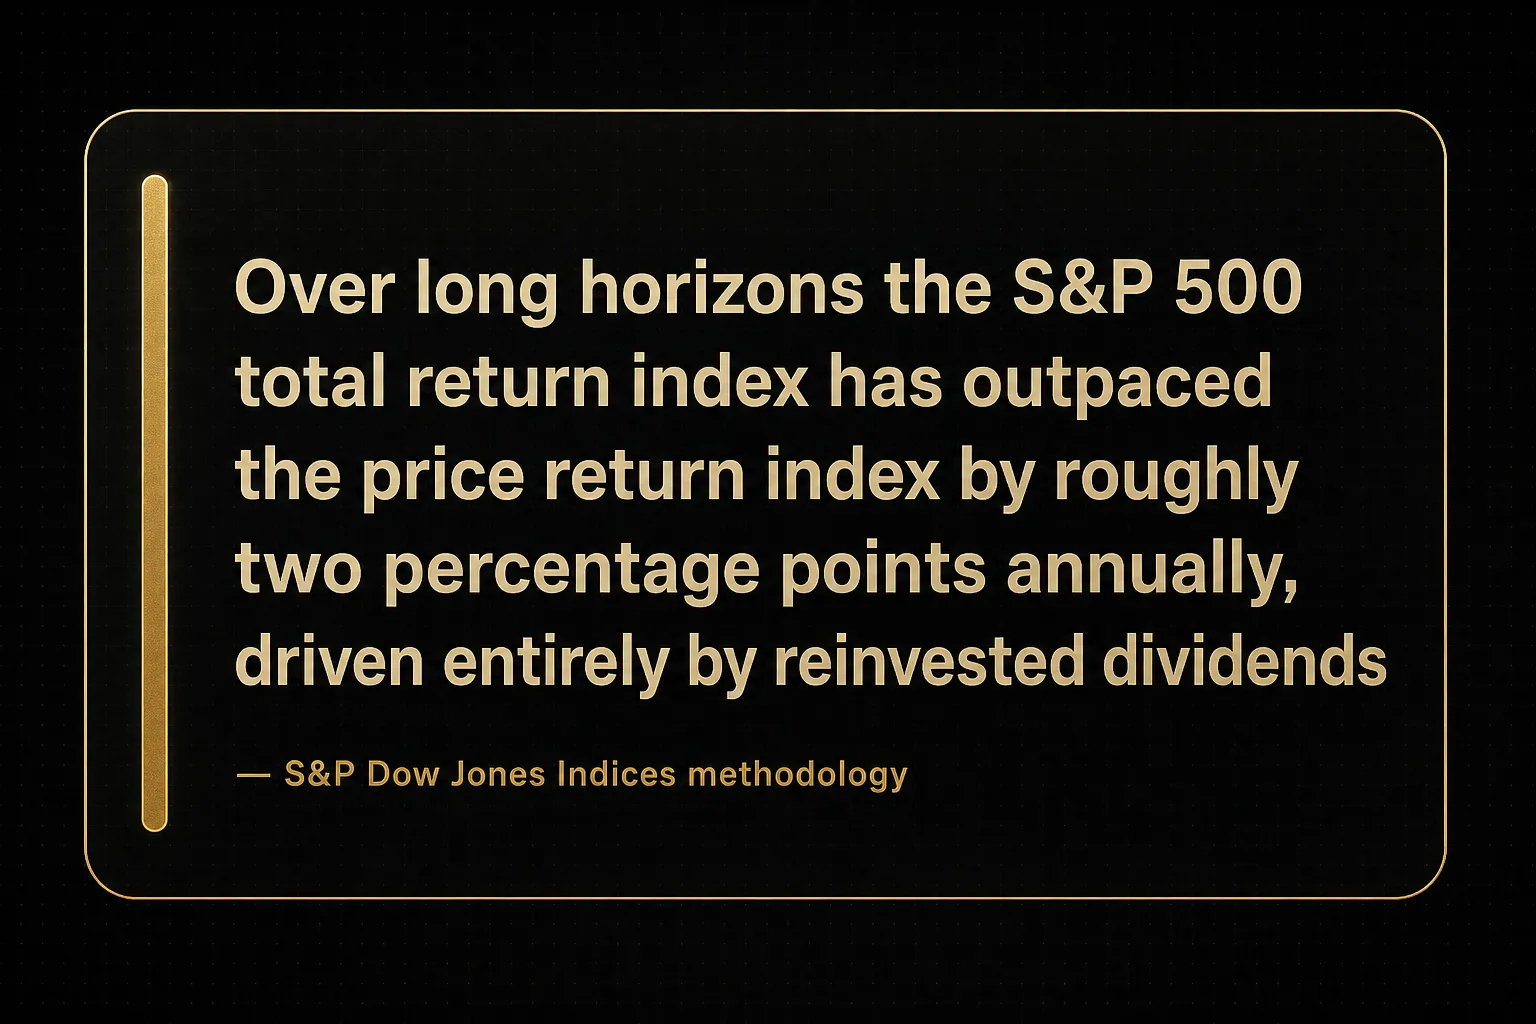
The total return index assumes all dividends are reinvested on the ex-date. The net total return index does the same but deducts withholding taxes at the rate applicable to a foreign investor.
The gap compounds.
With an S&P 500 dividend yield historically averaging around 2%, total return has outpaced price return by roughly 1.8 to 2 percentage points per year over long stretches.
Over three decades, that difference roughly doubles the ending value.
So when someone compares their ETF’s performance to “the S&P 500” and finds a persistent gap, the fund isn’t necessarily lagging. They’re comparing a dividend-paying fund against a dividend-blind index.
SPX, SPY, ES, and MES Compared
Four tickers, one underlying index, four completely different instruments.
| Instrument | What It Is | Contract / Share Size | Leverage | Trading Hours | Typical User |
|---|---|---|---|---|---|
| SPX | The cash index itself, a published calculation | Not tradable; used as settlement reference for options | None (not tradable directly) | Calculated during U.S. regular session, 9:30am to 4:00pm ET | Benchmark reference, options settlement |
| SPY | ETF share holding the underlying stocks | Roughly 1/10th of the index level per share | None by default; up to 2:1 on margin accounts | 9:30am to 4:00pm ET, plus extended sessions | Long-term investors, swing traders, options traders |
| ES (E-mini S&P 500) | CME futures contract | $50 x index level (about $300k notional at 6000) | High; margin is a small fraction of notional | Nearly 23 hours, Sunday evening to Friday afternoon ET | Institutions, professional traders, hedgers |
| MES (Micro E-mini S&P 500) | CME futures contract, 1/10th size of ES | $5 x index level (about $30k notional at 6000) | High, but smaller absolute exposure per contract | Same near-23-hour schedule as ES | Retail futures traders, precise position sizing |
S&P 500 futures matter for one reason beyond leverage: they trade almost around the clock. When you see “futures are down 400 points” at 3am, that’s ES pricing, not the SPX index, which isn’t being calculated at all.
A fourth category exists in many jurisdictions. CFDs, or contracts for difference, are agreements with a broker to exchange the price change in the index.
You own nothing.
There’s no underlying stock, no exchange clearinghouse standing behind the trade, and your counterparty is the broker itself.
CFDs typically offer high leverage and overnight financing charges, and they’re prohibited for retail clients in the United States. The risk profile differs meaningfully from both ETFs and exchange-traded futures.
Reading the S&P 500 Like a Market
Knowing what the index measures is step one. Step two is understanding why it moves 1.5% on a Tuesday and then does nothing for a week.
What Moves the Index Daily
Five categories of information account for the bulk of large single-day moves.
- Interest rate decisions and central bank guidance. Federal Reserve meetings, the dot plot, and the tone of the press conference. The index’s interest-rate sensitivity is elevated because long-duration growth stocks dominate the top weights, and their valuations depend heavily on discount rates.
- Earnings season. Roughly four weeks each quarter when constituents report. What matters is the gap between results and earnings expectations, plus forward guidance. A company can beat estimates and still fall 8% on a weak outlook.
- Inflation data. CPI and PCE releases, which shape rate expectations directly. CPI mornings routinely produce the widest opening ranges of the month.
- Employment reports. Monthly nonfarm payrolls, weekly jobless claims, and wage growth figures, all read through the lens of what they imply for policy.
- Broad risk sentiment. Geopolitical events, credit market stress, currency moves, and positioning unwinds that have nothing to do with fundamentals.
Trend, Breadth, and Volatility Basics
Price alone tells you less than you think.
Three additional dimensions of market structure fill in the picture.
Trend is the sequence of highs and lows across the timeframe you’re actually trading. A daily-chart uptrend can contain multiple 15-minute downtrends.
Neither invalidates the other, and confusing the two is a common source of frustration.
Market breadth measures participation.
If the index gains 0.6% while only 180 of 500 constituents advance, a handful of mega-caps carried it.
Narrow breadth doesn’t guarantee reversal, but it flags a rally with thin foundations.
Volatility regime describes the current character of price movement.
Low-volatility regimes produce grinding trends and shallow pullbacks. High-volatility regimes produce wide ranges, frequent gaps, and stops that get hit on noise.
The same strategy performs completely differently across the two.
Then there’s the session gap.
The cash SPX index is only calculated during U.S. regular hours, so overnight developments appear as a gap at the open. Futures traders saw those moves happen in real time.
Same market, two different pictures of it.
When evaluating any strategy, compare it against the index properly.
Raw profit is almost meaningless in isolation.
- Excess return. Your return minus the S&P 500’s return over the identical period. Making 12% while the index made 20% is underperformance, full stop.
- Maximum drawdown. The largest peak-to-trough decline in your equity curve. The index itself has experienced drawdowns exceeding 50% twice since 2000.
- Win rate paired with average win-to-loss ratio. Either number alone is easy to game. Together they describe the actual edge.
- Risk-adjusted return. Return per unit of volatility taken. This is where benchmark performance comparisons become honest.
Confirming Moves With Multi-Timeframe Tools
Most losing trades on index products come from a single mistake: acting on a signal from one chart while the broader structure points the other way.
That’s the problem multi-timeframe analysis addresses. PipTrend’s 12-timeframe alignment table displays trend direction across every horizon at once, from the 1-minute up through monthly, so you can see immediately whether a setup has agreement behind it or is fighting the dominant flow.
The color-coded trend candles work alongside it, shading price bars by prevailing direction so shifts are visible without cross-referencing multiple windows.
A practical use: a bullish 5-minute signal on the E-mini S&P 500 while the hourly, 4-hour, and daily all read bearish is a countertrend trade.
It can work.
But it deserves a smaller position and a tighter invalidation level than a setup where nine or ten timeframes align.
Indicators identify confirmation and invalidation levels. They do not predict direction, and no alignment reading changes that.
Tools narrow the field of reasonable trades.
Position sizing and stop placement determine what happens to your account.
Those two things sit with you, not the software, and they matter more than any signal on the screen.
S&P 500 Questions People Ask
What is the S&P 500 in simple terms?
The S&P 500 is a number that tracks the combined value of roughly 500 large U.S. companies, weighted by float-adjusted market capitalization. It’s maintained by S&P Dow Jones Indices and used as the default benchmark for the American stock market.
Think of it as a scoreboard, not a product. It measures performance rather than offering anything to buy.
How does the S&P 500 make money?
The index itself doesn’t make money because it isn’t an investment. It’s a calculation, and it has no assets, no revenue, and no dividend of its own.
Investors earn returns through funds that track it, collecting price appreciation plus the dividends those funds receive from the underlying constituent stocks. S&P Dow Jones Indices earns revenue by licensing the index to fund providers.
Can you buy shares of the S&P 500?
No, and this is the single most common misunderstanding. You cannot purchase a share of the index because no such share exists.
“Buying the S&P 500” means buying a fund that holds its constituents, most commonly the SPY ETF, IVV, VOO, or an equivalent index mutual fund inside a retirement account. You can also gain exposure through S&P 500 futures or, in some jurisdictions, CFDs, though those carry leverage and different risk profiles.
What is the difference between the S&P 500 and the Dow?
The S&P 500 holds around 500 companies weighted by float-adjusted market cap, while the Dow holds 30 companies weighted by share price.
That weighting difference is fundamental.
In the Dow, a high-priced stock dominates regardless of company size. In the S&P 500, the largest companies dominate regardless of share price.
The S&P 500 is the broader and more statistically meaningful measure of large-cap U.S. equities.
How many stocks are in the S&P 500?
The index tracks about 500 companies but typically holds 503 to 505 individual securities. The extra listings come from companies with multiple share classes, such as Alphabet’s GOOGL and GOOG, which are counted separately.
The exact security count shifts as constituents are added, removed, or restructured throughout the year.
Is the S&P 500 a good investment for beginners?
Low-cost S&P 500 index funds are widely recommended as a starting point because they provide instant diversification across roughly 500 large companies at expense ratios near 0.03%. That’s the standard case for them.
The trade-offs are real, though.
The index is concentrated in mega-cap technology, excludes small- and mid-cap companies almost entirely, and has fallen more than 50% from peak to trough twice since 2000.
Suitability depends on your time horizon and tolerance for drawdown, not on the index’s reputation.
Putting the Index in Perspective
One distinction carries more weight than everything else in this guide.
The S&P 500 is a measurement tool.
SPY, IVV, VOO, the E-mini and Micro E-mini futures, and CFDs are the vehicles you use to act on that measurement.
Confusing the two leads to expensive surprises.
So before you open any position tied to the S&P 500, answer one question honestly: am I holding an ETF, a futures contract, or a CFD?
Each carries different costs, different trading hours, different leverage, and different counterparty exposure.
An overnight gap that’s a minor annoyance for an ETF holder can trigger a margin call for a leveraged futures position.
Understanding index mechanics is what makes price action readable. You know why mega-caps dominate moves, why breadth diverges from the headline number, and why futures pricing runs ahead of the cash index.
Tools like PipTrend’s trend candles and multi-timeframe view help structure those decisions and flag where a thesis is invalidated.
They don’t replace position sizing, stop placement, or your own risk management.
Those stay yours.
Sources
Risk Disclaimer: Trading involves risk. Past performance doesn't guarantee future results. Only trade with money you can afford to lose. PipTrend is a tool to assist your trading decisions, not financial advice.